THE UNIVERSAL ROTATION CURVE OF SPIRAL GALAXIES: I. THE DARK MATTER CONNECTION
Abstract
We use a homogeneous sample of about 1100 optical and radio rotation curves (RCs) and relative surface photometry to investigate the main mass structure properties of spirals, over a range of 6 magnitudes and out to and 2 optical radii (for the optical and radio data, respectively). We definitely confirm the strong dependence on luminosity for both the profile and the amplitude of RCs claimed by Persic & Salucci (1991). Spiral RCs show the striking feature that a single global parameter, e.g. luminosity, dictates the rotation velocity at any radius for any object, so unveiling the existence of a Universal RC. At high luminosities, there is a slight discrepancy between the profiles of RCs and those predicted from the luminous matter (LM) distributions: this implies a small, yet detectable, amount of dark matter (DM). At low luminosities, the failure of the LM prediction is much more severe, and the DM is the only relevant mass component. We show that the Universal RC implies a number of scaling properties between dark and luminous galactic structure parameters: (a) the DM/LM mass ratio scales inversely with luminosity; (b) the central halo density scales as ; (c) the halo core radius is comparable to the optical radius, but shrinks for low luminosities; (d) the total halo mass scales as . Such scaling properties can be represented as a curve in the (luminosity)-(DM/LM mass ratio)-(DM core radius)-(DM central density) space, which provides a geometrical description of the tight coupling between the dark and the luminous matter in spiral galaxies.
1 Introduction
It is well known that rotation curves (hereafter RCs) of spiral galaxies do not show any Keplerian fall-off which implies, as a most natural explanation, the presence of an additional and invisible mass component (Rubin et al. 1980; Bosma 1981b; Faber & Gallagher 1979; see also Ashman 1992). In more detail, the profiles of the RCs imply that the distribution of light does not match the distribution of mass: in fact, in each galaxy the local ratio increases with radius by up to a factor . Moreover, decreasing the galaxy luminosity, the light is progressively more unable to trace the radial distribution of the dynamical mass (e.g.: Persic & Salucci 1988, 1990a,b, 1991; Broeils 1992b). This is evident in the Universal Rotation Curve of spirals, pioneered by Rubin and collaborators (e.g., Rubin et al. 1985; see also Burstein & Rubin 1985 for the related concept of ’mass types’) and derived by Persic & Salucci (1991; hereafter PS91) from a sample of 58 late-type spiral RCs. PS91 found that
with , 111 is the disc exponential length-scale; is the optical radius (see below)., log ( denotes luminosities)222A value of the Hubble costant of H km s-1 Mpc-1 is used throughout this paper., and a function linear in log which takes the values of 0.5 and 0 at log and 0.4, respectively. The main features of eq.(1) are: (a) the linear dependence on radius, and (b) the luminosity dependence of the slope
where is a decreasing function of luminosity ranging between and (see PS91). A similar luminosity dependence of the RC shapes is seen also at outer radii (i.e., for ): the RCs of low-luminosity galaxies continue to rise and then flatten out asymptotically, while the RCs of high-luminosity objects show a distinctive drop just outside , followed by an asymptotically flat regime with ) (Salucci & Frenk 1989; see also Casertano & van Gorkom 1991).
This dependence of the RC shapes has a pivotal importance in the dark matter (DM) issue because it implies that the structural properties of dark and luminous matter are connected (see Appendix A), probably as a consequence of the process of galaxy formation itself. In addition, the study of RC profiles can provide a straightforward test for power-law perturbation spectra (Moore 1994), and so it is a crucial aspect in formulating theories of galaxy formation (e.g., Evrard et al. 1994; Navarro & White 1994; Flores et al. 1993; Navarro, Frenk & White 1996).
On the other hand, over the last few years the amount of available data has increased by more than one order of magnitude (e.g., Broeils 1992b; Amram et al. 1992, 1994; Schommer et al. 1993; Persic & Salucci 1995, hereafter PS95). For instance, the PS95 sample (967 curves) is a factor 15 bigger than that used in PS91. It is worthwhile, then, to make a definitive assessment of our previous results (e.g., Persic & Salucci 1988, 1990b, 1991) and of their interpretation in the light of the recent theoretical work. In detail, the aim of this paper is to derive the Universal Rotation Curve of spiral galaxies and to investigate the main properties of the dark matter distribution.
The plan of this paper is the following: in Section 2 we describe the selection criteria and the procedure used to build the RC samples; in Section 3 we introduce two model-independent DM indicators and we study the DM systematics; in Section 4 we derive the Universal Rotation Curve; in Section 5 we discuss some implications of our results for current scenarios of galaxy formation. Finally, in Section 6 we comment on our main results and draw conclusions.
2 Selection Criteria and RC Samples
In order to evaluate the ability of a RC to probe the distribution of matter out to the outskirts of the distribution of the luminous matter (LM), we set a suitable reference scale: , the radius encompassing 83% of the total integrated light. For an exponential surface brightness distribution, , we have 333 For a Freeman disc this corresponds to the de Vaucouleurs 25 -mag/arcsec2 photometric radius.. Therefore, we can consider that the stellar disc has a size and that no appreciable amount of LM exists farther out. Obviously a RC not extended out to gives little information on the underlying gravitational potential (see Lake & Feinswog 1989). Let us now introduce the samples of RCs:
Sample A. It includes 131 individual RCs with a reliable profile out to . To ensure this, we have set the following selection criteria. In order to be included, an RC must: (a) extend out to ; (b) have at least 30 velocity measurements distributed homogeneously with radius and between the two arms; and (c) show no global asymmetries or significant non-circular motions: the profiles of the approaching and receding arms must be compatible. For 21-cm RCs we additionally require that (d) the beam-size be . Let us notice that criterion (b) is also required to apply criterion (c). An RC fulfilling these requirements is generally smooth, with a well-defined profile whose average slope can be estimated with sufficient precision. On the other hand, an RC which fails the above criteria has an ill-defined radial profile and does not faithfully represent the underlying gravitational potential. In Appendix D we report the relevant photometric and kinematical quantities (Table 1) alongside their references (Table 2).
Sample B. The RCs of PS95 are co-added to form 22 synthetic curves, arranged by 11 luminosity bins and 11 velocity bins. Since this procedure averages out most of the observational errors and non-axisymmetric disturbances present in the individual RCs, only criterion (c) is applied and this only to the most severe cases (67 RCs). Instead, we require that RCs be extended at least out to [i.e., a relaxation of criterion (a)], which leads to the elimination of 284 RCs. The final set comprises 616 curves. We derive the synthetic RCs of Sample B as follows.
(i) We normalize each RC to , the velocity at the radius encompassing of the integrated light: for a self-gravitating exponential disc, corresponds to the radius () where the circular velocity peaks (see Freeman 1970). With this normalization, at any radius it can immediately be seen whether the light traces the dynamical mass, by looking at the amplitude and at the profile of a given rotation curve.
(ii) We divide the 616 RCs into 11 luminosity intervals spanning the whole -band luminosity range , and into 11 velocity-amplitude intervals spanning the range km s ( is taken from Mathewson et al. 1992). Each interval, of central luminosity log (velocity amplitude ), typically contains 70 RCs. Within each interval, the normalized velocity data are co-added to obtain the corresponding raw synthetic RCs, and . Each of these has about velocity measurements, and represents the (average) RC for a spiral of luminosity log (velocity amplitude ).
(iii) Finally, we form the smoothed synthetic RCs by averaging the data in radial bins of size .
In Fig.1 (and Fig.14 in Appendix B) we show the luminosity (velocity) sequence of the synthetic RCs. We find that, in the region , the RCs are essentially straight lines, justifying the procedure of Persic & Salucci (1988, 1990b) in deriving their slopes. The present analysis, by co-adding several hundred RCs, is negligibly affected by: a) errors in the assumed galaxy distances and/or inclinations; b) non-axisymmetric disturbances in the RCs; and c) any kind of observational errors. Moreover, we do not assume here a specific functional form to represent the RC. As a result, we confirm (Persic & Salucci 1990b) that the inner slope is a strong (inverse) function of luminosity: steeply rising curves and slightly falling curves are found at the two opposite extremes of the luminosity range, at and at .

The co-addition procedure averages over empirical properties of the galaxies such as Hubble type, strength of bulge, colour, spiral design, and the presence or absence of bars. Since these quantities show, at most, a very loose trend with luminosity (de Vaucouleurs et al. 1991; Biviano et al. 1991; Elmegreen & Elmegreen 1990), we leave the study of the dependence of the Universal Rotation Curve on galaxy morphology to a separate paper (see, however, Section 5).
3 DM Indicators: Systematics of DM
The existence of DM in spiral galaxies is evident from the above considerations. The next step, i.e. to derive the mass structure of the spirals, requires assumption of a mass model in order to analyse the rotation curves appropriately. However, Persic & Salucci (1988, 1990b) have shown that the main features of the dark matter distribution can be obtained more straightforwardly by comparing the light profile and the mass profile (i.e. the RC shape): the inability of the luminous matter to trace the distribution of gravitating matter becomes the signature of a dark component. In detail, given a sample with photometric and kinematical data, at we compute: (a) the slope , where is determined by the self-gravity of the visible matter derived from the surface brightness profile [with no assumption on ]; and (b) the actual slope of the rotation curve . and are computed using the average slopes of and in the range (see, e.g., Persic & Salucci 1990b).
Let us now introduce the quantity which compares the distribution of gravitating matter with that of the luminous matter, ensuring a model-independent detection of a mass discrepancy inside . In fact, the light traces the mass as long as (where the r.h.s. term represents the typical uncertainty in ), while a strong disagreement between the two slopes (i.e., ) implies the presence of a non-luminous component. The difference has an immediate interpretation because, given the similarity of the surface-brightness profiles of normal spirals (see Fig.12) and the relative smallness of the bulge and gas contributions, does not depend on luminosity. In fact we have estimated (see Appendix A) that
Therefore the quantity probes a mass discrepancy inside that we will interpret in terms of a dark component. The values of are reported in Table 3a for the 131 individual RCs of Sample A, and in Tables 3b,c for the 11 + 11 synthetic RCs constructed from Sample B.
![[Uncaptioned image]](/html/astro-ph/9506004/assets/x2.png)
![[Uncaptioned image]](/html/astro-ph/9506004/assets/x3.png)
![[Uncaptioned image]](/html/astro-ph/9506004/assets/x4.png)
In our samples many rotation curves are extended beyond the optical size, out to . At these radii the disc and bulge contributions have virtually reached the Keplerian regime, , and such fall-off must be apparent in the RC unless the stellar component is negligible. Let us introduce a mass-discrepancy indicator that tests the observed fractional variation in velocity, , with the variation that we would expect if the stars and the gas actually traced the mass. Consequently, the quantity indicates the level of mass discrepancy inside . The outer gradients are mostly estimated from HI data: in Sample A we found a subset of 27 RCs extended to about (see Table 1 in Appendix D). In addition, about 200 optical RCs of Sample B have measurements farther out than : these data, though relatively sparse, well supplement the HI data (see Appendix B). Then we can build the largest sample for which the haloes’ RCs can be traced directly from the observed RCs, in that the latter are extended out to radii where the disc contribution is certainly negligible. The gradient can easily be estimated from surface photometry and the HI density distribution: we find that this quantity is uncorrelated with galaxy luminosity or velocity amplitude (see Appendix A):
The mass-discrepancy indicator is then simply given by . Values of imply for a strong decoupling between mass and light.
With these indicators we now examine the presence of dark matter in spirals.
3.1 Dark Matter inside
First, we quantify in a simple way the trend between RC profiles and luminosity. In Fig.2 we plot versus luminosity (velocity) for the objects of sample A. An inverse proportionality between slope and luminosity (velocity) emerges very strongly: the probabilities of a random occurrence are . The constant of proportionality is (), the linear correlation coefficient is 0.83 (0.87), and the scatter is (). Remarkably, the co-added sample shows this very same trend but with an even higher level of statistical significance and less noise (see Fig 2). This suggests that part of the scatter around the above relationships arises from observational errors or kinematical disturbances, obviously suppressed by the the co-addition procedure: at a given luminosity (velocity amplitude), the intrinsic variance of is then , one order of magnitude smaller than the range of spanned by spirals. From the combined two samples we obtain, with probability of random occurrence ,
where the uncertainties on the coefficients are less than 8%. We remark that the inner slope turns out to be a tight and continuous relationship of luminosity, as found in PS91. In disagreement with the claim of Flores et al. (1993) (see Section 5), the RCs are very steep at low luminosities (velocity amplitudes), and become gradually flat — and eventually slightly decreasing — at higher luminosities (velocities).

Recalling that , relationship (4) has two straightforward implications: (a) in every galaxy the LM is unable to account for the observed kinematics out to ; and (b) this inability is marginal (though clearly detectable) at high luminosities, and becomes progressively more serious with decreasing luminosity.
We estimate the minimum mass, , of the dark component residing inside by assuming the maximum-disc hypothesis:
(for details see Persic & Salucci (1990c). Then, in the biggest (brightest) spirals the dark matter comprises at least of the total mass, while in the smallest (faintest) ones this fraction increases to .
3.2 Dark matter inside
In Fig.3 we plot versus luminosity and versus velocity for the very extended HI RCs of Sample A: a tight outer slope–luminosity (velocity) relationship emerges (the probability of a chance occurrence is less than ). Also shown in Fig.3 are the estimated s for the 5 synthetic extended RCs from Sample B (see Fig.15 in Appendix B): the trend is clearly consistent with that of individual RCs from Sample A. All these data are very well fitted by:
(with uncertainties of 20% in zero point and 10% in slope), which confirms and strengthens the results of Salucci & Frenk (1989) and Casertano & van Gorkom (1991) by means of the consistent evidence of about 100 RCs.

By recalling that , we can state that, at , the luminous matter is totally unable to account for the observed kinematics.
3.3 Implications
The main implications of the above results can be summarized as follows.
The fraction of DM increases with radius: in fact, if is the fraction of dark matter inside , at this fraction has increased to .
The maximum disc mass is , while the minimum disc mass is found to be .
The fraction of dark matter increases, at any normalized radius , with decreasing galaxy luminosity.
The dark component is much less concentrated than the visible one: in fact, since and , the dark-to-visible density ratio at is 15–30 times larger than the value at .
Thus the ensuing picture of a spiral galaxy consists of a stellar disc embedded in a dark component with a very different density profile. Spirals of high luminosity (M) have a small dark matter content inside – consequently, their RCs show the kinematical signature, , of the transition from an inner, LM-dominated region, to an outer, DM-dominated region (Salucci & Frenk 1989). Conversely, low-luminosity (M) objects are dominated nearly everywhere by the DM component, , so that the transition occurs well inside where has still an increasing or flattish profile not dissimilar to that of the DM, and therefore no feature marking the transition between the two regimes appears in .
4 The Universal Rotation Curve
The luminosity specifies the entire rotation field of spirals. From samples A and B we obtain, and plot in Fig.4 the synthetic rotation curve [and ] as a function of radius and of galaxy luminosity (velocity). These are constructed by combining the co-added rotation curves with the slope-velocity-luminosity relationships (6),(7). The rms errors of the 11 2 co-added RCs are typically inside , while beyond they increase by up to a factor of 2.

Crucially, has a very small cosmic variance. In fact, the percentage residuals between the individual RCs, (given in Table 2 of PS95), and the averaged RCs, , are generally within the estimated observational errors ( per cent). In Fig.5 we show the comulative distribution of : only about of points has a variance that cannot be simply accounted for by observational errors. However, also in these cases, the variance is rather small (), and furthermore may arise from a neglected dependence of RCs on Hubble Type, or from non-gaussian observational errors, rather than indicating actual violations of the Universal Rotation Curve paradigm. Thus, as in PS91, we here claim the existence of a Universal Rotation Curve, (given in numerical form by ’Table URC’ 444In /pub/psrot at 147.122.2.158 via anonymous FTP. and shown in Fig.4). (Sa-type galaxies will be investigated in a separate paper.)

We now look for an analytical form for , that we define as . First, we stress that a very simple function, i.e. two straight lines smoothly joining at with luminosity-dependent slopes, describes well the typical profile of RCs (see PS91): the inaccuracies are (see Persic, Salucci & Stel 1996). Here we proceed a step further by fitting with a function that is still simple, but is nevertheless able to: (a) describe the innermost parts of the RCs; and (b) pinpoint the separate contributions of the dark and luminous components. In detail:
(i) The contribution from the stellar disc can be written, for , as (see Appendix C):
where and . For an exponential thin disc, ;
(ii) The contribution from a dark halo can be well represented by:
with being the ’velocity core radius’ (measured in units of ). We normalize by setting . Therefore, 555In spherical symmetry. Otherwise, represents the effective mass..
Then we fit with the universal rotation curve given by:
We find that, with
the universal rotation curve reproduces the observed rotation curves to well within their rms errors (see Fig.6).

The introduction of a bulge component should further improve the agreement between data and fit, by reducing the small discrepancies between eq.(10) and the data for very small radii in some synthetic RCs of high luminosity (see Fig.6). In Fig.6 the RCs, , are gauged to the reference frame of the luminous matter: the differential effect of the presence of DM emerges clearly as an increasing failure of the LM to account for the observed rotation curves as luminosity decreases.
We now set the RCs in the reference frame of the dark matter, whose distribution can be characterized by , i.e. the radius encompassing a mean halo overdensity of . To smooth the density field we use a top-hat filter: , with the halo mass . (In this formalism the ’central halo density’ is given by lim and does not depend on the local density, .) Recalling that the mean mass density of the Universe is 666No result of this paper is changed for ., then is obtained by solving
with for , and for . The quantity , appearing in (12), can be obtained either directly from (9) and (11) or by using the relation
(see Persic & Salucci 1990b): the two estimates are in very good mutual agreement. [In any case, let us remark that , with .] In Fig.7 we plot : we realize that, when scaled to the DM reference frame, the halo contribution to the RCs are essentially self-similar. Only one parameter (e.g., the total mass) specifies completely the halo properties (e.g., the velocity amplitude) far from the region where the LM has collapsed.

This evidence (cf. Fig.4) disproves the concept of ’featureless flat RC’ and the resulting prejudice of a ’cosmic cospiracy’, according to which some physical process would have fine-tuned the structural parameters of the dark and visible matter, forcing every RC to be flat and featureless (e.g., Bahcall & Casertano 1985). Given the favour often granted to such views (but see Salucci & Frenk 1989 and Casertano & van Gorkom 1991), we want to stress that the large variety of RC shapes and the presence of clear features in some of them imply that the physical quantities underlying the structure of spirals (e.g., the dark-to-total mass ratio) take a wide range of values, though they are inter-related.
We conclude this section by arguing that, since the stellar mass-to-light ratio in spirals spans a range which is limited compared with the range in luminosity, any empirical dependence on luminosity may actually reflect a more physical dependence on the amount of luminous matter .
5 Discussion
Where is DM? It is generally believed that the dark matter dominates the outer regions of spirals, while the LM dominates in the innermost ones. This is only partially true: in low-luminosity galaxies the transition between the two regimes occurs well inside the optical radius. Let us define the transition radius as the innermost radius at which the LM fails to account for the observed RC by more than 4 times the typical observational error, i.e.: . Notice that for , . So is the innermost radius at which we unambiguously detect the presence of dark matter. We also compute the fraction of the total luminous mass inside : for an exponential thin disc, with . In Fig.8 we plot and as a function of luminosity. We find that in spirals of low luminosity the mass discrepancy begins before the disc half-mass radius , so that the DM phenomenon is present also in the region where most of the ordinary matter resides. Conversely, at high luminosities, the phenomenon is evident only where the luminous matter is almost absent.


The Nature of DM. We are able to investigate, with a sufficiently large sample, the properties of DM in the region where it dominates. In Fig.9 we show the local mass-to-light ratio for galaxies of different luminosities. For our purposes we can assume while the luminosity distribution is obtained from the surface brightness profiles. The local in the B-band easily reaches the value of 100, implying that the DM cannot be made of low-mass hydrogen-burning stars. Obviously, this argument does not rule out other dark baryonic candidates such as black-holes and jupiters, but obliges them to (i) be distributed very differently from the luminous baryonic matter, and (ii) coexist with the luminous matter at about .

The Final State of the Baryonic Infall. Flores et al. (1993) have proposed a model for the infall of pre-galactic gas into DM halos which does not predict, for km s-1, any relationship between the luminosity and the RC slope, but rather predicts a random variation around the value of . Flores et al. wondered whether the trend between and luminosity found by PS91 may arise as a spurious effect of the small size of the sample used, of the limited extent of some RCs and of the assumption of an exponential thin disc taken to derive . The selection criteria adopted to construct the present samples bypass the above-claimed problems: in particular, our data sample is larger by a factor 15 than that in PS91, and is derived from the actual surface photometry. Notwithstanding this (or, rather, just as a result of this), the slope–luminosity (velocity) relationship stands out more tightly than in PS91. We have carefully investigated the crucial region km s, which is very well sampled here: both the individual curves and the synthetic curves show a very steep slope (), in agreement with the global trend. The latter is very strong, and emerges clearly also in samples (as in PS91) with many fewer () objects and lower observational accuracy (i.e., ). Thus, the observed RC profiles, unlike the Flores et al. (1993) predictions, are generally very steep, and show a marked correlation with luminosity. Navarro et al. (1996) show how an infall model à la Flores et al. may naturally reproduce the RC systematics highlighted in this (and previous) paper(s).
6 Conclusion
In this paper we have investigated the main properties of the mass structure of spirals. To do this, we have used a very large number () of galaxy RCs, to construct: (a) a sample of 131 high-quality extended RCs; and (b) a sample comprising 616 medium-quality RCs that, co-added in 11 ( 2) synthetic curves, have thouroughly covered the whole luminosity (velocity amplitude) sequence of spirals. Our analysis extends out to 2 optical radii and spans approximately 6 mag.
Both samples show that spiral RCs follow a common pattern: their amplitudes and profiles do not vary freely among galaxies, but depend on luminosity. At low luminosities the RCs are steep for , and grow monotonically to a probably asymptotic value at outer radii. At high luminosities the RCs are flat (and even decreasing) for , and gently fall, from outwards, to reach a probably asymptotically constant value farther out. They are very well represented by:
with ). The Universal Rotation Curve in eq.(14) (see Fig.10) describes any rotation curve at any radius with a very small cosmic variance. In fact eq.(14) predicts rotation velocities at any (normalized) radius with a typical accuracy of .

On the other hand, by slicing the URC to match individual observed RCs we can derive galaxy luminosities and therefore measure cosmic distances with a typical uncertainty of magnitudes. The benefits of using the URC as a distance indicator are discussed by Hendry et al. (1996).
A particular feature of the Universal Rotation Curve is the strong correlation between the shape and the luminosity (velocity) established in previous papers and confirmed here over a factor 150 in luminosity (factor of 5 in velocity) and over the variety of the RC profiles. This relationship sweeps a narrow locus in the profile/amplitude/luminosity space, implying that the great majority of spirals belong to the same kinematical family. At high luminosity, the profiles of RCs are only mildly discrepant from the pure LM predictions, at least within , so the DM content, although detectable, is modest. At low luminosities, on the other hand, the discrepancy between LM predictions and RC profiles is very large: the DM is the only relevant mass component. The mass structure in spirals is self-similar, but the dark and luminous components are coupled with a luminosity-dependent strength. This picture is quantified, by means of the results of Sections 3 and 4, by the following relationships (see Salucci et al., in preparation):
(where is the cosmological density parameter of Big Bang synthesized baryons).
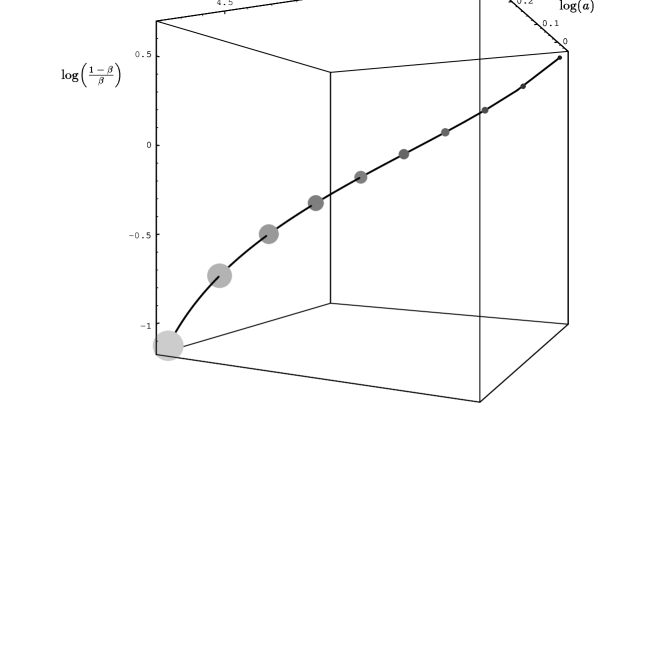
A curve in the (luminosity)–(dark-to-luminous mass ratio)–(DM core radius)–(central DM density) 4-D space (see Fig.11) is the geometrical analogue of these structural relationships. This curve, which is the counterpart, for spirals, of the Fundamental Plane for ellipticals, shows that the distribution of DM is completely different from that of the luminous matter and strongly varies with luminosity, and that, especially at low luminosity, the presence of DM is already detected well inside the optical regions. The implications are as follows:
the Universe becomes darker at smaller scales;
smaller discs have lower densities and mass-to-light ratios;
smaller discs have lost a larger fraction of their original baryon content;
smaller haloes have higher central densities;
the formation of spirals is controlled by just one quantity, e.g. the total mass (or, alternatively, the initial DM overdensity).
Acknowledgements. We thank John Miller for carefully reading the manuscript, and the referee for insightful comments that have improved the presentation of this work. We also thank Joel Primack for contributing, through several stimulating comments on PS91, to our motivation to construct the 967 rotation curve sample (PS95) and to undertake this analysis.
References
Aaronson, M. et al. 1982, ApJS, 50, 241
Amram, P., Le Coarer, E., Marcelin, M., Balkowski, C., Sullivan, W.T., III, & Cayatte, V. 1992, A&AS, 94, 175
Amram, P., Marcelin, M., Balkowski, C., Cayatte, V., Sullivan, W.T., III, & Le Coarer, E., 1994, A&AS, 103, 5
Ashman, K.M. 1992, PASP, 104, 1109
Bahcall, J.N., & Casertano, S. 1985, ApJ, 293, L7
Begeman, K. 1987, Ph.D. thesis, Groningen University
Biviano, A., Girardi, M., Giuricin, G., Mardirossian, F., & Mezzetti, M. 1991, ApJ, 376, 458
Blackman, C.P., & van Moorsel, G.A. 1984, MNRAS, 208, 91
Boroson, T. 1981, ApJS, 46, 177
Bosma, A. 1981a, AJ, 86, 1791
Bosma, A. 1981b, AJ, 86, 1825
Bottema, R. 1989, A&A, 221, 236
Bottema, R., Shostak, G.S., & van der Kruit, P.C. 1987, Nature, 328, 401
Broeils, A.H. 1992a, A&A, 256, 19
Broeils, A.H. 1992b, Ph.D. thesis, Groningen University
Broeils, A.H., & Knapen, J.H. 1991, A&AS, 91, 469
Burstein, D., & Heiles, C. 1984, ApJS, 54, 33
Burstein, D., & Rubin, V.C. 1985, ApJ, 297, 423
Carignan, C. & Puche, D. 1990a, AJ, 100, 394
Carignan, C. & Puche, D. 1990b, AJ, 100, 641
Carignan, C., Sancisi, R., & van Albada, T.S. 1988, AJ, 95, 37
Casertano, S., & van Gorkom, J.H. 1991, AJ, 101, 1231
Côté, S., Carignan, C., & Sancisi, R. 1991, AJ, 102, 904
de Vaucouleurs, G., de Vaucouleurs, A., Corwin, H.G., Jr., Buta, R.J., Paturel, G., & Fouqué, P. 1991, The Third Reference Catalog of Bright Galaxies (Austin: Univ. of Texas Press) (RC3)
Elmegreen, B.G., & Elmegreen D.M. 1985, ApJ, 288, 438
Elmegreen, D.M., & Elmegreen B.G. 1990, ApJ, 364, 412
Evrard, A.E., Summers, F.J., & Davis, M. 1994, ApJ, 422, 11
Faber, S.M., & Gallagher, J.S. 1979, Ann. Rev. Astr. Astrophys., 17, 135
Flores, R., Primack, J.R., Blumenthal, G.R., & Faber, S.M. 1993, ApJ, 412, 443
Freeman, K.C. 1970, ApJ, 160, 811
Gottesman, S.T. 1980, AJ, 85, 824
Gottesman, S.T., Ball, R., Hunter, J.H., & Huntley, J.M. 1984, ApJ, 286, 471
Hendry, M., Rauzy, S., Salucci, P., & Persic, P. 1996, in Giuricin, G., Mardirossian, F., Mezzetti, M., eds., From Galaxies to Galaxy Systems. Ap.Lett.&Comm., Gordon & Breach, New York
Hodge, P.W. 1978, ApJS, 37, 429
Jobin, M., & Carignan, C. 1990, AJ, 100, 648
Kamphuis, J., & Briggs, F. 1992, A&A, 253, 335
Kent, S.M. 1985, ApJS, 59, 115
Kent, S.M. 1986, AJ, 91, 1301
Kent, S.M. 1987, AJ, 93, 816
Kent, S.M. 1989, PASP, 101, 489
Lake, G., & Feinswog, L., 1989, AJ, 98, 166
Marcelin, M., Boulesteix, J., & Courtès, G. 1982, A&A, 108, 134
Mathewson, D.S., Ford, V.L., & Buchhorn, M. 1992, ApJS, 81, 413
Moore, B. 1994, Nature, 370, 629
Navarro, J.F., & White, S.D.M. 1994, MNRAS, 267, 401
Navarro, J.F., Frenk, C.S., & White, S.D.M. 1996, ApJ, 462, 563
Newton, K. 1980, MNRAS, 190, 689
Ondrechen, M.P., & van der Hulst, J.M. 1989, ApJ, 342, 29
Ondrechen, M.P., van der Hulst, J.M., & Hummel, E. 1989, ApJ, 342, 39
Persic, M., & Salucci, P. 1988, MNRAS, 234, 131
Persic, M., & Salucci, P. 1990a, ApJ, 355, 44
Persic, M., & Salucci, P. 1990b, MNRAS, 245, 577
Persic, M., & Salucci, P. 1990c, MNRAS, 247, 349
Persic, M., & Salucci, P. 1991, ApJ, 368, 60 (PS91)
Persic, M., & Salucci, P. 1992, MNRAS, 258, 14P
Persic, M., & Salucci, P. 1995, ApJS, 99, 501 (PS95
Persic, M., Salucci, P., & Ashman, K.M. 1993, A&A, 279, 343
Persic, M., Salucci, P., & Stel, F. 1996, Ap.Lett.&Comm., 33, 205
Puche, D., Carignan, C., & Bosma, A. 1990, AJ, 100, 1468
Puche, D., Carignan, C., & van Gorkom, J.H. 1991, AJ, 101, 456
Puche, D., Carignan, C., & Wainscoat, R.J. 1991, AJ, 101, 447
Regan, M.W., & Vogel, S.N. 1994, ApJ, 434, 536
Rogstad, D.H., Wright, M.C.H. & Lockhart, I.A. 1976, ApJ, 204, 703
Rubin, V.C., Ford, W.K., Jr., & Thonnard, N. 1980, ApJ, 238, 471
Rubin, V.C., Ford, W.K., Jr., Thonnard, N. & Burstein, D., 1982, ApJ, 261, 439
Rubin, V.C., Burstein, D., Ford, W.K., Jr., & Thonnard, N. 1985, ApJ, 289, 81
Rubin, V.C., Whitmore, B.C., & Ford, W.K., Jr. 1988, ApJ, 333, 522
Salucci, P., & Frenk, C.S. 1989, MNRAS, 237, 247
Sancisi, R., & Allen, R.J. 1979, A&A, 74, 73
Sancisi, R., & van Albada, T.S. 1987, in Dark Matter in the Universe (IAU Symposium No. 117, ed. J. Kormendy & G.R. Knapp; Dordrecht: Reidel), p. 67
Schombert, J.M., & Bothun, G.D. 1987, AJ, 93, 60
Schommer, R.A., Bothun, G.D., Williams, T.B., & Mould, J.R. 1993, AJ, 105, 97
Shaw, M.A., & Gilmore, G. 1989, MNRAS, 237, 903
Shostak, G.S. 1973, A&A, 24, 411
Shostak, G.S., & van der Kruit, P.C. 1984, A&A, 132, 20
Tully, R.B. 1988, Nearby Galaxies Catalog (Cambridge: Cambridge University Press)
van Albada, G.D. 1980, A&A, 90, 123
van der Kruit, P.C., & Searle, L. 1981a, A&A, 95, 105
van der Kruit, P.C., & Searle, L. 1981b, A&A, 95, 116
van der Kruit, P.C., & Searle, L. 1982, A&A, 110, 61
van Moorsel, G.A. 1982, A&A, 107, 66
van Moorsel, G.A. 1983a, A&AS, 53, 271
van Moorsel, G.A. 1983b, A&AS, 54, 19
Wevers, B.M.H.R., van der Kruit, P.C., & Allen, R.J. 1986, A&AS, 66, 505
Whitmore, B.C. 1984, ApJ, 278, 71
Whitmore, B.C., Forbes, D., & Rubin, V.C. 1988, ApJ, 333, 542
APPENDIX A
In this Appendix we study the connection between the velocity gradients and and the distribution of DM. We start from the condition of centrifugal equilibrium:
where is the quadratic sum of the three luminous components, i.e. gas, disc, and bulge. The gas contribution is obtained from the HI surface density, and the functional form of the stellar contribution is determined by the surface brightness profile (the effect of the bulge is studied in Persic, Salucci & Ashman 1993).

Let us define
and
and define and similarly for the halo component. Finally, let us define the LM fraction inside the optical radius as:
The RC-profile equation [cf. eq.(4) in Persic & Salucci 1990b] is:
while from the definition of we have:
We investigate whether the light profile of spirals depends on luminosity by co-adding the surface brightnesses of the 616 galaxies of Sample B to form synthetic light profiles, arranged by luminosity (velocity) bins (see Fig.12).
We stress that the actual light distributions do not depend on luminosity (velocity), which implies that the velocity profile of the stellar component,
does not depend on luminosity. In particular, at the light has already converged: this implies that the bulge and the disc are already very close to a Keplerian regime, and , in any object.


We can estimate from published data taking into account that
(where the subscripts d,b,g denote the disc, bulge and gas components, respectively), and
In Fig.13 we plot as a function of luminosity: we find
with the residuals uncorrelated with luminosity (but weakly correlated with Hubble type). This result can be easily understood. In fact, (i) most of the light profiles are true exponentials for which such a result holds automatically, (ii) the discrepancies of the surface brightness profiles with respect to an exponential are independent of luminosity, (iii) neglecting the bulge affects the determination of very little (see Appendix of Persic et al. 1993), and (iv) the gas content is relatively small, and its effect on is opposite to those considered in points (ii) and (iii).
The external gradient can be estimated taking into account that
In Fig.13 we also plot as a function of luminosity: we find that there is very little dependence of this quantity on luminosity, so that we can assume:
Since and depend on luminosity while and do not, then at least two of the halo quantities , , will also depend on luminosity; on the other hand, a luminosity dependence of the latter quantities will generally be propagated into the RC profiles.
APPENDIX B
In this Appendix we show:
a) the rotation curves of Sample B co-added in velocity bins (Fig.14);

b) the rotation curves of Sample B suitably co-added in order to probe the kinematics of the outermost regions (Fig.15).


APPENDIX C
The self-gravity of an infinitely thin disc with surface mass density distribution yields an equilibrium circular velocity given by:
where and and are the modified Bessel functions computed at . For mathematical simplicity, in the range we approximate the r.h.s of eq.(C1) with the much simpler function
Notice in Fig.16 that our approximation agrees with the exact function to 0.4% over the quoted radial range. For the Keplerian regime is practically attained, and hence:
APPENDIX D
In this appendix we present the relevant quantities of Sample A (Table 1) along with the surface-photometry and rotational-velocity references (Table 2).
![[Uncaptioned image]](/html/astro-ph/9506004/assets/x22.png)
![[Uncaptioned image]](/html/astro-ph/9506004/assets/x23.png)
![[Uncaptioned image]](/html/astro-ph/9506004/assets/x24.png)
![[Uncaptioned image]](/html/astro-ph/9506004/assets/x25.png)
![[Uncaptioned image]](/html/astro-ph/9506004/assets/x26.png)
![[Uncaptioned image]](/html/astro-ph/9506004/assets/x27.png)