A search for HI 21cm absorption toward the highest redshift () radio loud objects
Abstract
We have searched for HI 21cm absorption toward the two brightest radio AGN at high redshift, J0924–2201 at , and J0913+5919 at , using the Giant Meter Wave Radio Telescope (GMRT). These data set a 3 upper limit to absorption of at 40 km s-1 resolution for the 30 mJy source J0913+5919, and for the 0.55 Jy source J0924–2201 at 20 km s-1 resolution. For J0924–2201, limits to broader lines at the few percent level are set by residual spectral baseline structure. For J0924–2201 the column density limit per 20 km s -1 channel is: N(HI) cm-2 over a velocity range of km s-1 to km s-1 centered on the galaxy redshift determined through CO emission, assuming a covering factor of one. For J0913+5919 the column density limit per 40 km s-1 channel is: N(HI) cm-2 within km s-1 of the optical redshift. These data rule out any cool, high column density HI clouds within roughly km s-1 of the galaxies, as are often seen in Compact Steep Spectrum radio AGN, or clouds that might correspond to residual gas left over from cosmic reionization.
1 Introduction
Observations of HI 21cm absorption at cosmologically significant redshifts provide important probes into a number of physically interesting problems (Kanekar & Briggs 2004). First, associated systems probe the immediate environment of the AGN and the ISM in the host galaxy. In particular, searches for HI 21cm absorption toward Compact Symmetric Radio sources (CSOs) show that in the overwhelming majority of sources () absorption is detected at optical depth levels between 4 and 40, with line widths ranging from about 50 to 500 km s-1 (Peck et al. 2000). CSO’s are thought to be young radio jet sources ( yrs), possibly confined by a dense ISM in the host galaxy (Conway 2002). The high HI 21cm detection rate is thought to be due to the fact that the radio emission is confined to the inner regions of the galaxy (scales kpc), and hence HI 21cm absorption searches probe the dense gaseous environs in the centers of the host galaxies.
Second, studies of intervening HI 21cm absorption systems, in concert with observations of damped Ly absorption, have been used to constrain the evolution of the excitation, or spin temperature of the neutral gas. Results suggest an increasing fraction of warm neutral gas with increasing redshift for damped Ly systems (Kanekar & Chengalur 2003; Carilli et al. 1996). This increase might be due to a change in the nature of the parent galaxy of the absorption line system from large spirals at low , to smaller dwarf and irregular galaxies at higher (Kanekar & Chengalur 2003), or it could be a cosmological geometry effect, relating to the very slowly changing value of the angular diameter distance for redshifts greater than unity or so (Curran & Webb 2006).
And third are the recent observational constraints on the epoch of reionization (EoR), suggesting cosmic reionization started around , with the last neutral structures being etched away around (Fan, Carilli, & Keating 2006). It has been pointed out that the existence of radio loud AGN within the near edge of cosmic reionization could be used as sensitive probes of intermediate to small scale structures in the neutral IGM, through HI 21cm absorption observations (Carilli, Gnedin, & Owen 2002; Furlanetto & Loeb 2002), as opposed to the very large scale that can be studied in emission.
In this paper we present a search for HI 21cm absorption toward two radio sources. While not quite extending into the EoR, these sources are the highest redshift bright radio AGN known, and the redshifts are close enough to the end of reionization (within 200 Myr), that we can explore the possibility of enhanced residual cool neutral gas content in the vicinity of the host galaxy due to not-fully complete reionization of the densest regions of the universe (Gnedin 2000; Paschos & Norman 2005).
2 The sources
The source TN J0924–2201 is a radio galaxy with an optical redshift of (van Breugel et al. 1999). The source was selected from low frequency radio surveys as an ’ultra steep spectrum’ source, with a flux density at 1.4 GHz of 73 mJy and a spectral index between 0.37 and 1.4 GHz of –1.63. Near IR imaging has revealed a faint, clumpy source, while radio imaging shows a compact double with a separation (= 7 kpc), making this source a CSO. The Ly emission from this galaxy is clearly weaker than is normal for powerful radio galaxies. van Breugel et al. (1999) suggest that the likely cause for the abnormally weak Ly line is associated Ly absorption, thereby indicating the presence of neutral HI on kpc-scales in the host galaxy. The complex near-IR structure, and the associated Ly absorption, make this source a prime candidate for a forming giant elliptical galaxy within a cosmically over-dense region (Pentericci et al. 2002). Venemans et al. (2004) estimate a star formation rate in the host galaxy of yr-1, based on the extended (rest-frame) UV continuum flux as well as on the Ly line flux. However, this star formation rate has not been corrected for reddening, which may be substantial. Most recently, Klamer et al. (2005) have detected CO emission from this galaxy, indicating a large reservoir of molecular gas ( M⊙), and providing a very accurate host galaxy redshift of .
The source SDSS J0913+5919 is a luminous quasar at (Anderson et al. 2002). Radio imaging at 1.4 GHz and 5 GHz reveals a radio source with a flux density of 18 mJy at 1.4 GHz and a spectral index of -0.7 (Petric et al. 2003). The radio source is compact, but possibly marginally resolved at resolution, suggesting this source is a CSO. The optical spectrum of the source shows a relatively narrow Ly emission line for a quasar, again likely due to strong associated absorption, and again indicating the presence of neutral HI in the host galaxy (Anderson et al. 2001). The optical luminosity of the QSO implies an Eddington limited mass to the black hole M⊙, which would imply a massive host galaxy ( M⊙), based on the black hole mass – bulge velocity dispersion relation (Gebhardt et al. 2000).
3 Observations
Observations were made in the 230 MHz band of the GMRT. Absolute flux density calibration was done using 3C48 and 3C286. The source J0834+555 was observed for phase calibration for J0913+555, and J0837-198 was used for phase calibration for J0924–2201. All data were acquired using the full array of 30 antennas (projected baselines up to 18 k), giving a synthesized beam FWHM. The standard line correlator set-up was employed, using 128 spectral channels.
J0913+5919 has an optical redshift of , which puts the HI 21cm line at a frequency of MHz. For this source we observed two polarizations of 4 MHz bandwidth each, centred on the expected frequency of the redshifted 21cm line. The 128 spectral channels then yields a spectral resolution of 31.25 kHz, or 40.6 km s-1. 3C286 was used for bandpass calibration.
For J0924–2201 the host galaxy redshift is , placing the 21cm line at a frequency of MHz. An initial short (2 hour) test observation of this source was made in September, 2003, to investigate the radio frequency interference (RFI) environment in the 229 MHz band of the GMRT. Although there was strong interference over much of the 4 MHz band, by careful flagging we were able to generate a spectrum of the spectral region immediately defined by the CO redshift, and interestingly, a potential (3 over a few 40 km s-1 channels) absorption line was seen.
We reobserved this source in February 2004, with a longer integration time (three observations of 7 hours each), and a narrower bandwidth (2MHz) to verify this line. Unfortunately, the interference environment for this second observation was much worse than during the test observations, with only 1 or 2 late-night/early morning hours per observation being useful. Moreover, the observations of the bandpass calibrators 3C48 and 3C286 were completely wiped-out, and the phase calibrator 0837–198 had to be used for bandpass and gain calibration, assuming the flux density derived from the test observations. These latter (admittedly marginalized) data did not verify the line seen in the test data.
Given the problems with the second data set, we observed J0924–2201 a third time in November 2005, separating the observations over three nights, but observing only during the two hours per night corresponding to the lowest RFI levels, and limiting the velocity range to just the 1MHz band centered on the CO line redshift in order to avoid strong RFI at the edge of the wider band.
All data processing was performed using the wide-field imaging and self-calibration capabilities in AIPS.
4 Data analysis
For the February 2004 observations of J0924–2201, all baselines shorter than 2 k ( of all baselines) were completely corrupted by wideband RFI, and were therefore flagged. Also, all data were flagged except for roughly two hours in the middle of each the night. For the November 2005 observations all baselines shorter than 1 k were flagged. Flagging of residual channel-by-channel interference removed of the channels of the remaining data.
For both sources wide field images were then generated using standard wide-field imaging routines in AIPS, and the data were self-calibrated using the resulting models. For the first (phase only) self calibration iteration a model based on the NRAO VLA Sky Survey was used (Condon et al. 1998).
A general issue in low frequency spectral line imaging is side-lobe confusion from bright sources in the primary beam. In our case this is especially a problem for J0913+5919, where side lobe confusion is caused by two relatively bright sources ( Jy and Jy) well within the primary beam. In order to overcome this difficulty, proper modeling and subtraction of continuum sources is required. We used a combination of bright source model subtraction from the spectral line data using the AIPS task ’UVSUB’, plus spectral baseline fitting in the uv-plane (’UVLIN’) and in the image-plane (’IMLIN’).
For the February 2004 observations of J0924–2201, the bandpass calibration using only the phase calibrator resulted in significant residual structure across the band. This was removed using a second order polynomial fit in IMLIN, leaving a residual bandpass ripple across the spectrum. For November 2005 we found that bandpass calibration using 3C286 was adequate to allow for a simple linear bandpass fit in the image-plane using IMLIN.
In the case of J0913+5919, RFI on short baselines was limited to specific channels, the data could therefore be edited quite efficiently using the AIPS tasks ’SPFLG’, ’UVFLG’ and ’FLGIT’, ultimately resulting in the removal of about 35 of all data. A linear baseline was adequate for residual continuum subtraction with IMLIN.
5 Results
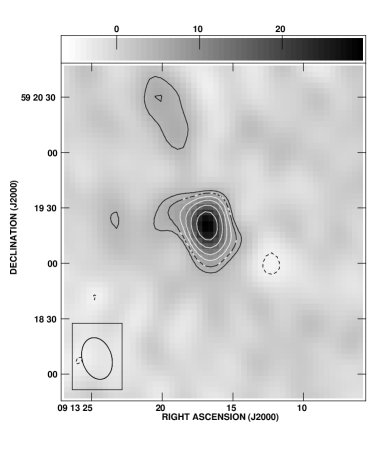
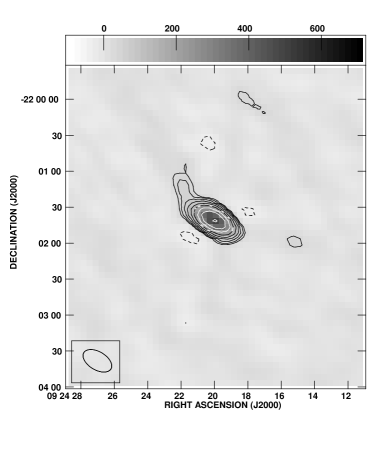
Figure 1 shows the continuum image of each source. Both sources are unresolved at the resolution of the GMRT (). J0913+5919 was found to have a flux density of mJy at 230MHz, while J0924–2201 had a flux density at of Jy. In both cases the errors represent observation-to-observation differences, likely due to residual errors in the flux density boot-strap process.
The continuum subtracted spectrum of J0913+5919 is shown in Figure 2a. The rms noise is 3 mJy per 40.7 km s-1 channel. At this resolution, we find no absorption to a 3 optical depth limit of 0.3, over a velocity range of km s-1 centered on the optical redshift of .
There is a broad depression in the J0913+5919 spectrum, covering much of the velocity range dictated by the optical redshift plus uncertainty. We have smoothed the spectrum to 164 km s-1, and the result is shown in Figure 2b. The rms per channel is 2 mJy, and the depression can be seen centered at about 232.3 MHz, or , with a width of about 9 channels, or 1500 km s-1. The mean depth of the depression is about 2 mJy, or just 1 sigma per channel, although this persists over 9 channels. Note that we have used all of the channels shown for linear spectral baseline subtraction. If we exclude the 9 ’line’ channels from the spectral baseline fit, the mean depression depth increases to almost 3mJy. We do not consider this a line detection, but a potential result that requires further observation.
Figure 3 shows the results for J0924–2201. Figure 3a shows the wide-band spectrum from February 2004, for which a second order spectral baseline has been removed using all of the channels shown. We do not detect any absorption over the full band to an rms level of 11 mJy per 20 km s-1 channel, corresponding to a 3 optical depth limit of 6%. The frequency range covered corresponds to km s-1 to km s-1, centered on the CO redshift for the host galaxy. Figure 3b shows the spectrum from November 2005 at 20 km s-1 resolution. Again, no absorption is detected to an rms level of 6 mJy per 20 km s-1 channel, corresponding to a 3 optical depth limit of 3.3%. The frequency range covered corresponds to km s-1. We have combined the two spectra, weighting by the rms, and the result is show in Figure 3c. The rms per 20 km s-1 channel is now 5 mJy, implying a 3 optical depth limit of 2.7%. Residual spectral baseline structure limits any broad ( km s-1) lines to .
6 Discussion
These GMRT observations set upper limits to the HI optical depth toward J0924–2201 of 3% at 20 km s-1 resolution within 460 km s-1 of the host galaxy redshift, and 6% over a wider velocity range of km s-1 to km s-1. The column density limit per channel is then: N(HI) cm-2 over the narrow range, and cm-2 over the broader range, where is the HI spin temperature. Residual broad spectral baseline structure limits any broad absorption line to . The column density limit is then cm-2 for a 500 km s-1 line.
For the weaker radio source, J0913+5919, the optical depth limit is 0.3 at 40 km s-1 resolution, within km s-1 of the optical redshift. The column density limit per channel is then: N(HI) cm-2. There is a broad, weak depression in the center of the spectrum of about 1500 km s-1 width with a depth of about 7%, although this signal is really only 1 in 9 channels, or roughly 3 averaged over all of the ’line’ channels. If real, the implied column density is: N(HI) cm-2. We consider this an upper limit to a broad line in this source, although further observations of this source would be very interesting.
We note that both sources in our study show evidence for an extended radio continuum source of in size ( kpc; see section 2). Low HI covering factors of the continuum sources could also lead to low apparent optical depths.
For J0924–2201, assuming that the very weak Ly emission line from the host galaxy is due to high column density (damped) associated Ly absorption line system (N(HI)cm-2), and using the HI 21cm limits above, suggests that the HI spin temperature is relatively high (few hundred K). For comparison, Galactic clouds with N(HI) cm-2 typically have spin temperature values K for the absorbing gas (Dwarakanath, Carilli & Goss 2001). For damped Ly systems at typical values for on the order of K are found (Carilli et al., 1996; Kanekar & Chengalur 2003).
These are (by far) the two brightest radio sources known at . The redshifts of these two sources place them within 200 Myr of the end of reionization (), as determined from eg. the Gunn-Peterson effect toward high z QSOs (Fan et al. 2006). Further, these luminous AGN are likely associated with denser regions of the universe, ie. proto-clusters, at the earliest epochs (Venemans et al. 2004). Given that reionization is likely a process extended in space and time (Fan, Carilli, Keating 2006), two possibilities exist for the large scale environments of the systems. There may be a significant residual population of dense HI clouds associated with the denser regions of the universe (Gnedin 2000; Paschos & Norman 2005). In this case, one might expect to see 21 cm absorption not just by gas in the inner kpc’s of the radio source host galaxy, but perhaps by the densest residual HI clouds surrounding the host galaxy on scales of tens to hundreds of kpc, left over from the EoR and still being ionized by the increasing uv background radiation field. Conversely, these densest regions may ionize earliest, due to the biased formation of luminous structure, and the associated higher ionizing radiation field (Wyithe & Loeb 2006).
Our observations have not detected any absorption by neutral systems in the IGM surrounding the quasars, implying that there are no residual neutral hydrogen clouds along their lines of sight. Indeed, we can certainly rule-out any large (kpc-scale), high column density, cool HI clouds within 1000 to 2000 km s-1 along the lines of site to either of these these sources. This lack of absorption is qualitatively consistent with expectations based both on optical observations of high redshift () quasars, and on theoretical expectations from models of the reionization process. As seen in the SDSS quasars at (White et al. 2003), there should be a proximity zone extending to 3000 km s-1 blueward of the quasar redshift, within which the IGM is sufficiently ionized that Ly-alpha photons are transmitted.
On the theoretical side, we would expect the ionizing background (following reionization) to be much larger than average within 1 MHz of the quasar redshift. For example, the enhancement of the ionizing backgound as a function of radius from a massive halo has been computed by Dijkstra, Lidz, & Wyithe (2006). When applied to a quasar, they find that the typical enhancement predicted by this model at a distance of 1Mpc ranges between factors of 10 and 100, depending on the quasar host mass. Much of this enhancement is due to clustering of sources around the quasar, which preferentially form in the overdense infall region (Wyithe & Loeb 2005). This large enhancement in the ionizing background radiation would suppress any absorption signature close to the quasar.
Recent models describe the process of reionization as patchy, meaning in part that overlap is completed at different times in different regions of the IGM. However the time of reionization within a region of IGM is not expected to be random. Rather, galaxy bias will ensure that overdense regions are reionized earlier than the average IGM (e.g. Wyithe & Loeb 2006). Rare objects, such as the massive halos that house quasars at , formed preferentially in overdense regions. It follows that the distribution of overdensities on 1Mpc scales surrounding these quasars is significantly skewed towards positive values (Wyithe & Loeb 2006). We therefore expect reionization to occur earlier around such objects. As an example, using the model described in Wyithe & Loeb (2006), we can calculate the time at which the IGM within 1Mpc of a quasar is reionized relative to the average IGM. Even in a case where the quasar flux is ignored, such a region would only be reionized at a time later than the average IGM in 5and current models of reionization, suggest that the immediate infall regions around bright quasars ( a few Mpc) are not the best sites to search for residual cool neutral gas clouds near the end of cosmic reionization. Future searches for such primordial HI clouds toward radio sources are best done at redshifts a few thousand km s-1 below the AGN host galaxy redshift.
Currently, the GMRT is the largest area telescope capable of observing the HI 21cm line into cosmic reionization, ie. at frequencies close to, or below, about 200 MHz. The interference environment clearly makes such studies difficult, and any further progress in very high redshift HI 21cm absorption searches using existing instrumentation will require discovery of bright (mJy) radio sources at redshifts that happen to put the HI line in the ever decreasing RFI-free parts of the low frequency spectrum. However, within a few years telescopes such as the Mileura Widefield Array, the Low Frequency Array, the Precision Array for Probing the Epoch of Reionization, and the 21 Centimeter Array, some of which will operate at sites chosen to minimize terrestrial interference, should allow for the study of fainter sources (few mJy), over wider frequency ranges (Carilli 2006).
References
- (1) Anderson, S., Fan, X., Richards, G., Schneider, D., Strauss, M. et al. 2001, AJ, 122, 503
- (2) Carilli, C., Lane, W., de Bruyn, A.G., Braun, R., & Miley, G. 1996, AJ, 111, 1830
- (3) Carilli, C., Gnedin, N., & Owen F. 2002, ApJ, 577, 22
- (4) Carilli, C.L. 2006, New Astr. Rev. 50, 162
- (5) Condon, J. J., Cotton, W. D., Greisen, E. W., Yin, Q. F., Perley, R. A., Taylor, G. B., & Broderick, J. J. 1998, AJ, 115, 1693
- (6) Conway, J. 2002, NewAR, 46, 263C
- (7) Curran, S.J. & Webb, J.K. 2006, MNRAS, 371,356
- (8) Dijkstra, M., Lidz, & Wyithe, S. 2006, ApJ, in press
- (9) Dwaraknath, K., Carilli, C., Goss, W.M. 2002, ApJ, 567, 940
- (10) Fan, X., Strauss, M., Becker, R., White, R., Gunn, J. et al. 2006, AJ, 132, 117.
- (11) Fan, X., Carilli, C.L, Keating, B. 2005, ARAA, 44, 41
- (12) Furlanetto, S. & Loeb, A. 2002, ApJ, 579, 1
- (13) Gebhardt, K., Bender, R., Bower, G., Dressler, A., Faber, S. et al. 2000, ApJ, 539, L13
- (14) Gnedin, N.Y. 2000, ApJ, 535, 530
- (15) Kanekar, N. & Chengalur, J. 2003, A&A, 399, 857
- (16) Kanekar, N. & Briggs, F. 2004, New AR, 48, 1259
- (17) Klamer, I., Ekers, R., Sadler, E., Weiss, A., Hunstead, R., de Breuck, C. 2005, ApJ, 621, L1
- (18) Lane, W. & Briggs, F. 2002, ApJ, ApJ, 561, L27
- (19) Paschos, P. & Norman, M. 2005, ApJ, 631, 59
- (20) Peck, A., Taylor, G., Fassnacht, C., Readhead, A., Vermeulen, R.. 2000, ApJ, 534, 104
- (21) Pentericci, L., McCarthy, P. Rottgering, H., Miley, G., van Breugel, W. 2001, ApJS, 135, 638, L61
- (22) Petric, A., Carilli, C., Bertoldi, F., Fan X., Strauss, M. et al. 2003, AJ, 126, 15
- (23) van Breugel, W., De Breuck, C., Stanford, S. Stern, D., Rottgering, H. et al. 1999, ApJ, 518, L61
- (24) Venemans, B.P., Rottgering, H., Overzier, R., Miley, G., De Breuck, C. et al. 2004, A&A, 424, L17
- (25) White, R., Becker, R., Fan, X., Strauss, M. 2003, AJ, 126, 1
- (26) Wyithe, S. & Loeb, A. 2006, ApJ, 646, 696
- (27) Wyithe, S. & Loeb, A. 2005, ApJ, 625, 1