On the 3 dimensional structure of edge-on disk galaxies
Abstract
A simple algorithm is employed to deproject the two dimensional images of a pilot sample of high-quality images of edge-on disk galaxies and to study their intrinsic 3 dimensional stellar distribution. We examine the radial profiles of the stars as a function of height above the plane and report a general trend within our sample of an increasing radial scalelength with height outside of the dustlane. This could be explained by the widespread presence of a thick disk component in these galaxies. In addition, the 3-dimensional view allows the study of the vertical distribution of the outer disk, beyond the break region, where we detect a significant increase in scalelength with vertical distance from the major axis for the truncated disks. This could be regarded as a weakening of the “truncation” with increasing distance from the plane. Furthermore, we conclude that the recently revised classification of the radial surface brightness profiles found for face-on galaxies is indeed independent of geometry. In particular, we find at least one example of each of the three main profile classes as defined in complete samples of intermediate to face-on galaxies: not-truncated, truncated and antitruncated. The position and surface brightness that mark the break location in the radial light distribution are found to be consistent with those of face-on galaxies.
keywords:
galaxies: photometry – galaxies: structure – galaxies: fundamental parameters – galaxies: evolution – galaxies: formation galaxies: individual: ESO 380-019, ESO 404-018, FGC 2339, IC 4871, NGC 522, NGC 1596, NGC 3390, NGC 4179, NGC 5290, NGC 5290, NGC 5981, UGC 104591 Introduction
To study galaxy formation and evolution it is often helpful to imagine that galaxies are made up of a small number of separate components. Surface photometry of galaxies provides a very simple way of parameterising these various components. By modelling the surface-brightness distribution of a galaxy and thereby parametrising the individual components, we obtain a common ground to measure, compare, and sort large samples of galaxies.
Owing to their flat geometry the random orientation of a specific galaxy disk provides us with different projected views of the, presumably, common underlying 3 dimensional distribution. In particular, one gets complementary views from observing face-on or edge-on galaxies. In the face-on view, one studies the radial distribution of the starlight discussing, e.g., non-axisymmetric features such as bars, rings, or spiral arms. In the edge-on view on the other hand, one is able to study the vertical distribution – e.g., disentangle thick disk, thin disk and stellar halos. Due to a longer line-of-sight projection, the edge-on view allows in principle the exploration of the radial profile to larger distances.
Early on, from face-on galaxy observations, several authors (e.g. Patterson, 1940; de Vaucouleurs, 1959) noticed that the radial light distribution of stellar disks is well described by a simple exponential, albeit the lack of a clear physical explanation for this fact. Later on, Freeman (1970) called these disks Type I – as opposed to some other galaxies called Type II – showing a break in their radial profile with a downbending steeper outer region, or equivalently, a flatter inner region.
Using the edge-on view, van der Kruit (1979) discovered that the exponential decline does not continue to the last measured point, but is truncated after several radial scalelengths. Afterwards, with the advent of CCD technology, several groups (Barteldrees & Dettmar, 1994; Pohlen et al., 2000b; Florido et al., 2001; de Grijs et al., 2001; Pohlen, 2001; Kregel et al., 2002) studied larger samples of edge-on galaxies to find out if and at what radius this truncation occurs.
More recently, Erwin et al. (2005), Erwin et al. (2006), and Pohlen & Trujillo (2006) have analysed surface brightness profiles of face-on to intermediate inclined galaxies and revised our view on disk truncations. They identified three basic classes of surface brightness profiles depending on the apparent break features or lack of them: 1) The well known Type I that has an exponential profile, with no break. 2) Type II with a ‘downbending break’. 3) A completely new class, called Type III, also described by a broken exponential but with an upbending profile beyond the break. In this view the classical truncations described initially in the pioneering work of van der Kruit (1979) and van der Kruit & Searle (1981) are in fact part of a generalised Freeman Type II class (Freeman, 1970). In this picture truncated galaxies show a surface brightness profile with a shallow inner and a steeper outer exponential region separated at a relatively well defined break radius.
These results are in agreement with those reported by Pohlen et al. (2002a), who obtained deep photometry of three face-on galaxies and clearly demonstrated that the sharp cut-offs111It is interesting to note that in this concept the truncation radius is often equal to the last measured point and therefore much further out compared to the break radius of a broken exponential fit. fitted to profiles of edge-on galaxies (e.g. by van der Kruit & Searle, 1981; Barteldrees & Dettmar, 1994; Pohlen et al., 2000b) are in fact not complete but better described by a broken exponential. Even before, de Grijs et al. (2001) and Pohlen (2001) noted that for edge-on galaxies the surface brightness distribution does not disappear asymptotically (‘vertically’) into the background noise. Interestingly, Hunter & Elmegreen (2006) find a similar broken exponential shape for many objects in their large sample of irregular galaxies.
The redefinition of the truncation as a point at which the two exponential fits meet solves, among other things, the apparent contradiction between simulations by Holley-Bockelmann & Mihos (2001) and the edge-on observations of Barteldrees & Dettmar (1994) and Pohlen et al. (2000a). The latter authors find that ‘truncations’ are as ‘close’ as twice the radial scalelength from the centre in contradiction with the simulations. Furthermore, ‘early’ truncations (i.e., at ) of edge-on galaxies have been always questioned by the ‘face-on viewers’, who had never observed a face-on galaxy with a sharp truncation at a distance of twice the scalelength.
Despite the line-of-sight enhancement of the surface brightness level in edge-on galaxies, star counts in nearby galaxies are able to provide significantly deeper profiles with much higher S/N. Using this completely independent method, Ferguson et al. (2006) followed the profile of the face-on galaxy M 33 down to I-mag , which is currently unreachable with surface photometry. Their result shows that the broken exponential description is valid down to the last bin above the noise level and an actual edge of the disk is not found, at least for this galaxy.
Nevertheless, there still seem to be some open issues for a complete reconciliation of the renewed face-on with the ‘old’ edge-on view (de Zeeuw, 2007) as to provide a consistent picture of the three-dimensional structure, for example:
-
•
Is the broken exponential structure, now well observed for face-on galaxies, quantitatively consistent with the truncated profiles observed for edge-on galaxies?
-
•
Do we see a different kind of truncation in the deeper views provided by the edge-on galaxies?
- •
-
•
Does the frequency of different profile classes found for the face-on galaxies match the edge-on results?
-
•
Why did the former edge-on surveys, with large and deep samples, not discover the new class of Type III profiles?
To answer these questions and disentangle the crucial problems with the line-of-sight integration (see e.g. Pohlen et al., 2004a) we decided to deproject a sample of edge-on galaxies. This can only be done using some geometric assumption. Here we choose the assumption of axial symmetry. This will allow us to gain insight into the three-dimensional galactic stellar disk structure by bringing together the classical face-on and edge-on views.
The vertical structure may well be the key to understand the nature of the different breaks in the surface brightness profiles, by setting additional constraints on the various physical explanations put forward. For example, some recent star formation models Elmegreen & Hunter (2006); Li et al. (2006) are now able to produce the observed broken exponential structure, but, alternatively, Debattista et al. (2006) also find downbending breaks using purely collisionless -body simulations. Once the nature of the galactic stellar disk is determined it will be fully justified to utilise these breaks for comparison of galaxies at various redshifts as done by Pérez (2004), Trujillo & Pohlen (2005) or Tamm & Tenjes (2006), and explain their appearance in cosmological simulations as shown by Governato et al. (2007).
The remainder of this paper is organised as follows. Section 2 describes our sample selection and data. In Section 3 we introduce our method to deproject the edge-on galaxies. The results are given in Section 4, we discuss them in Section 5 and conclude in Section 6. In Appendix A we give detailed comments for all our galaxies and show in Appendix B radial surface brightness profiles and isophote maps for all galaxies.
2 Data
All optical images used in this paper were taken as part of a PhD study on the radial structure of galactic stellar disks by Pohlen (2001). Originally, the disk galaxies () were chosen according to the allocated observing time, the observatory (north/south), and the available FOV (″) to meet the following morphological selection criteria verified by using images from the Digitized Sky Survey (DSS): 1) The galaxies are edge-on with ∘. 2) Undisturbed with smooth photometric features (see below). 3) They look similar to some prototypical cases like NGC 4565 or IC 2531, this is done to make it possible to consistently fit a simple disk model.
Galaxies with the following characteristics were rejected: 1) Apparent spiral arms, indicating a lower inclination. 2) A significantly asymmetric or disturbed disk, indicating strong interaction. 3) Two-sided or significantly one-sided warped disks. 4) Galaxies apparently dominated by the light of their bulge component (i.e., there are almost no Sa/Sab galaxies, but several lenticulars). 5) Galaxies that showed only a faint, patchy, not well defined disk. For more details of the original sample we refer the reader to Pohlen (2001) or Pohlen et al. (2004b).
The present sample of 11 galaxies is drawn from this base sample of 72 galaxies as a pilot sample covering a wide range of Hubble types and apparent vertical distributions (thin and thick) while trying to pick galaxies with very few disturbing fore- or background objects. We add an additional NIR image of one of the galaxies to observationally assess the influence of the dust. Global properties of the finally chosen galaxies are given in Table 1.
| Galaxy | RA | DEC | RC3 | T | Diam. | D | |||||||
|---|---|---|---|---|---|---|---|---|---|---|---|---|---|
| (J2000.0) | type | [ ′ ] | [ km s-1 ] | [ km s-1 ] | [Mpc] | [km s-1 ] | [mag] | ||||||
| (1) | (2) | (3) | (4) | (5) | (6) | (7) | (8) | (9) | (10) | (11) | |||
| NGC 522 | .S..4/ | 3. | 7 | 2. | 6 | 2727 | 2729 | 37. | 9 | 168 | 20.6 | ||
| NGC 1596 | .LA..*/ | 2. | 0 | 4. | 1 | 1508 | 1227 | 17. | 0 | 98 | 19.3 | ||
| NGC 3390 | .S..3./ | 3. | 0 | 3. | 6 | 2850 | 2696 | 37. | 4 | 210 | 21.4 | ||
| NGC 4179 | .L..../ | 2. | 0 | 3. | 9 | 1239 | 1269 | 17. | 6 | … | 19.6 | ||
| ESO 380-019 | .S..6/ | 6. | 0 | 3. | 6 | 2937 | 2793 | 38. | 8 | 240 | 21.2 | ||
| NGC 5290 | .S..4/ | 3. | 7 | 4. | 0 | 2588 | 2817 | 39. | 1 | 219 | 20.8 | ||
| NGC 5981 | .S..5$/ | 5. | 0 | 2. | 5 | 2528 | 2813 | 39. | 1 | 251 | 20.6 | ||
| UGC 10459 | .S..6. | 6. | 0 | 1. | 5 | 9001 | 9252 | 128. | 5 | 218 | 21.5 | ||
| IC 4871 | .SXS7?/ | 6. | 7 | 3. | 1 | 1927 | 1726 | 24. | 0 | 115 | 19.6 | ||
| FGC 2339 | .S..6/ | 6. | 0 | 1. | 8 | 3097 | 3096 | 43. | 0 | 85 | 19.5 | ||
| ESO 404-018 | .7?/ | 7. | 0 | 2. | 6 | 2275 | 2144 | 29. | 8 | 73 | 19.1 | ||
(1) Principal name, (2) right ascension, (3) declination, (4) RC3 coded Hubble-type, and the (5) Hubble parameter T (all taken from de Vaucouleurs et al., 1991), (6) diameter in arcminutes, (7) heliocentric radial velocities, (10) maximum deprojected rotation velocity of the gas, and the B-Band absolute magnitude (11) (taken from LEDA). According to the heliocentric radial velocities corrected for the Local Group infall into the Virgo cluster (8) from LEDA, we estimated the (9) distances following the Hubble relation with the Hubble constant from the HST key project of km s-1Mpc-1 Freedman et al. (2001).
The images were obtained in six different observing runs between 1998 and 2004. Two runs (E1 and E2) at the Danish 1.54m telescope and one (E3) at the 3.6m NTT telescope, both at the European Southern Observatory in Chile. One run (C1) at the 1.23m telescope and one (C2) at the 3.5m telescope both at Calar Alto in Spain. And finally one run (L1) at the Hall 42” (1.06m) telescope of the Lowell Observatory at Anderson Mesa (USA).
During the two runs with the 1.54m Danish telescope it was equipped with the DFOSC camera and the C1W7/CCD which is a 2k x 2k LORAL chip providing a field size of and a scale of pixel-1. At the NTT we used EMMI, equipped with a 2k x 2k Tektronix chip providing a field size of and a scale of pixel-1. The run at the Calar Alto 1.23 m telescope was done in service mode with the Site#18b chip, a 2k x 2k SITE CCD with 24 m pixel size, providing an unvignetted field of and a scale of pixel-1. At the 3.5m telescope we used the wide-field near infrared camera OmegaPrime with a 1k x 1k pixel HAWAII HgCdTe array by Rockwell, providing a field of at a scale of pixel-1. During the run at Anderson Mesa the 42” telescope was equipped with the NSF CCD used with 2x2 binning providing a field size of and a scale of pixel-1. For the optical imaging the available standard Bessel R and V filter at ESO, and Johnson R at Calar Alto and Anderson Mesa are used. The NIR image with OmegaPrime is in the K′-band. Table 2 summarises the detailed observational parameters for each image.
| Galaxy | Filter | Date | Site | Exp.time | Seeing | Coadds |
|---|---|---|---|---|---|---|
| [mmyy] | [min] | [″] | # x [s] | |||
| (1) | (2) | (3) | (4) | (5) | (6) | (7) |
| NGC 522 | R | 1198 | L1 | 60.0 | 3.0 | 6x600 |
| NGC 1596 | R | 0198 | E1 | 45.0 | 1.3 | 8x300, 2x150 |
| NGC 3390 | R | 0198 | E1 | 51.7 | 1.6 | 3x600, 3x300, 2x200 |
| NGC 4179 | V | 0599 | E2 | 65.0 | 1.7 | 1x600, 1x480, 1x360, 1x300, 9x240 |
| ESO 380-019 | V | 0599 | E2 | 60.0 | 1.6 | 6x600 |
| NGC 5290 | R | 0699 | C1 | 60.0 | 2.0 | 3x600 |
| NGC 5290 | K′ | 0204 | C2 | 38.0 | 1.2 | 38x60 |
| NGC 5981 | R | 0699 | C1 | 60.0 | 1.7 | 6x600 |
| UGC 10459 | R | 0699 | C1 | 60.0 | 1.6 | 6x600 |
| IC 4871 | V | 0599 | E2 | 60.0 | 1.4 | 6x600 |
| FGC 2339 | R | 0700 | E3 | 30.0 | 0.9 | 3x600 |
| ESO 404-018 | V | 0599 | E2 | 60.0 | 1.3 | 6x600 |
(1) Galaxy name, (2) filter, (3) observing date, (4) site, (5) the total coadded on-source exposure time, (6) seeing, as measured on the final combined image, (7) the number of individual images with their individual exposure times.
For more details about the data reduction (i.e. flatfielding, mosaicing, and sky subtraction) and photometric calibration we refer to Pohlen (2001); Pohlen et al. (2004b). Details of the NIR data reduction can be found in van den Berg et al. (2006).
2.1 Preparation of the images
Before deprojecting our galaxy images we first have to prepare the images, here we describe the procedure followed in this work (see Fig. 1).
As a first step we mask all the foreground stars and the background galaxies. To do this semi-automatically, we use SExtractor (Bertin & Arnouts, 1996) to create an object catalogue. Depending on the measured ellipticity and the provided star/galaxy classifier we separated stars from galaxies, which in turn get assigned circular masks with radii depending on their measured flux. The output is a DS9 region file which is overlayed on the galaxy image and visually inspected for each of the masked objects. For highly elliptical background galaxies the mask is changed to an ellipse. In addition we have to adapt the radii of the masks. Typically one opts for a conservative masking (i.e., prefer to mask more than necessary and leave ‘larger holes’) to make sure that all non-galaxy features are removed.
However, since our deprojection method cannot deal with masked areas (actual holes) we have to interpolate the flux across our mask. By doing this, one is forced to chose the mask radius as small as possible in order to not introduce too much unwanted structure. This approach clearly leaves residuals on the masked, interpolated image which will be discussed later (cf. Section 3.7).
In a second step the galaxy image is rotated to align the galactic plane parallel to the major axis using the smallest angle of rotation according to their true position on the sky (chip). The rotation and centering is done by blinking the adjacent sides and minimising the difference by eye. Depending on the intrinsic symmetry this can be done down to an accuracy of ∘.
The third step is to cut the galaxy into 4-quadrants and average them. This procedure increases the S/N and minimises the residuals from the interpolated, masked regions and gives a more regular averaged galaxy. The influence of the dustlane and intrinsic asymmetries will be discussed later (cf. Section 3.7).
The final step is smoothing the image. Since our deprojection code only handles one radial cut at a time, we choose the kernel size for the Gaussian smoothing to match the vertical increment between successive deprojections in order to get fully independent cuts but using all available rows.
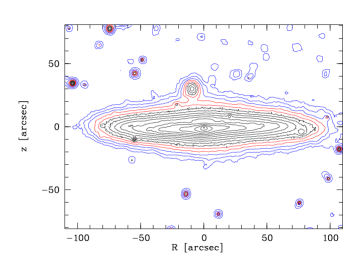
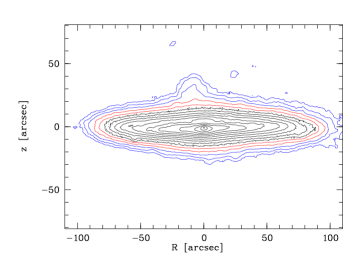
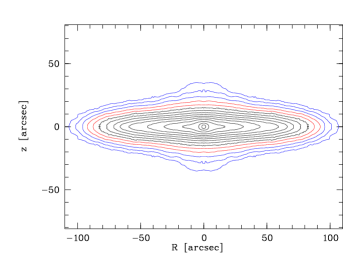
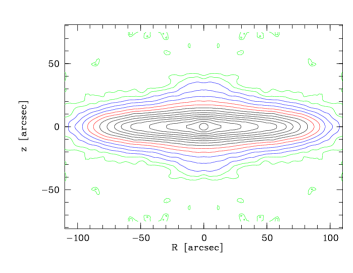
Contour maps of NGC 5981 showing the four main steps in image preparation. The upper left panel shows the rotated, original image. The upper right panel shows the image after masking of fore-and background sources and interpolating across the masks. The lower left panel shows the galaxy after averaging the four quadrants. The lower right panel shows the galaxy after Gaussian smoothing. The equidistant contour levels plotted are in all cases the same, except for the smoothed version where two additional outer contours are added.
3 Method
In this section we describe and test the method used to recover the 3D structure of the available disk galaxies. We start with describing the deprojection algorithm (Section 3.1) and discuss the noise properties of the reconstructed 3D distribution, especially after the original image has been smoothed with a Gaussian kernel (Section 3.2). To further reduce the noise we applied an additional denoising (Section 3.3). In Section 3.4 we discuss in detail our choice of fitting function for the radial surface brightness distribution. Then we describe how the radial profiles of the recovered distribution for a given are actually fitted (Section 3.5). In Section 3.6 we apply the method and the fitting procedure on a large sample of artificial galaxy images in order to test the method’s ability to recover the underlying 3D distribution. In this set of artificial images the influence of the inclination of the galaxy and the existence of dust on the recovery of the 3D distribution is tested. Finally, we estimate the effects of our image preparation on the resulting profiles using real galaxies in Section 3.7.
3.1 Deprojection
The deprojection of axially symmetric quantities is a classical problem in astronomy (e.g., Lucy, 1974). It is considered for determining the 3D stellar orbit structure in elliptical galaxies (e.g., Dehnen & Gerhard, 1993, 1994; Binney, Davies & Illingworth, 1990), and in determining cluster 3D structure from X-ray observations (Fabricant et al., 1984) and more generally from X-ray, Sunyaev-Zeldovich and cluster weak-lensing data (Zaroubi et al., 1998, 2001). In the case of edge-on galaxies, Florido et al. (2001, 2006) have applied an inversion method to obtain deprojected profiles before, but without studying a dependence with the vertical distance from the plane. Here we apply a simple analytical method that employs the, so called, Fourier Slice Theorem in order to recover the intrinsic 3D stellar distribution from our sample of high quality 2D edge-on disk galaxy images.
The disk galaxy images are deprojected as follows. We adopt the convention that bold-face symbols denote 3D quantities (e.g., ). Let the observer’s coordinate system be defined with the Cartesian axes , with the axis aligned with the line-of-sight. The disk galaxy axis of symmetry lies along the -axis which is perpendicular to the line-of-sight. Let denote a projected quantity (image) of the source function . The 3D Fourier transform of the source function is related to the image by
| (1) | |||||
Note that functions marked with are in Fourier space.
This relation could be easily understood since the galaxy has a rotational symmetry, i.e., and its Fourier transform is where . The deprojection is then obtained by inverse Fourier transform of and replacing with , namely by using the following equation:
| (2) |
Here is the zero order Bessel function.
Notice that for a specific radial slice, i.e., a cut at a given and parallel to the major axis, the integral (2) can be written simply as,
| (3) |
Where is the Fourier transform over the image x-direction. This way of writing the equation enables us to easily deproject certain radial slices of the image, or collapsing the whole z-direction of the image to recreate the equivalent of a face-on view of the galaxy.
In principle, it is easy to obtain an equation similar to (2) for the general case of a disk with an arbitrary inclination angle. However, one can show that for such cases there is a cone in k-space inside which there is no information on the 3D structure in the image. The general case is beyond the scope of this paper and is not needed for the range of inclinations we restrict our selves to i.e., to ∘ (see section 3.6). The interested reader is referred to Zaroubi et al. (1998, 2001).
Furthermore, one can show that the Fourier Slice Theorem approach for inverting edge-on galaxies is actually another way of writing the inverse Abel transform (Binney & Tremaine, 1987). The advantage of the Fourier space language here is that it avoids taking direct derivatives of noisy data, hence, making the inversion more stable.
The applied Fast Fourier Transform (FFT) assumes periodic boundary conditions which has to be satisfied by our images. Therefore, one has to pad the image with at least twice the number of the image pixels along each axis. However, since FFT of sharp transitions will give a strong aliasing signal in the deprojected slice, we do not apply zero padding. Rather we padded the image with white noise background with the same rms as the noise in the observed image. The residual small differences at the edge changing from the artificial white noise to the actual noise in the background of the image is washed out by the final wavelet denoising and Gaussian smoothing of the image (see Section 3.2 and 3.3). Further tests with more careful tapering of the image’s edge with a Fermi-Dirac function without adding noise showed that there is no significant influence on the deprojected profiles.
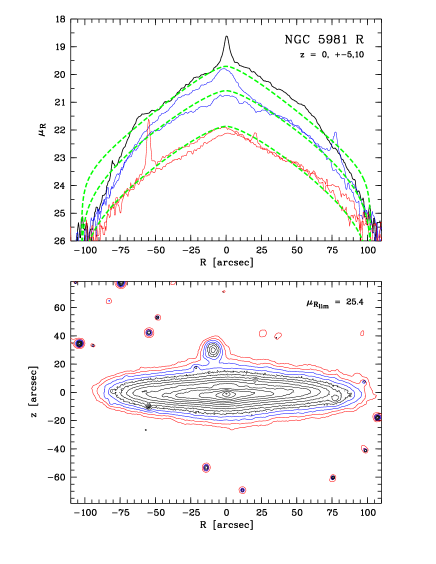
As a zero-order test, we deproject the image of NGC 5981 and then reproject it back. The result is that we obtain profiles that are identical to those of the original image (cf. Fig. 2) down to error level. Most of this error actually comes from the reprojection – not the deprojection – procedure. The reason is simply that the deprojection is a differential quantity that depends on the intensity of the image at a given radius, whereas the reprojection is an integration procedure that will depend on the intensity of galaxy at every radius including radii beyond those explored in the image (i.e., after the noise dominates over the signal.) A more thorough testing of the method in which we compare the deprojected 3D structure with the original one will be presented in Section 3.6.
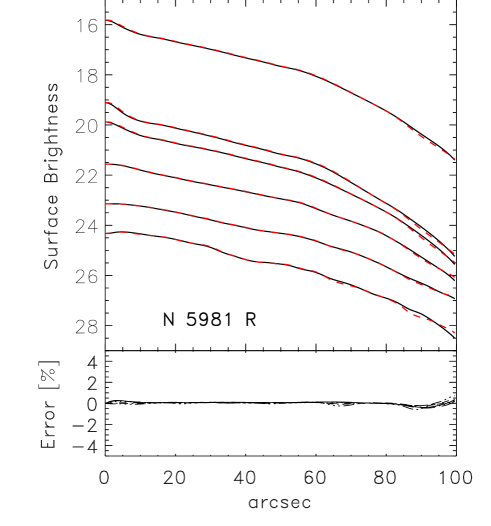
In the upper frame the radial profiles of the symmetrised image (dashed-lines) and those of the deprojected-reprojected image (solid-lines) are shown. The uppermost profile is the vertically integrated profile, while each of the others represents a cut at increasing vertical distance from the major axis. The lower frame shows the percentage error one obtains from this procedure.
3.2 Noise properties and smoothing
To explore the noise properties, let us suppose that the image only contains white noise, with rms , i.e., . The noise correlation function in the deprojected image is given by
Not surprisingly, the high frequency components dominate and hence some smoothing must be employed. The analytic nature of the correlation matrix is an attractive feature of the method.
Another nice feature of the method is that any isotropic smoothing function applied to the image will depend only on the modulus of the radial wavevector, , in the deprojection. This can easily be seen from the previous equations. A simple and practical Gaussian smoothing filter, with smoothing scale , gives an auto-correlation of the noise of the form
| (4) | |||||
where is a hyper-geometric function. This has a particularly simple asymptotic form,
| (5) |
Since we are interested in the large scale features of the reconstruction a Gaussian smoothing is applied on the image. The choice of the FWHM of the smoothing kernel is discussed in 2.1.
Despite these simple analytic features of the noise properties, we sample the noise properties of the smoothed 3D structure created by the method with deprojecting noisy slices of the image (with a given z well outside the galaxy). For each image we deproject some 10 randomly selected lines, average their rms and use that as our noise estimate. The profile of the reconstructed noise rms is shown in every set of reconstructed profiles (see Fig. 5).
The noise is dominated not by pixel to pixel variations, but by any residual large scale asymmetries in the background as well as residuals from the masking (cf. Section 2.1). The latter cause the somewhat bumpy structure of the resulting deprojected profiles (see Fig. 5).
The seeing acts in effect as an additional Gaussian smoothing of the image. This type of smoothing flattens the brightness profile around the center but has very little influence on the scalelength measurements.
3.3 Wavelet Denoising
In order to reduce the apparent bumpy structures along the radial profiles we apply an extra denoising algorithm based on wavelet expansion. The employment of this algorithm is not necessary and we tested that it does not change the quantitative results of the deprojection in any significant way, it however reduces the apparent “bumpiness” in the radial profiles.
The denoising scheme adopted here follows the method proposed by Donoho (1992) (see also Donoho & Johnstone, 1994; Zaroubi & Goelman, 2000) where the wavelet coefficients are reduce with a constant equal to the rms of the white noise. This procedure is known as the soft thresholding of wavelet coefficients. The wavelet functions used here are the Daubechies’ discrete wavelets (Daubechies, 1988) with 12 parameters (DAUB12).
3.4 Profile shape and fitting function
The recent studies of profile shapes for face-on disk galaxies (Erwin et al., 2005, 2006; Pohlen & Trujillo, 2006) and irregular galaxies (Hunter & Elmegreen, 2006) suggest that the broken exponential is a good fitting function for the radial light distribution (cf. Section 1). Technically, this results in a discontinuity between the inner and outer slope, which is unphysical and of course not implied. Pohlen & Trujillo (2006) find an extended transition or break region, which is not as sharp as measured before (e.g., by Pohlen et al., 2002a). From their sample only a few clean and undisturbed truncated cases (e.g., NGC 5300 or NGC 7437) exhibit a very sharp transition between the inner and outer disk region. Most often their Type II breaks appear with a more gradual transition zone of a size up to kpc. Despite the fact that the exponential function in itself has no clear physical explanation, the broken exponential is a reasonable fitting function that describes the shape of the profiles in a simple and uniform way.
The key point of this description is that the outer disks of truncated galaxies – regardless of any transition zone and the exact shape of the outer profile – makes up a significant fraction of the physical size of the their stellar disks. For example, the ratio between the inner and the outer disk is typically 2 to 1 in radius (Pohlen & Trujillo, 2006), therefore in terms of area the outer disk is even slightly larger. In some cases authors ignore the outer region altogether (e.g., van der Kruit & Searle, 1981; Pohlen et al., 2000b) and use an exponential with a sharp cut-off as their fitting function of choice. However, this is not the case for edge-on galaxies in general as clearly apparent from the examination of the radial profiles of, e.g., NGC 5907 in van der Kruit & Searle (1981) or IC 4393 in Pohlen et al. (2000b). We see the same for several galaxies used in our study. For example, the major axis profiles of ESO 380-019, ESO 404-018, NGC 5981, UGC 10459, and NGC 522 (see Fig. 10 in Appendix B) are obviously better described by a broken exponential fit (Pohlen, 2001; Pohlen et al., 2002b). Many further examples in the literature (e.g., see Jensen & Thuan, 1982; Sasaki, 1987; Näslund & Jörsäter, 1997; Byun, 1998; Pohlen, 2001; de Grijs et al., 2001) show that the broken exponential shape is indeed a very good fitting function even for edge-on galaxies. However, we should mention that some authors (e.g. Florido et al., 2001, 2006), still prefer the description of a smooth, but complete truncation.
To summarise, since the profiles of face-on galaxies are well parameterised by a broken exponential model, and those of edge-on galaxies seem to be, it is useful to apply the same parametrisation for the profiles of the edge-on galaxies studied here.
3.5 Parameter fitting
In order to quantify the behaviour of the recovered 3D stellar distribution of the galaxies, we fit the deprojected radial profiles, for a given , with a simple broken exponential function of the form
In principle, the model includes 5 free parameters, the inner and outer scalelengths and , the inner and outer central surface brightnesses, and and the location of the break radius, , which marks the boundary between the inner and outer regions. However by using the downhill simplex method (Nelder & Mead, 1965) with initial starting values of only the scalelength and central brightness parameters we avoid using the break radius as a free parameter. This is achieved by deciding a-priory that the inner slope is either shallower or steeper than the outer one. This enables the break radius to be determined by the crossing point of two exponential fits found by the algorithm. We find that in all cases, except NGC 1596, the inner profile is shallower than the outer profile. In addition, when the ratio between the two fitted radial scalelengths is about , we fit it with a single exponential profile of the form .
In order to avoid including the bulge and/or bar regions in the fitting procedure, i.e., avoid a detailed bulge to disk decomposition, we used the “marking the disk” method with fixed inner, , and outer, , boundaries (see e.g. Pohlen & Trujillo, 2006). The inner boundary is chosen to exclude the region that is obviously dominated by the bulge plus bar (shoulder) component. The outer boundary is set at the point at which the surface brightness profile is comparable to the noise level (see Section 3.2). In the case of an extended bump clearly visible in the profile, caused for example by a residual from the masking, the boundary is moved further inside. Sometimes a sharp rise or drop appears beyond the outer boundary of the recovered profiles (see, e.g., the face-on equivalent profiles of IC 4871 or NGC 5290 R-band in Fig. 5). This is caused by the Fast Fourier transform (FFT) operation used in the method. The FFT procedure requires periodic boundary conditions. To avoid contamination of the profile at hand by these conditions we increase the size of the image by a certain factor. However, this periodicity still shows up in the noise dominated regions and sometimes close enough to, but never within, the region of interest.
The five starting values for the downhill simplex minimisation are obtained by a single exponential fit to the inner or outer region with an approximate break radius for each galaxy.
3.6 Tests with artificial data
3.6.1 Model grid
To study the influence of the dust and possible non- inclination on the scalelength measurements in our deprojected profiles we used a grid of 96 mock images (400x400 pixels) kindly provided by Simone Bianchi. Using a Monte Carlo radiative transfer method (Bianchi, Ferrara, & Giovanardi, 1996), he calculated single disk models at a range of edge-on inclinations () with different input parameters for the stellar and dust distribution. A similar approach is adopted by Möllenhoff et al. (2006) to measure the influence of dust and inclination for less inclined galaxies.
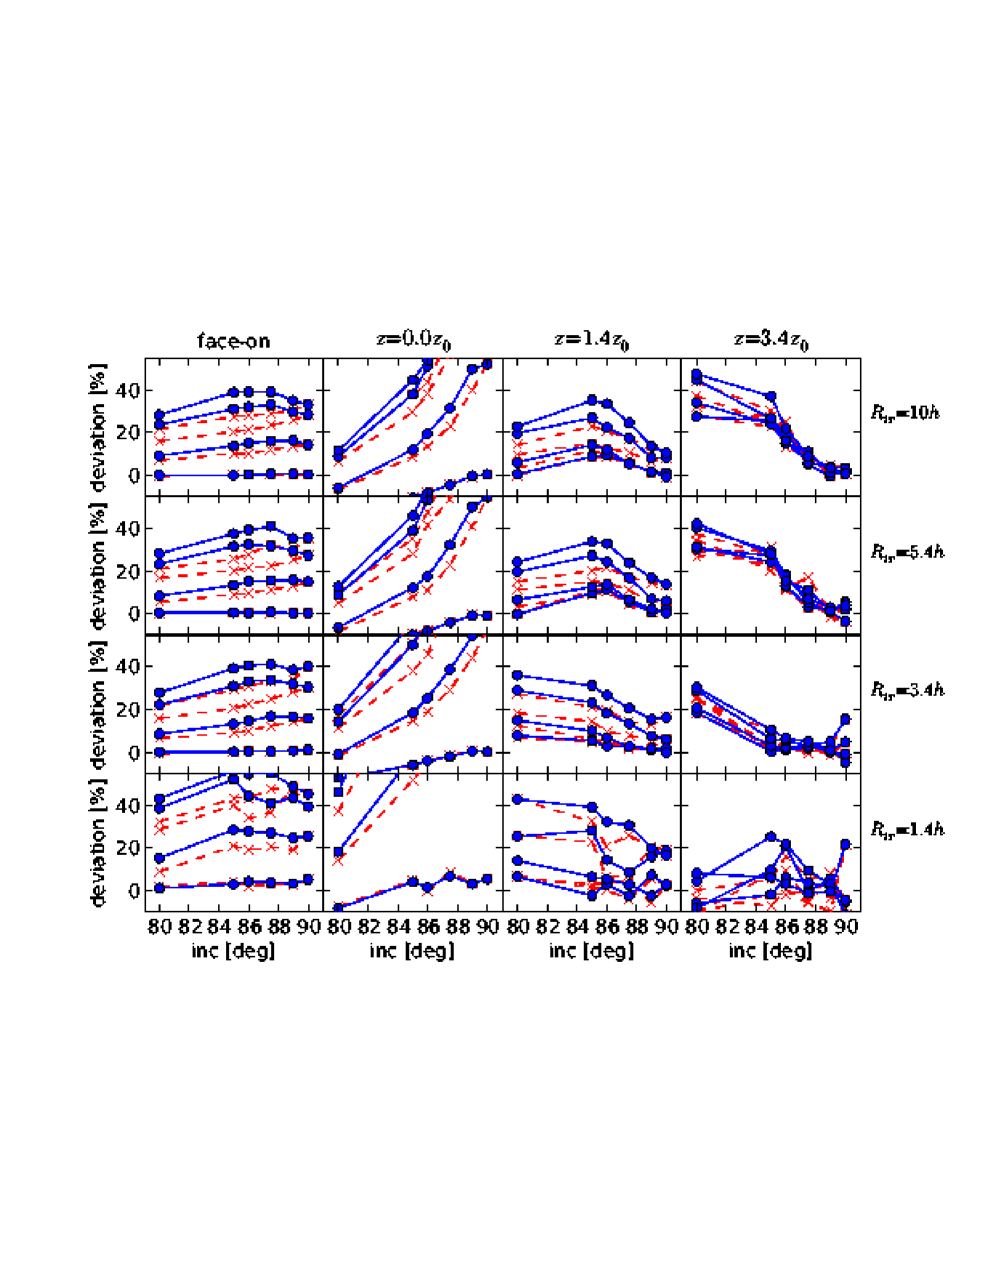
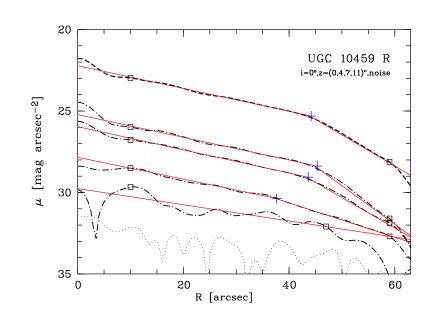
Plotted is the deviation of the measured from the known input scalelength (in percent) from fitting the 96 mock images with the same setup compared to the real galaxies. From left to right the four columns are the results for the face-on-equivalent profiles, for the major axis, and for two cuts at and . The four rows correspond to the different sharply truncated stellar input models, from top to bottom: not-truncated (mimicked by truncating at ), long truncated (truncated at ), intermediate truncated (truncated at ), and finally short truncated (truncated at ). The different symbols represent the two different ways to obtain an average quadrant: filled circles for the applied mean average out of four, crosses for the average out of two quadrants, excluding the dusty side. The different lines connecting the points in each panel are associated to the different dust distributions (ordered according to influence on the stellar disk). From bottom to top we have: the transparent case, the best case, an intermediate case, and finally the worst case. See text for more details.
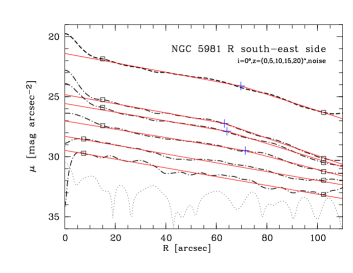
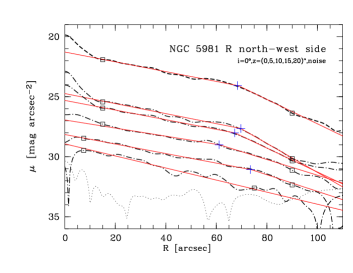
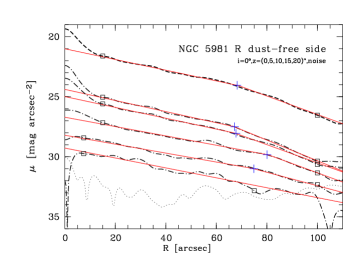
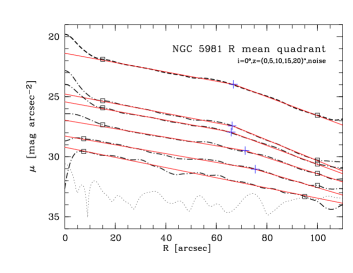
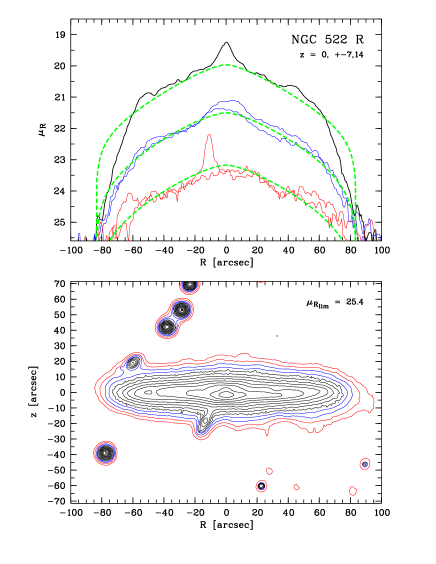
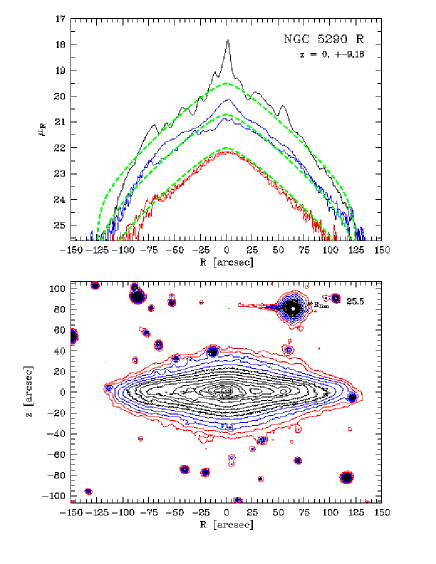
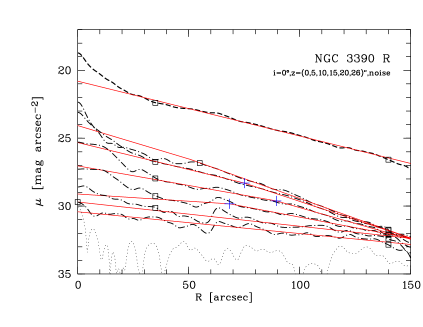
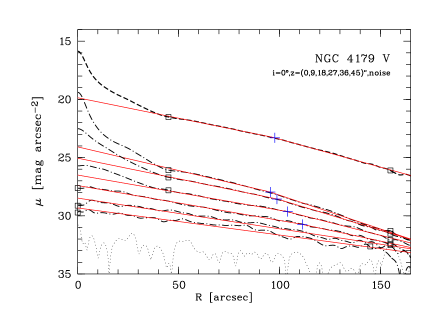
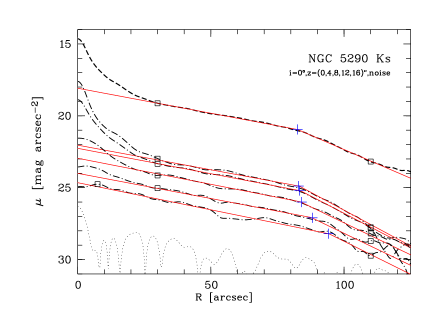
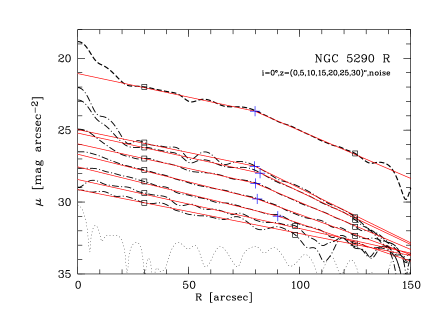
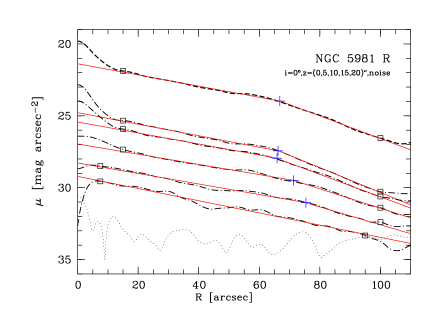
The deprojected surface brightness profiles of NGC 5981 using four different ways to combine the four quadrants. The upper left and upper right panel show the result using only the two quadrants of the south-east and north-west side respectively. The lower left panel shows the profile using only a mean of the two dust-free quadrants. The lower right panel finally shows the resulting profiles after averaging all four quadrants. In each panel, the dashed line (the upper profile) is the face-on-equivalent, radial profile of each galaxy. They are obtained by summing the light of the edge-on galaxy along the columns and deproject the result. The following dotted-dashed lines are the deprojected profiles of individual cuts from top to bottom starting from the major axis towards cuts at larger distance from the plane. The proper distance from the plane is given in the caption (together with name and filter) of each panel in the upper right corner. The dotted line (the lower profile) is the deprojected profile of a noise (or source free) cut outside of the galaxy. Overplotted are on each profile two squares marking the fitting region for the disk model. The result of the broken exponential fits are overplotted on each profile as solid lines where the cross marks the break radius.
The chosen inclination angles are , , , , , and . The stellar disk is a 3D single disk model with exponential profiles both along the radial and vertical direction. The radial scalelength is pix, and the vertical scaleheight is . The only parameter of the stellar distribution that is varied is the position of an outer (sharp) truncation of the light distribution. The truncation parameter has 4 values, , , and . The first value mimics an infinite exponential profile, and the other three values represent a long truncated, an intermediate truncated, and a short truncated stellar disk.
For the dust distribution a set of four different cases with increasing influence on the measured R-band light distribution are adopted. The parameters for these cases are within the range measured by Xilouris et al. (1999). The first case is a dust free (transparent) model which we use as our reference case. The second case, which we call the “best case”, has the following dust parameters: , , and . Here is the R-band optical depth, is the dust scalelength, is the dust vertical scaleheight and is the stellar scaleheight. The parameters of the third case, called the “intermediate case”, are , , and . Finally, the parameters of the fourth case, which we call the “worst case” are , , and . For the sake of simplicity the dust disk is truncated at the same radius as that of the stars. In addition, we have tried several other cases with variable dust truncations, however those did not show any significant difference with respect to the ones presented here.
The number of images used to test the dust and inclination influence on the reconstruction is then doubled (except in the 90∘ cases) by using two different methods of symmetrising the far and near side of the galaxy, insofar as the dustlanes are concerned. In the first case we average all four quadrants, whereas in the second we only average over the two far side quadrants which have less dust influence and ignore the two near side quadrants with the dust lane.
The artificial images are 3x3 pixels carbox smoothed. The deprojection is carried out on the vertically integrated profile, hereafter, the face-on-equivalent view, as well as on the major axis and two higher cuts at and . Since the input profile in this case is sharply truncated, we apply only simple exponential radial fits ranging from the center to 3 times the radial scalelength, except for the short truncated disk where we go out to one scalelength. From these fits we obtain the scalelength and central surface brightness of the deprojected 3D distribution.
3.6.2 Influence on the measured parameters
To visualise the influence of the various dust distributions we plotted the relative deviation in the recovered scalelength as a function of the inclination angle (Fig. 3). Here the relative deviation is defined explicitly as .
From Fig. 3, it is obvious that using only the two dust-free quadrants, shown as dashed-crossed lines, improves the quality of the fit. However, above the gain is only minimal and countered by the advantages of an increased S/N – especially important to reach large vertical distances – and by minimising the residuals from masked objects. Therefore, for the image preparation of the real data we average over all four quadrants, even in the clear presence of dustlanes.
As expected our deprojected, face-on-equivalent, scalelengths are very close to the true, 3D input scalelength in the absence of dust. There is almost no influence of the non edge-on geometry (down to ) of the actual model galaxy which we treat in our deprojection to be always at . For the model galaxies with dust, we see that the error on the scalelength is almost always systematically smaller for galaxies with increasing deviation from the perfect edge-on geometry.
We also notice, from the dust-free case, that for the short-truncated disk the deprojection improves the fits quite noticeably, since it disentangles the truncated part of the profile and avoids fitting for it, as is the case with the projected edge-on view. For the latter we know that they result, slightly depending on the region used for fitting, in a systematic overestimation of the scalelength in the range of (e.g., Pohlen, 2001; Kregel et al., 2002; Kregel, 2003).
However, we note that our face-on-equivalent scalelengths are still systematically overestimated by typically, due to neglecting the existence of the dust component. Naturally the effect is far the worse on the individually deprojected major axes ( overestimated by more than 50%), which probably make only sense for dust-deficient S galaxies or in the dust-reduced NIR bands. However, the narrowness of the dustlane works in our advantage, so that above times the vertical scaleheight the error in the measured scalelength already drops to less than (for ). This means the scalelength measured on the individually deprojected higher vertical cuts are much better.
The discussion of the results that we obtain from the observed galaxies takes the effects of the dust and inclination, that we learned from this section, into account.
3.7 Influence of intrinsic asymmetries
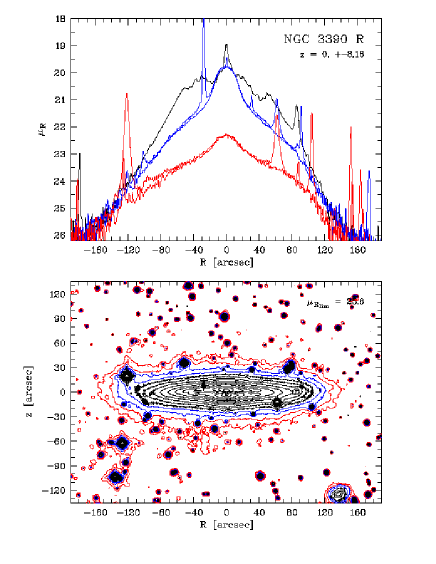
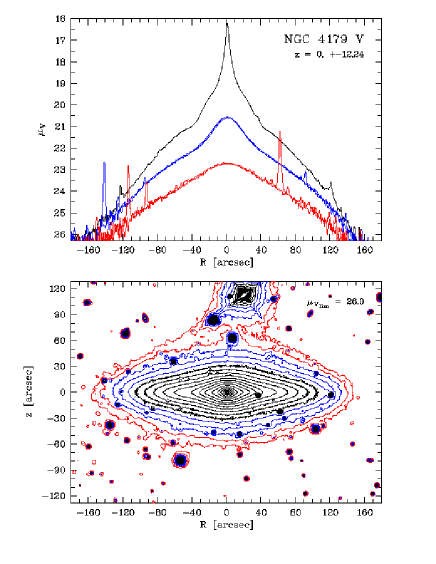
Dustlanes: In the last section we have estimated the influence of the dust on the measured flattening of the inner scalelength using our artificial images. Aside from a solely quantitative correction to be made to the measured scalelength in this case, one could argue that the dust in addition might be responsible for the observed broken exponential structure. In this picture the break would correspond to the point at which the dust lane becomes less important. However, in almost all cases the location of the break does not coincide with the, admittedly difficult to estimate, location of the visible end of the dustlane on the image. An obvious exception is the major axis profile () of NGC 3390 where the dustlane extends out to and indeed causes an apparent break feature at this point (see Fig. 5), hence it is excluded from the fit. In addition, we still find profiles showing a broken exponential structure at more than two times the stellar scaleheight above the disk, where the effect of the dustlane is minimal. Also NGC 4179 does show a break, but has no dustlane at all.
Furthermore, if one assumes that the outer slope is the intrinsic, dustfree slope, the extrapolation into the center will in almost all cases come up too high (much brighter than the bulge peak). This would require far too much dust in these galaxies. Therefore, the dust quantitatively affects the measured inner scalelengths, however, is not responsible for the break in the profiles (cf. Fig. 4).
Intrinsic small scale asymmetries: For real galaxies the residuals from masked objects will certainly affect the recovered profile. The problem is ostensibly aggravated by the averaging process of the four quadrants (cf. Section 2.1), which will mirror any residual on one, to all other sides. However, one has to keep in mind that our deprojection method cannot deal with ‘holes’, so we have to somehow fill these masked regions. For example, in the case of NGC 5981 the extended companion superimposed on the upper left side of the bulge could be well traced in the contour lines of the averaged galaxy image (see Fig. 1). Under these worst case circumstances we made sure that this area is excluded from our fitting region. In the latter case we did not fit beyond ″.
In addition, the final position of the break radius is strongly affected by the small scale asymmetries (star-forming regions, dust concentrations, residuals from masked objects) which vary in each of the vertical profiles. Whereas this only slightly affects the measured scalelength, the meeting point of the two exponential fits (break point) is more susceptible to such variations.
Large scale asymmetries: We do not expect significant large scale asymmetries in our galaxies, since the input sample is morphologically selected to be symmetric. NGC 5981, which is asymmetric relative to the rest of the sample, is a good test case to estimate the effect of averaging quadrants from both sides. The asymmetry is clearly seen in the radial profiles (cf. Fig. 10). The outer slope of the broken exponential fit is significantly shallower on the NW(right)-side, where also the contour map is more extended. Fitting only a mean quadrant obtained from the NW(right)- or SE(left)-side of the galaxy separately (cf. Fig. 4) we find differences of % for the scalelengths of the inner region. In the outer disk (beyond the break) the differences are clearly larger, e.g., 40% on the major axis, due to the stronger asymmetry in the outer disk. However, both sides are equally well fit with the broken exponential function, so we do not introduce a bias on the validity of the applied fitting function by averaging the two sides.
4 Results
Now we move on to present the results obtained by applying the deprojection method on our observed edge-on galaxies. Again here we first apply the method on the vertically integrated image. This results in a profile that is equivalent to the one obtained from azimuthal averaging, for example by fits with concentric ellipses, of face-on galaxies. A direct comparison between the two views (see Section 3.1) is carried out in Section 4.1.
Furthermore, we deproject a number of vertical slices to explore the existence and properties of, for example, a thick disk component. Here the following questions are addressed: does the inner slope flattens with increasing , as expected for some thick disk models? Does the break radius, if present, vary significantly with ? Finally, how does the vertical distribution of the outer disk, beyond the break point, changes with ? These question are addressed in Section 4.2.
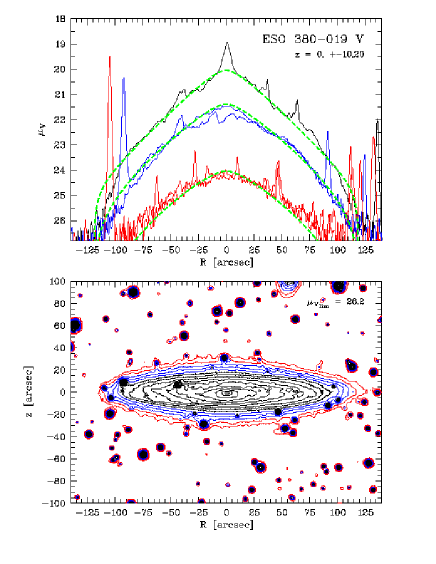
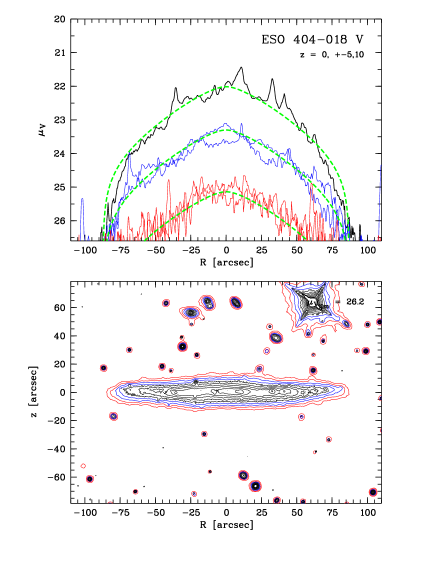
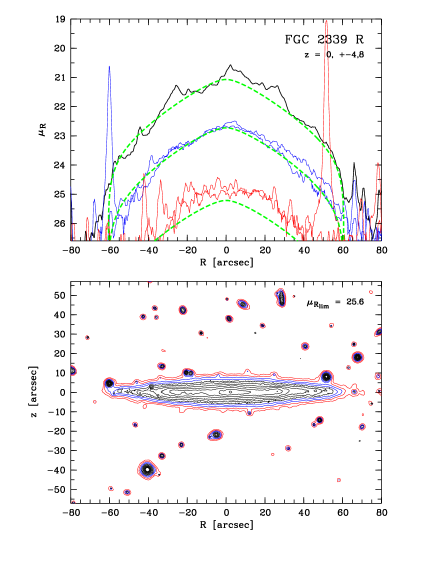
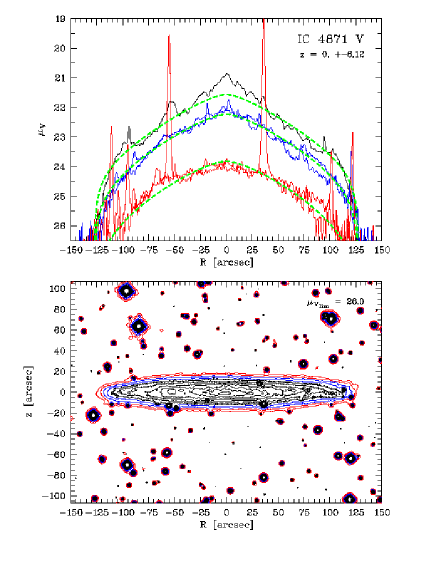
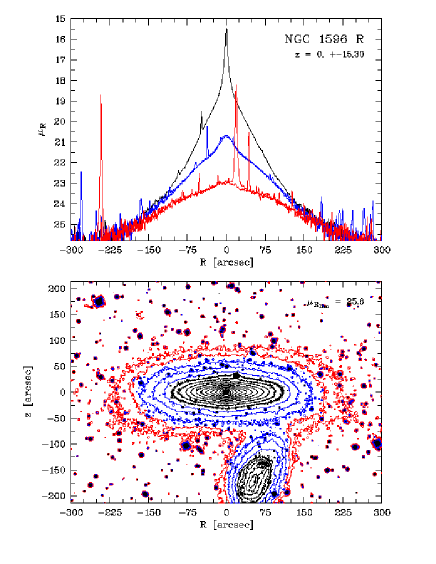
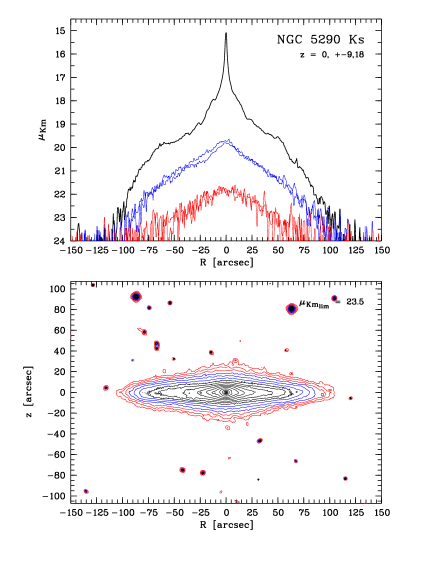
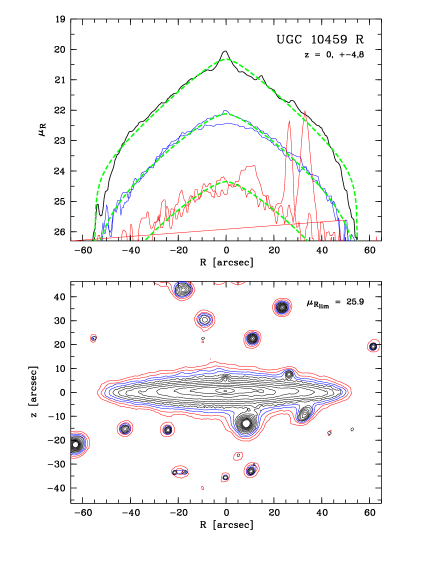
The radial profiles obtained from deprojecting all the galaxies in the sample, together with the best fit broken exponential models are shown in Fig. 5. The results for the face-on-equivalent profile of each galaxy in the sample are tabulated in Table 3.
| Galaxy | Filter | Profile | |||||||||
|---|---|---|---|---|---|---|---|---|---|---|---|
| type | [″] | [″] | [″] | [″] | [″] | [ ] | [ ] | [mag ] | [mag] | ||
| (1) | (2) | (3) | (4) | (5) | (6) | (7) | (8) | (9) | (10) | (11) | (12) |
| NGC 522 | R | II | 22 | 87 | 63.1 | 52.7 | 8.7 | 1.2 | 6.1 | 22.8 | 0.23 |
| NGC 1596 | R | III | 30 | 210 | 100.2 | 27.1 | 53.8 | 3.7 | 0.5 | 24.4 | 0.03 |
| NGC 3390 | R | I | 35 | 140 | 26.9 | 0.21 | |||||
| NGC 4179 | V | II | 45 | 155 | 97.7 | 30.9 | 22.6 | 3.2 | 1.4 | 23.3 | 0.11 |
| ESO 380-019 | V | II | 12 | 117 | 87.6 | 27.9 | 11.5 | 3.1 | 2.4 | 22.9 | 0.26 |
| NGC 5290 | K′ | II | 30 | 110 | 82.5 | 31.2 | 13.6 | 2.7 | 2.3 | 21.0 | 0.00 |
| NGC 5290 | R | II | 30 | 125 | 79.9 | 33.1 | 16.3 | 2.4 | 2.0 | 23.7 | 0.02 |
| NGC 5981 | R | II | 15 | 100 | 66.8 | 27.9 | 13.8 | 2.4 | 2.0 | 24.0 | 0.07 |
| UGC 10459 | R | II | 10 | 59 | 44.2 | 15.6 | 5.7 | 2.8 | 2.7 | 25.3 | 0.03 |
| IC 4871 | V | II | 20 | 136 | 116.5 | 40.4 | 9.7 | 2.9 | 4.2 | 24.4 | 0.27 |
| FGC 2339 | R | II | 37 | 66 | 57.3 | 17.6 | 5.9 | 3.3 | 3.0 | 26.4 | 0.10 |
| ES0 404-018 | V | II | 0 | 92 | 75.6 | 34.0 | 9.6 | 2.2 | 3.6 | 24.6 | 0.13 |
(1) Principal name, (2) filter, (3) profile type (I: no break, II: downbending break, III: upbending break), (4,5) inner and outer fitting boundaries, (6,7,8) break radius, inner, and outer scalelength in units of arcsec, (9) break radius in relation to the inner scalelength, (10) inner scalelength in relation to the outer scalelength, (11) the surface brightness at the break radius (estimated at the crossing point of the two exponential fits), (12) galactic extinction for the appropriate band from NED according to Schlegel et al. (1998).
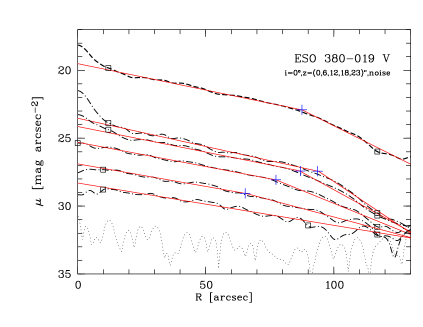
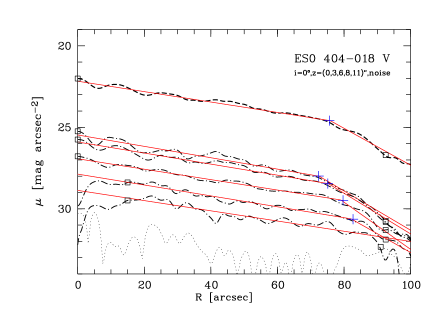

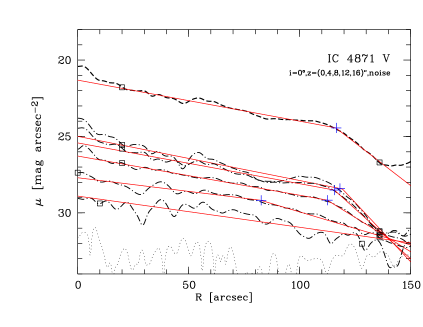
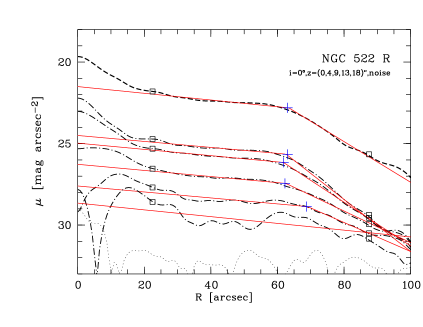
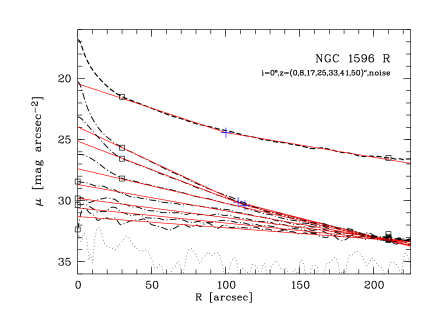
The surface brightness profiles of each galaxy are shown in separate panels. The different line types are explained in Fig. 4.
4.1 The face-on-equivalent view
4.1.1 Face-on vs. Edge-on: profile types.
As mentioned earlier there are three basic classes of surface brightness profiles that have been found for face-on galaxies, Type I, Type II, and Type III (Erwin et al., 2005, 2006; Pohlen & Trujillo, 2006). Here, in the deprojected face-on-equivalent view, we also find at least one example for each of the three types of surface brightness profiles.
All eight Sbc and later-type galaxies (ESO 380-019, ES0 404-018, FGC 2339, IC 4871, NGC 522, NGC 5290, NGC 5981 and UGC 10459) show clear Type II, downbending profiles. In comparison with Erwin et al. (2006) and Pohlen & Trujillo (2006) we cannot increase the level of classification (i.e., assigning sub classes) in order to explore the possible physical origin of the break, for example, star-formation threshold or bar related break. This is mainly because inferring accurate bar sizes in edge-on galaxies is almost impossible.
It is interesting to note that the NIR K′-band profile of NGC 5290, typically assumed to be dust free, shows exactly the same behaviour as the R-band. Therefore, the dust and recent star formation, clearly more prominent in the R-band, do not play a role in the basic classification scheme applied here.
The lenticular galaxy, NGC 4179, also exhibits a Type II profile with a ratio of inner to outer scalelength of . This ratio is somewhat low in comparison to the mean of reported by Pohlen & Trujillo (2006) for late-types, or the median of reported by Erwin et al. (2006) for early-type galaxies.
One galaxy, NGC 3390, although classified as an Sb galaxy, exhibits a dominant outer spheroidal component closely resembling an S galaxy (see Fig. 10). Its face-on-equivalent profile is consistent with being a classical unbroken profile, Type I. Nevertheless, we can also fit to the recovered profile of this galaxy a broken exponential, a Type II. The scalelength ratio in this case is only , and so close to unity that in case of a face-on galaxy this would not qualify as a Type II.
The profile of the second S galaxy, NGC 1596, is very similar to the antitruncations presented by Erwin et al. (2005). The outer profile is distinctly shallower in slope than the main inner disk profile. Although it should be classified as Type III in this sense, the profile is not well described by our simple broken exponential fitting function. The whole disk profile (beyond ″) appears to be almost continuously upbending and one may argue for an extended, exponential break region between breaks at ″ and ″. Nevertheless, Erwin et al. (2005, 2006) show some early-type, face-on counterparts with very similar profile shapes.
4.1.2 Face-on vs. Edge-on: quantitative comparison.
As discussed in Section 2 our sample is not unbiased. However, the unusually high frequency of galaxies with Type II profiles suggests that we indeed have selected against the two other types. For the nine Type II galaxies in our sample, we find that the break radius is in the range between . To compare this with the results of the face-on sample, we have to account for the effect of dust on the inner scalelength. In Section 3.6 we have shown that in the case of dusty edge-on galaxies the resulting scalelengths are typically 20% overestimated (see Fig. 3). Factoring this correction222Without the small correction for the different wavelengths used (R and V band here compared to r’-band for the face-on sample). in one obtains a break-radius in the range of , which matches the range given by Pohlen & Trujillo (2006).
The surface brightness at the break radius ranges from 21.9 to 26.3 R-mag , which also matches the full range for face-on galaxies given by Pohlen & Trujillo (2006). Here, the surface-brightness for each galaxy is corrected for galactic extinction and, in the case of the V-band images, transformed to the R-band assuming .
4.2 Vertical distribution
4.2.1 The inner vertical structure
First we concentrate on the inner disk region, i.e., the region in between the bulge/bar component and the location of the break. For almost all of the late-type galaxies (Sbc and later, for details see Appendix A) we find an increase in the measured scalelength with the distance from the plane. The increase, at , is typically of the order of about %, relative to the major axis scalelength (see upper panel of Fig. 6). Since we know that the omnipresence of dust extinction will mostly affect the major axis profiles, as evident from the systematic flattening one sees for our artificial galaxies (Fig. 3), our measurements of the increase in scalelength in the optical, starting at the major axis, are only lower limits. Consequently, the major axis slope for four galaxies is indeed observed to be flatter than that obtained from adjacent cuts (cf. Fig. 6).
It is interesting to note that this type of flattening towards the midplane, which is for R-band images well explained by the dust effect, is also present at the level of approximately in our K′-band image (NGC 5290). If this is not an intrinsic feature of NGC 5290, one could argue that the dust may still influence the scalelength determination on the major axis even in the NIR band. On the other hand, this seems unlikely since the amount of dust inferred from the K′-band flattening should have a more severe effect on the R-band profile (see Appendix A).
In addition, tests with NGC 5981 (see Appendix A) show that using the mean quadrant instead of the dustfree side, also results in a systematic underestimation for the measured increase in scalelength with distance from the plane.
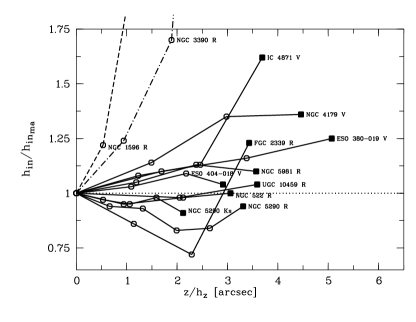
Upper panel: The open circles are the measured inner scalelengths ( ) normalised to the inner scalelengths measured on the major axis for each profile, versus the distance () from the plane normalised to the scaleheight () given in Appendix A. The filled squares mark the values for the outermost profiles. All points for an individual galaxy are connected (solid lines for Type II, dotted-dashed line for Type I, and dashed line for Type III) and the name of the galaxy is added.
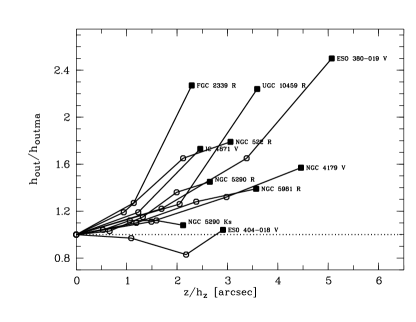
Lower panel: The open circles are the measured outer scalelengths ( ) normalised to the outer scalelengths measured on the major axis for each profile versus the distance () from the plane normalised to the scaleheight ().
4.2.2 The outer vertical structure
Here we focus on the vertical structure of the outer disk, i.e., the region beyond the break radius. For all of the late-type galaxies, namely, Sbc and later, a significant increase of the measured scalelength with distance from the plane is observed (see lower panel of Fig. 6). Whereas for the inner disk the increase in the slope is by a factor of 1.1-1.4, for the outer disk we find a factor of 1.4-2.4. This indicates an extreme flattening of the profile towards larger distances from the plane. Again, the dust, well known for flattening surface brightness profiles, cannot be responsible here since it is concentrated in the plane. This could be regarded as a weakening of the truncation with increasing distance from the plane (see Fig. 7).
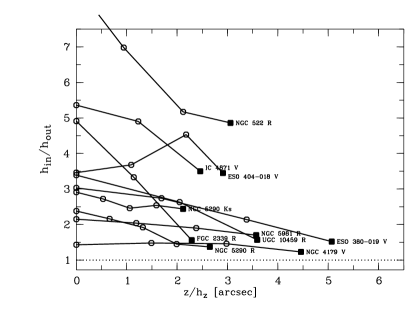
The open circles are the measured ratios of inner to outer scalelength ( ) for each Type II profile with increasing distance () from the plane normalised to the scaleheight (). The filled squares mark the values for the outermost profiles. All points for an individual galaxy are connected (solid lines) and the name of the galaxy is added.
4.2.3 The break radius as a function of
The position of the break radius as a function of vertical distance from the plane () is another constraint that any theory that might explain the truncation phenomenon should satisfy. An inspection of the location of the break radius from the deprojected profiles (Fig. 5) shows that this location does not change significantly as a function of in the first two to three -slices. For the more distant -slices the slopes of the inner and outer regions become closer, due the more substantial flattening in the outer disk, which makes it harder to confidently determine the location of the break radius. A clear demonstration of this is when the inner and outer slopes are very close, in such a case the presence of any genuine small scale structure in the image renders the location of the crossing point very uncertain. This is even more severe when the broken exponential model does not provide a good description of the data, e.g., when the break region is clearly extended (ESO 380-019 or ESO 404-018).
Resorting to the NIR image or concentrating on the smooth S galaxies in our sample, in which the substructure (star-forming region or dust patches) are less prominent, does not improve the matter because for these galaxies, as with the other, the flattening of the outer disk dominates the uncertainty in the location of the crossing point.
To summarise, based on the first 2 to 3 vertical slices, the current data suggest that the location of the break radius for all our galaxies is consistent with being constant.
5 Discussion
Profile classification
In our pilot sample of edge-on galaxies we do indeed find the same three main types of surface brightness profiles as classified by Erwin et al. (2005, 2006) and Pohlen & Trujillo (2006) from their analysis of face-on galaxy images. The broken exponential parameters for the face-on-equivalent view obtained from our edge-on galaxies are well consistent with those found by the analysis of, the more complete, genuine face-on galaxy samples. Only for FGC 2339 the break seems to be at a slightly lower than usual surface brightness, albeit at a typical distance from the center. However, this is also the galaxy with the value of the lowest central surface brightness. Hence, similar to Pohlen & Trujillo (2006), we still cannot disentangle which of the two statements is correct: the surface brightness at the break radius is constant, or it is coupled to the central surface brightness.
We do not find a difference in the shape of the truncation comparing the two profiles for NGC 5920 obtained from the optical and the NIR image. Both show clearly a broken exponential structure in the region between . This is consistent with the findings of Hunter et al. (2006) for the profile shapes of several irregular galaxies using and images from the Spitzer Space Telescope. Irregular galaxies with double-exponential optical light profiles have the same in the NIR. So baring an exception, NIR observation of truncations do not seem to differ significantly from observation in the optical as proposed by Florido et al. (2006).
Pohlen & Trujillo (2006) have shown that Type I galaxies are rare in late-type galaxies and, according to Erwin et al. (2006), more frequent in S galaxies. Accordingly, our only Type I candidate (NGC 3390) exhibits an S-like outer disk structure, despite being classified as Sb. It is interesting to note that in this case the profiles of the individual cuts, close to the major axis but uninfluenced by the dustlane, show some indication of being better described by a broken exponential structure. Therefore, the vertical integration in this case may obscure the existence of a break close to the plane. This is clearly caused by the lack of an apparent break in the vertical slices at larger vertical height above the midplane. This might explain the high frequency of not-truncated disks seen in the early-type face-on galaxy sample of Erwin et al. (2006).
Despite the discussion above about the general agreement between the edge-on and face-on classifications, an edge-on counterpart of the not-truncated, Type I , late-type galaxies (e.g., the face-on NGC 2776 by Pohlen & Trujillo, 2006), is yet to be found. Given the expected frequency of such galaxies () and the size of the parent sample from which we select, we are not able to explain the absence of such galaxies.
If late-type Type III galaxies might be associated with interacting or merging systems, as proposed by Pohlen & Trujillo (2006), the detection of only one Type III galaxy is in full agreement, as we excluded those systems from the original, late-type dominated, sample. In addition, the fact that our Type III galaxy is an early-type one is consistent with the observed increase in frequency of Type III profiles for early-type galaxies (Erwin et al., 2006). To our knowledge, all edge-on Type III galaxies reported in the literature so far are early-types. These galaxies are NGC 4762 studied by several groups (Tsikoudi, 1980; Wakamatsu & Hamabe, 1984; Wozniak, 1994), NGC 4452 shown by Hamabe & Wakamatsu (1989) and NGC 4696C333It is worth noticing, that NGC 4696C is classified as an Sb galaxy (de Vaucouleurs et al., 1991). However, deep imaging, obtained by Pohlen (2001), clearly shows an outer S-like envelope. from Pohlen (2001).
For face-on galaxies, Erwin et al. (2005) differentiate between two different types of Type III profiles. One where the excess light is probably part of the disk which show a relatively sharp transition and both parts are well described with exponentials (Type III-d). And another one where the excess light is associated with the halo/spheroid or bulge (Type III-s). The latter is characterised by a small inner region fitted with an exponential and a continuously upbending outer profile and a changing ellipticity with radius. In the case of NGC 1596 we would argue for a Type III-s classification where the outer structure is associated more with an envelope like structure. This is supported by the difficulty one faces in fitting NGC 1596 with a consistent thin/thick disk combination (cf. Pohlen et al., 2004b). Any bulge component would have to have an unlikely, extremely high, axis ratio (cf. Appendix A). In this case, the observed outer envelope is therefore much better explained by interaction as recently supported by Chung et al. (2006).
Inner Disk
Almost all of the analysed profiles exhibit an increase of the radial scalelength with increasing distance from the plane. Notwithstanding the lack of completeness in our sample, this finding could support the notion of ubiquitous thick disks as proposed by Dalcanton & Bernstein (2002), where these thick disks have to have a systematically larger scalelength, compared to the thin disk. However, in the absence of a consistent two disk fit to the data at all radii the thick disk model is not the only option. Instead one can interpret the increase in the radial scalelength merely as a result either of a radially flattened component above the inner disk or a flattening of the inner disk itself. For example, in the case of the late-type (Scd) galaxy FGC 2339, the whole inner disk region is dominated by a ring- or bar-like structure in the midplane which also alters the shape of the disk above/below the plane over the entire measured vertical extent.
Outer Disk
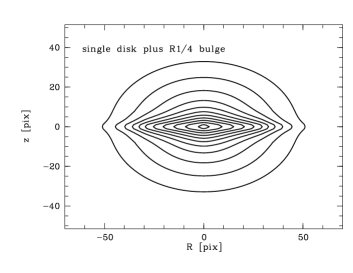
In order to examine what could lead to the observed flattening of the outer disk profile, we invoke several 3 dimensional (3D) toy models. These 3D models are generated by combining separate components, e.g., a truncated thin disk plus a truncated thick disk. The resultant structures are qualitatively compared to those reconstructed from the data. It is important to emphasise here that no attempt is made to fit the data to these models, rather the intention is to explore whether these toy models could generically reproduce the increased flattening seen in the data. The 3D profiles of the models are shown in Fig. 8.
To highlight the flattening in these models we fit broken exponential profiles with the same fitting routine used for the real galaxies (cf. Section 3.5). For example the upper-left panel (1) of Fig. 8 shows a single broken exponential disk model. This type of models does not show any flattening in the reconstructed scalelengths and, therefore, is not favoured by our data.
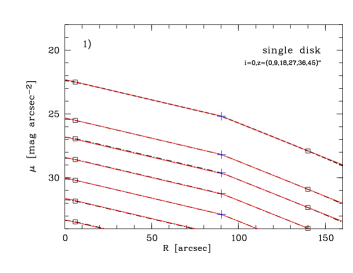
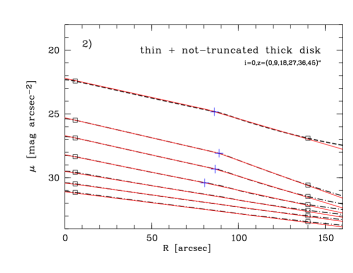
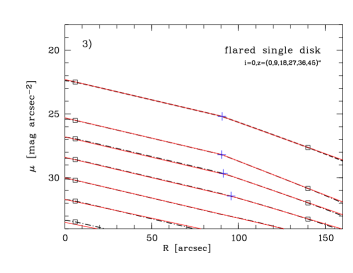
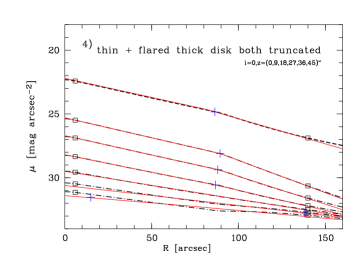
Deprojected radial surface brightness profiles of six model galaxies: single disk (panel 1), truncated thin plus not-truncated thick disk (panel 2), and two models with flaring (panels 3-4). The figure has the same setup as Fig. 5.
Could we be seeing de Vaucouleurs bulges?
Bahcall & Kylafis (1985) have shown that a thin disk plus a bulge can mimic the shape of the isophotes of a thin disk plus thick disk model (without bulge) down to a surface brightness level of about mag . Furthermore, this combination can even produce some flattening of the radial profiles with increasing vertical height beyond the break radius as seen in our models.
Having said that however, there are strong arguments against explaining the observed flattening with a spherical power law bulge component. First, in a sample of 19 early-type galaxies (S0-Sbc) Balcells et al. (2003) find that none of the bulges have a behaviour. Most of their bulges are better fit with exponentials which are not expected to dominate the radial profiles at large distances. Therefore, it is statistically unlikely to attribute the flattening in the outer disk in most of our late-type edge-on galaxies to a spherical bulge component. Second, the observed shape of the outer contours in all the cases studied here appear too much disk-like to be caused by a spheroid (see Fig. 10 and Fig. 9). Third, it is almost impossible to create a bulge which will leave the high S/N major axis profile purely exponential down to the last measured point, but will dominate the radial profile at larger vertical heights above the plane, and doing this all without being clearly visible in a contour map.
In conclusion, since there is no clear sign of a de Vaucouleurs in any of the observed images whereas the outer disk flattening is found in the majority of galaxies in the sample, the answer to the question posed here is, most probably: no.
Does a thin plus thick disk combination produce the increased flattening beyond the break?
If one assumes that the thick disk scalelength is in general larger than the thin disk scalelength, the increase in scalelength with -height in the inner disk will be always present. However, there are various possibilities for producing the extended flattening in the outer disk beyond the break with thin plus thick disk models. The exact shape of the flattening critically depends on the, unknown, outer disk properties of the thick disk.
If, for example, we assume the thick disk to be not-truncated, we are still able to produce some flattening beyond the break (see panel (2) of Fig. 8). However, depending on the surface brightness limit the not-truncated thick disk will become visible at large radii. This could be an explanation for some of the very few Type II + III mixed classifications found for late-type galaxies by Pohlen & Trujillo (2006). These galaxies show two breaks in their face-on surface brightness profile. The first is downbending in the inner region, while the other is upbending in the very outer region. However, none of our edge-on sample galaxies shows this behaviour.
By adding a truncation to the thick disk one can produce a wide variety of broken exponential structures depending, for example, on the ratio of inner to outer disk scalelength ( ). Models with unequal thin and thick disk truncation radii provide even more choice to fit the data.
In conclusion, the answer to the question posed here is: yes. However, the degree of flattening will depend on the details of the 3D model.
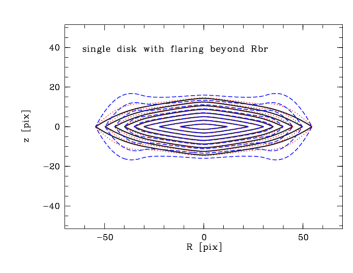
Could the flattening be explained by intrinsic flaring444With intrinsic flaring we do not mean the sometimes observed fact of an increase in scaleheight with radius (e.g. de Grijs & Peletier, 1997), which is most probably related to a combination of thin and thick disk with different scalelengths, but the intrinsic change of the scaleheight for a single stellar disk component. of the stellar disk?
To produce an increased flattening in the outer-disk one can invoke models with intrinsic flaring – similar to those used for the Milky Way (see e.g. Gyuk et al., 1999) – that starts beyond the break radius. In the edge-on view, the contour map of the observed galaxy provides a strong constraint on the degree of flaring. The lower-panel of Fig. 9 shows three different radially broken exponential single disk models with flaring factors555For the Milky Way Gyuk et al. (1999) have models with or between the solar radius and 25 kpc. of , , and . If the flaring factor is chosen to be too large the resulting contour map will blow up in the outer parts, a behaviour that is neither observed in any of our sample galaxies nor in the much larger sample of Pohlen (2001).
In general, it seems that a strong flaring of the stellar disk is rarely observed. In addition, in the few reported cases it appears to be rather associated with Type III profiles, e.g., NGC 4762 (Wakamatsu & Hamabe, 1984; Freeman & Bland-Hawthorn, 2002), and not with Type II as discussed here.
As shown in the panel (3) of Fig. 8, flaring of a single disk beyond the break radius does not always produce the right amount of flattening if compared to our observations. A more promising attempt to apply flaring is obtained by allowing only the thick disk component to flare beyond the break radius (see panel (4) of Fig. 8). This approach could help in cases where the inner disk indicates only a very small value for the ratio of thin to thick disk scalelength. The flaring is then needed to reproduce the observed significant difference of the outer scalelength on the major axis compared to high above the plane. A flaring of the thick disk is also proposed by several authors (e.g. Siegel et al., 2002; Du et al., 2006) for our Milky Way from star-count studies. This flaring would account for the observed variable scaleheight with different direction of the analysed fields.
It is clear that the data can in principle discriminate between possible 3D models, as each will produce different features in the reconstructed profiles. However, we make no such attempt in this paper except to point out the different possibilities.
Break Radius
As we have shown earlier, the location of the break-radius in the current sample is found to be consistent with being height independent. In light of the enhanced flattening of the outer disk relative to the inner disk, the determination of the break radius at large vertical cuts is uncertain and more accurate modelling could reveal significant variation in its location towards the larger distance from the major axis.
Nevertheless, we would like to point out that if such a finding is supported by more data, it could have far reaching implications on theories that attempt to understand how the thin and thick disk are assembled. As such a theory should explain how potentially distinct components of the disk “coordinate” the location of their break radii.
6 Conclusions
This paper has presented a new algorithm for reconstructing the intrinsic 3D structure of galactic disks seen edge-on. The algorithm assumes axial-symmetry and utilises the so-called Fourier Slice Theorem which in the case of edge-on galaxies is equivalent to an inverse Abel-transform. The algorithm is applied to a pilot set of 12 edge-on galaxy images, drawn from a parent sample of 72 galaxies, to obtain face-on-equivalent radial surface brightness profiles, and reconstruct the radial profiles along several vertical cuts, including the major axis.
Comparing the results obtained from the face-on-equivalent profiles with those measured from “real” face-on samples we reach several conclusion. The first, and probably most important, conclusion is that we find in the current edge-on sample at least one example for each of the three basic profile types found in face-on samples: no break, upbending break, and downbending break (Erwin et al., 2005, 2006; Pohlen & Trujillo, 2006). Despite this agreement, our morphologically selected parent sample (Pohlen, 2001), choosing undisturbed and prototypical disk galaxies, clearly favours late-type galaxies with class Type II profiles, i.e., downbending breaks. This might be due to a connection between certain profile types and distinct vertical structures. For example, if late-type Type III galaxies are connected to interaction and/or merging processes, they would probably be excluded from edge-on samples. In other words, they would exhibit distortions, lopsidedness, or warping, which are all prominent in the edge-on view.
Although our parent sample is not unbiased in this sense, our results do show that the parameters for the downbending breaks of the face-on-equivalent profiles obtained from our edge-on galaxies are consistent with those seen in face-on samples. This implies that truncated profiles of galaxies are independent of geometry and there is no distinction in this regard between edge-on and face-on studies.
In this paper we have been able to study, for the first time, the deprojected radial profiles as a function of vertical height above the plane, which is only possible to explore with edge-on galaxies. Hence, this approach provides a unique opportunity to give additional constraints on theories explaining the origin of the various types of observed profiles in the context of disk formation and evolution.
In this context, we find a generic flattening of the observed profiles in the inner disk region with increasing distance from the plane, which cannot be explained by dust extinction. This implies a more complex vertical structure in the inner region than a single disk. It is possible to explain this flattening by introducing a thick disk with systematically larger scalelength compared to that of its host thin disk.
In the outer disk, beyond the break radius, we find an enhanced flattening of the deprojected profiles, which again sets strong constraints on theories that attempt to explain the observed broken exponential structures. Using some toy models we conclude that thin plus thick disk combinations are, in principle, able to explain the observed structures. However, the details of this combination depend on the exact shape of the outer region of the thick disk. For example, a thick disk without truncation will exhibit less flattening in the outer disk than a thick disk with truncation. So far our data does not allow us to decide if thick disks are in general truncated or not. It remains unclear whether one can fine tune a simple model with broken exponential thin plus thick disks in order to explain the observed brightness distribution.
In addition, we find that the location of the break radius does not change significantly as a function of in the first two to three -slices. Unfortunately the flattening of the radial profile beyond the first few vertical cuts makes it hard to determine the location of the break radius. Although we do not know yet whether thick disks are indeed truncated, we have shown that the vertical structure harbours clues to understand the origin of the different radial profiles and should be pursued. For example, luminous, not-truncated thick disk components could be responsible for the high frequency of not-truncated lenticular galaxies in face-on surveys, while having a broken exponential structure close to the midplane of the galaxy.
In conclusion, observations of the vertical structure set strong constraints on modelling/simulating disk galaxies and the interpretation of their various components. In the future, a larger, well selected sample of edge-on galaxies will be analysed in order to shed light on some of the issues raised here.
acknowledgements
The authors wish to thank Simone Bianchi, who kindly provided us with dusty-galaxy images produced with his radiative transfer code. We thank Olof van den Berg for using the reduced K′-band image of NGC 5290. The authors thank P. van der Kruit, R. Sancisi, M. Verheijen, and E. Valentijn for helpful discussions, and the anonymous referee for his detailed and very helpful comments. Part of this work was supported by a Marie Curie Intra-European Fellowship within the 6th European Community Framework Programme. This research has made use the Lyon/Meudon Extragalactic Database (LEDA, http://leda.univ-lyon1.fr) and the NASA/IPAC Extragalactic Database (NED) which is operated by the Jet Propulsion Laboratory, California Institute of Technology, under contract with the National Aeronautics and Space Administration. This research has made use of NASA’s Astrophysics Data System Bibliographic Services.
References
- Bertin & Arnouts (1996) Bertin, E., & Arnouts, S. 1996, A&AS, 117, 393
- Bahcall & Kylafis (1985) Bahcall, J. N., & Kylafis, N. D. 1985, ApJ, 288, 252
- Balcells et al. (2003) Balcells, M., Graham, A. W., Domínguez-Palmero, L., & Peletier, R. F. 2003, ApJL, 582, L79
- Barteldrees & Dettmar (1994) Barteldrees, A., & Dettmar, R.-J. 1994, A&AS, 103, 475
- Bianchi, Ferrara, & Giovanardi (1996) Bianchi S., Ferrara A., Giovanardi C., 1996, ApJ 465, 127
- Binney, Davies & Illingworth (1990) Binney, J. J.,Davies, R. L., & Illingworth, G. D. 1990, ApJ, 361, 78
- Binney & Tremaine (1987) Binney, J. J., Tremaine, S., Galactic dynamics. Princeton, NJ, Princeton University Press
- Byun (1998) Byun, Y. -I. 1998, Chinese Journal of Physics, 36, 677
- Chung et al. (2006) Chung, A., Koribalski, B., Bureau, M., & van Gorkom, J. H. 2006, MNRAS, 370, 1565
- Dalcanton & Bernstein (2002) Dalcanton, J. J., & Bernstein, R. A. 2002, AJ, 124, 1328
- Debattista et al. (2006) Debattista, V. P., Mayer, L., Carollo, C. M., Moore, B., Wadsley, J., & Quinn, T. 2006, ApJ, 645, 209
- Daubechies (1988) Daubechies I., 1988, Comms. Pure Appl. Math., 41, 909
- Dehnen & Gerhard (1993) Dehnen, W., & Gerhard, O. E. 1993, MNRAS, 261, 311
- Dehnen & Gerhard (1994) Dehnen, W., & Gerhard, O. E. 1993, MNRAS, 268, 1019
- de Grijs (1998) de Grijs, R. 1998, MNRAS, 299, 595
- de Grijs & Peletier (1997) de Grijs, R., & Peletier, R. F. 1997, A&A, 320, L21
- de Grijs et al. (2001) de Grijs, R., Kregel, M., & Wesson, K. H. 2001, MNRAS, 324, 1074
- de Vaucouleurs (1959) de Vaucouleurs, G. 1959, Handbuch der Physik, 53, 311
- de Vaucouleurs et al. (1991) de Vaucouleurs, G., de Vaucouleurs, A., Corwin, H.G., Buta, R.J., Paturel, G., & Fouque, J.B. 1991, Third reference catalogue of bright galaxies, Springer-Verlag New York
- de Zeeuw (2007) de Zeeuw, T., 2007, Astrophysics and Space Science Proceedings, Springer (Dordrecht), Vol. 3, 571, “Island universes: structure and evolution of disk galaxies”, R.S. de Jong (ed.)
- Donoho (1992) Donoho D.L., Stanford University Dept. of Statistics, 1992
- Donoho & Johnstone (1994) Donoho D.L., Johnstone I.M.,w Biometrika 1994,81,425
- Du et al. (2006) Du, C., Ma, J., Wu, Z., & Zhou, X. 2006, MNRAS, 372, 1304
- Elmegreen & Hunter (2006) Elmegreen, B. G., & Hunter, D. A. 2006, ApJ, 636, 712
- Erwin et al. (2005) Erwin, P., Beckman, J.E., & Pohlen, M. 2005, ApJL, 626, 81
- Erwin et al. (2006) Erwin, P., Pohlen, M., & Beckman, J.E. 2006, in prep.
- Fabricant et al. (1984) Fabricant, D., Rybicki, G., & Gorenstein, P. 1984, ApJ, 286, 186
- Ferguson et al. (2006) Ferguson, A., Irwin, M., Chapman, S., Ibata, R., Lewis, G., & Tanvir, N. 2006, astro-ph/0601121
- Florido et al. (2001) Florido, E., Battaner, E., Guijarro, A., Garzón, F., & Jiménez-Vicente, J. 2001, A&A, 378, 82
- Florido et al. (2006) Florido, E., Battaner, E., Guijarro, A., Garzón, F., & Castillo-Morales, A. 2006, A&A, 455, 467
- Freedman et al. (2001) Freedman, W.L. et al. (some 14 other authors) 2001, ApJ, 553, 47
- Freeman (1970) Freeman K.C. 1970, ApJ, 160, 811
- Freeman & Bland-Hawthorn (2002) Freeman, K., & Bland-Hawthorn, J. 2002, ARA&A, 40, 487
- Gerhard & Binney (1996) Gerhard, O., & Binney, J. 1996, MNRAS, 279, 993
- Governato et al. (2007) Governato, F., Willman, B., Mayer, L., Brooks, A., Stinson, G., Valenzuela, O., Wadsley, J., & Quinn, T. 2007, MNRAS, 374, 1479
- Gyuk et al. (1999) Gyuk, G., Flynn, C., & Evans, N. W. 1999, ApJ, 521, 190
- Hamabe & Wakamatsu (1989) Hamabe, M., & Wakamatsu, K.-I. 1989, ApJ, 339, 783
- Holley-Bockelmann & Mihos (2001) Holley-Bockelmann, J. K., & Mihos, J. C. 2001, Bulletin of the American Astronomical Society, 33, 798
- Hunter & Elmegreen (2006) Hunter, D. A., & Elmegreen, B. G. 2006, ApJS, 162, 49
- Hunter et al. (2006) Hunter, D. A., Elmegreen, B. G., & Martin, E. 2006, AJ, 132, 801
- Jensen & Thuan (1982) Jensen, E.B., & Thuan, T.X. 1982, ApJS, 50, 421
- Kregel (2003) Kregel, M. 2003, PhD Thesis, University Groningen
- Kregel et al. (2002) Kregel, M., van der Kruit, P. C., & de Grijs, R. 2002, MNRAS, 334, 646
- Lauberts (1982) Lauberts, A. 1982, ESO/Uppsala Survey of the ESO(B) atlas, Garching: European Southern Observatory (ESO)
- Li et al. (2006) Li, Y., Mac Low, M.-M., & Klessen, R. S. 2006, ApJ, 639, 879
- Lucy (1974) Lucy, L. 1974, AJ, 79, 745
- Matthews (2000) Matthews, L. D. 2000, AJ, 120, 1764
- Möllenhoff et al. (2006) Möllenhoff, C., Popescu, C. C., & Tuffs, R. J. 2006, A&A, 456, 941
- Näslund & Jörsäter (1997) Näslund, M., & Jörsäter, S. 1997, A&A, 325, 915
- Nelder & Mead (1965) Nelder, J.A., and Mead, R. 1965, Computer Journal, vol. 7, 308
- Patterson (1940) Patterson, F. S. 1940, Harvard College Observatory Bulletin, 914, 9
- Pérez (2004) Pérez, I. 2004, A&A, 427, L17
- Pohlen (2001) Pohlen, M., 2001, Ph. D. Thesis, Ruhr-University Bochum, Germany
- Pohlen & Trujillo (2006) Pohlen, M., & Trujillo, I. 2006, A&A, 454, 759
- Pohlen et al. (2000a) Pohlen, M., Dettmar, R.-J., Lütticke, R. 2000a, A&A, 357, L1
- Pohlen et al. (2000b) Pohlen, M., Dettmar, R.-J., Lütticke, R., & Schwarzkopf, U. 2000b, A&AS, 144, 405
- Pohlen et al. (2002a) Pohlen, M., Dettmar, R.-J., Lütticke, R., & Aronica, G. 2002, A&A, 392, 807
- Pohlen et al. (2002b) Pohlen, M., Dettmar, R. J., Lütticke, R., & Aronica, G. 2002, ASP Conf. Ser. 275: Disks of Galaxies: Kinematics, Dynamics and Peturbations, 275, 15
- Pohlen et al. (2003) Pohlen, M., Balcells, M., Lütticke, R., & Dettmar, R.-J. 2003, A&A, 409, 485
- Pohlen et al. (2004a) Pohlen, M., Beckman, J. E., Hüttemeister, S., Knapen, J. H., Erwin, P., & Dettmar, R.-J. 2004a, Penetrating Bars Through Masks of Cosmic Dust, 713
- Pohlen et al. (2004b) Pohlen, M., Balcells, M., Lütticke, R., & Dettmar, R.-J. 2004b, A&A, 422, 465
- Prugniel & Heraudeau (1998) Prugniel, P., & Heraudeau, P. 1998, A&AS, 128, 299
- Rybicki (1987) Rybicki, G. B. 1987 in Structure and Dynamics of Elliptical Galaxies, IAU Symp. 127, ed. de Zeeuw, P. T., Kluwer, Dordrecht, 397
- Sandage & Tammann (1980) Sandage, A., & Tammann, G.A. 1980, A Revised Shapley-Ames Catalog of Bright Galaxies, Washington: Carnegie Institution
- Sasaki (1987) Sasaki, T. 1987, PASJ, 39, 849
- Schlegel et al. (1998) Schlegel, D. J., Finkbeiner, D. P., & Davis, M. 1998, ApJ, 500, 525
- Siegel et al. (2002) Siegel, M. H., Majewski, S. R., Reid, I. N., & Thompson, I. B. 2002, ApJ, 578, 151
- Tamm & Tenjes (2006) Tamm, A., & Tenjes, P. 2006, A&A, 449, 67
- Trujillo & Pohlen (2005) Trujillo, I., & Pohlen, M. 2005, ApJL, 630, L17
- Tsikoudi (1980) Tsikoudi, V. 1980, ApJS, 43, 365
- van den Berg et al. (2006) van den Berg, O. et al. 2006, in prep.
- van der Kruit (1979) van der Kruit, P. C., 1979, A&AS, 38, 15
- van der Kruit & Searle (1981) van der Kruit, P. C., & Searle, L. 1981, A&A, 95, 105
- Wakamatsu & Hamabe (1984) Wakamatsu, K.-I., & Hamabe, M. 1984, ApJS, 56, 283
- Weinberg (2001) Weinberg, M. D. 2001, ASP Conf. Ser. 231: Tetons 4: Galactic Structure, Stars and the Interstellar Medium, p. 53
- Wozniak (1994) Wozniak, H. 1994, A&A, 286, L5
- Xilouris et al. (1999) Xilouris E.M., Byun Y.I., Kylafis N.D., Paleologou E.V., Papamastorakis P., 1999, A&A, 344, 868
- Yoachim & Dalcanton (2006) Yoachim, P., & Dalcanton, J. J. 2006, AJ, 131, 226
- Zaroubi & Goelman (2000) Zaroubi S., Goelman G., 2000, Magnetic Resonance Imaging, 18, 59
- Zaroubi et al. (1998) Zaroubi S., Squires G., Hoffman Y., & Silk J., 1998, ApJ, 500, L87
- Zaroubi et al. (2001) Zaroubi, S., Squires, G., de Gasperis G., Evrard A. E., Hoffman Y., & Silk J., 2001, ApJ, 561, 600
Appendix A Notes on individual galaxies
ESO 380-019:
Owing to a not well defined thick patchy dust
lane the inclination is uncertain (clearly not 90∘, but closer to
85∘). The extent and size of the bulge component is also uncertain. The
major axis radial profile shows a broken exponential structure with a break at
″ ( mag ). The galaxy is moderately asymmetric. In the
contour map the SE(left)-side is obviously shorter.
The single disk fit by Pohlen (2001) yields a vertical scaleheight
of , a radial scalelength of , and an
inclination of .
The face-on-equivalent profile of ESO 380-019 is well described as a
Type II with an inner shallow exponential (of
) and an outer steeper exponential
() with a break at a radial distance of
and a surface brightness of
V-mag .
We find an increase in scalelength of between the major
axis and about 5 times the vertical scaleheight (at 18″) in
the inner disk region. Since the galaxy is rather far from edge-on,
the extended dustlane (with maximum extinction at )
could still play a role (cf. Fig. 3).
The scalelength beyond the break in the outer disk increases
by a factor of 2.5 between and .
ESO 404-018:
This galaxy shows hardly any bulge component.
The disk structure is quite knotty and appears bended like a wave
(Weinberg, 2001) in addition to being slightly u-shaped at the edges. The
radial surface brightness profile shows quite clearly the deviation from a
simple not-truncated exponential model on both sides with a sharp break on the
NE(left)-side, and a smoother one on the SW(right)-side starting at
″ and is well fitted by a broken exponential.
The single disk fit by Pohlen (2001) yields a vertical scaleheight
of , a radial scalelength of , and an
inclination of .
The face-on-equivalent profile of ESO 404-018 is well described as a
Type II with an inner shallow exponential (of
) and an outer steeper exponential
() with a break at a radial distance of and a surface brightness of
V-mag .
We find an increase in scalelength of between the major
axis and about 4 times the mean vertical scaleheight (at 11″)
in the inner disk region. Although this galaxy is almost perfectly
edge-on we still find the steepest profile on the major axis, so the
dust is not playing a major role here.
The shape of the profile in the outer disk is not well described with
a single exponential. The break regions (starting at ″)
seems to be extended and almost exponential itself.
This deviation from our simple broken exponential model strongly
affects the measurement of the scalelengths beyond the break.
FGC 2339:
This galaxy shows on both sides slightly
off-centered ring-, or bar-like knots at
) and ). The
underlying disk is quite asymmetric on both sides. The major axis
profile on the N(left)-side is satisfactorily fitted with a broken
exponential showing a break at ″ and mag . On the S(right)-side the profile looks
more like a sharply-truncated profile.
The single disk fit by Pohlen (2001) yields a vertical scaleheight
of , a radial scalelength of , and an
inclination of .
The face-on-equivalent profile of FGC 2339, beyond can
be described as a Type II with an inner shallow exponential (of
) and an outer steeper exponential
() with a break at a radial distance of and a surface brightness of
R-mag .
For this galaxy the whole inner region is
dominated by a ring or barlike structure which introduces an extreme
flattening of the profiles at 2 vertical scaleheights and above
(cf. van den Berg et al., 2006).
The small inner disk region in the range of does not show a clear systematic flattening towards higher
-cuts. The major axis profile is overall the flattest, so probably
heavily affected by the midplane dust. Nevertheless, there is a 19%
increase in scalelength between and .
The scalelength beyond the break in the outer disk increases
by a factor of 2.3 between .
IC 4871: (alternative name: IC 4872)
This galaxy is overall very patchy with many distinct ii regions.
On the S(right)-side, along the major axis at ″ there
is an unusually warped patch of star formation visible. The major axis
radial profile can be well described with a broken exponential with a
very steep outer decline (dropping by mag within
″) on both sides (with slightly different outer
slopes), starting at ″( mag ).
The single disk fit by Pohlen (2001) yields a vertical scaleheight
of , a radial scalelength of , and an
inclination of .
The face-on-equivalent profile of IC 4871 is well described as a
Type II with an inner shallow exponential (of
) and an very steep outer exponential
() with a break at a radial distance of and a surface brightness of
V-mag .
We find an increase in scalelength of between the major axis
and about times the mean vertical scaleheight (at 8″) in the inner
region.
The scalelength beyond the break in the outer disk increases
by a factor of 1.7 between .
NGC 522:
Our image has some residual structure in the
flatfield which reaches the disk on the SW(right)-side at
) and at )
causing the unusually shaped contours.
There is a galaxy cluster in the background with an edge-on
spiral galaxy superimposed at )
and another elliptical at ).
The major axis radial profile shows a clear broken exponential
behaviour with a very steep outer decline (dropping by
mag within ″) on both sides,
starting at ″ ( mag ).
Even the edge-on profiles show clearly a decrease in the outer slope
with increasing (see below). The galaxy is slightly asymmetric with
the NE(left)-side shorter than the SW(right)-side.
The single disk fit by Pohlen (2001) yields a vertical scaleheight
of , a radial scalelength of , and an
inclination of .
The face-on-equivalent profile of NGC 522 is well described as a
Type II with an inner shallow exponential (of
) and an very steep outer exponential
() with an ‘early’ break at a radial distance of
and a surface brightness of
R-mag .
The major axis profile is overall the flattest, so probably heavily
affected by the midplane dust. We find only a marginal increase in
scalelength of between and times the mean
vertical scaleheight (between ″) in the inner region.
The scalelength beyond the break in the outer disk increases
by a factor of 1.8 between .
NGC 1596:
See Pohlen et al. (2004b) for additional notes.
The face-on-equivalent profile of NGC 1596 is classified as Type III,
i.e., a break with an upbending profile beyond. However, the profile is
not well described by a simple broken exponential. The whole disk
profile (beyond ″) appears to be almost continuously
upbending. One may argue for an extended, exponential break region
between breaks at ″ and ″.
Therefore, the exact position of the break is unclear.
Judging from the individually deprojected cuts this structure is
driven by the clear upbending breaks on the major axis and at
″ at a radial distance of ″.
All cuts at larger distance from the plane (″)
are consistent with having no break.
We find an increase in scalelength by a factor of 3.6 from the major
axis (steepest) to a vertical scaleheight of 33″ (flatter) in
the inner region.
NGC 3390:
There is a nearby, low surface brightness
companion, of unknown distance, visible at
) and another unusually small and
round object at ″ on the major axis.
This galaxy exhibits a quite unusual appearance. The inner high surface
brightness part looks like a normal edge-on Sb galaxy with a well
defined dust-lane. However, the outer low surface brightness part
shows that the galaxy is embedded in a huge spheroidal envelope much more
like an S. The galaxy was already classified as an S-a by
Lauberts (1982) and S? by Sandage & Tammann (1980), whereas de Vaucouleurs et al. (1991) and
Prugniel & Heraudeau (1998) quote Sb or Sbc.
The radial profiles close to the major axis, similar to other
S galaxies, decline almost straight into the noise with only
a mild break at ″ in cuts higher
above the plane. This structure makes it impossible to fit
a sharply truncated or broken exponential model.
Even the edge-on profiles show clearly a decrease in the outer slope
with increasing z (see below).
The face-on-equivalent profile of IC 3390 is reasonably well
described as a Type I (see discussion in main text, Section 4.1).
For NGC 3390 we find an increase in scalelength by a factor of 3.1 between
the major axis (steepest) and a vertical distance of 26″ (flatter) in
the inner disk region as expected from the S envelope.
A scaleheight of , measured in the I-band by de Grijs (1998),
is used in Fig. 6 and Fig. 7.
NGC 4179:
See Pohlen et al. (2004b) for additional notes.
We find that the face-on-equivalent profile of NGC 4179 is well
described as a Type II with an inner shallow exponential (of
) and an outer slightly steeper
exponential () with a break at a radial distance of
and at a surface brightness of
V-mag .
In the inner disk we find an increase in scalelength of 36%
between the major axis and times the thin disk scaleheight
() reported by Pohlen et al. (2004b). Overall the
scalelength increases by a factor of 1.8 to the highest measured
cut at .
This is very similar to the factor of 1.9 reported by
Pohlen et al. (2004b) for the ratio of thick to thick disk scalelength,
obtained with a completely different method (3D model fitting).
Their thin disk scalelength of is almost identical
to our scalelength of at the major axis. Our scalelength of
for the vertical cut with the largest distance from
the plane (at ″) is smaller
compared to their thick disk scalelength of ″, which
we may reach for cuts even higher above.
NGC 5290:
The inner disk is embedded in an outer,
clearly thicker disk component or in a low surface brightness
extension of the bulge. The galaxy exhibits a thick and patchy
dustlane, and the two sides are rather asymmetric. In the contour map
the E(left)-side seems to be thicker and shorter, whereas the
W(right)-side is longer and tapers off.
This asymmetry is reflected in the major axis radial profile. When
fitted with a broken exponential structure, the slope of the outer
region on the E(left)-side is much steeper compared to the
W(right)-side. The latter seems to be almost ″ ‘longer’.
The single disk fit to the R-band image by Pohlen (2001) yields a
vertical scaleheight of , a radial scalelength of
, and an inclination of .
The face-on-equivalent profile of NGC 5290 is in both bands (R and
K′) well described as a Type II with an inner shallow exponential (of
in R and
in K′) and an outer steeper
exponential ( in R and in K′).
The break radius is at a similar radial distance ( in R, and in K′) and at a surface brightness of
R-mag and K′-mag respectively.
In the K′-band, the scalelength of the major axis in the inner disk region is
the flattest compared to all other vertical cuts above (see
Fig. 5). For the R-band it is almost as flat as the scalelength
at a distance of 4 times the vertical scaleheight.
We observe a systematic decrease in scalelength in both bands up to a
vertical distance of , after which the scalelength
starts to rise again for the deeper R-band image out to the highest
vertical cut at .
If this is not an intrinsic feature of NGC 5290 one could argue that the dust
may still influence the scalelength determination even in the NIR
band. However, quantitatively this seems very unlikely since the amount of
dust inferred from the K′-band flattening should have a more severe effect on
the R-band profile.
In the deeper optical image the scalelength increases by 26%
between and vertical scaleheight.
In the R-band the scalelength beyond the break in the outer disk
increases by a factor of 1.5 between .
NGC 5981:
There is a possible dwarf elliptical
companion visible at ), and another
companion superimposed on the disk at ).
For both we have no velocity information, but there is another
large elliptical nearby (NGC 5982, ′ away with km s-1 ).
NGC 5981 is slightly disturbed and asymmetric. The inner disk is
∘ tilted against the outer disk and the bulge component
is furthermore slightly tilted against the inner disk.
This asymmetry is reflected in the radial profiles. The outer slope
of a broken exponential fit is significantly shallower on the
NW(right)-side, where also the contour map is more extended.
The single disk fit by Pohlen (2001) yields a vertical scaleheight
of , a radial scalelength of , and an
inclination of .
The face-on-equivalent profile of NGC 5981 is well described as a
Type II with an inner shallow exponential (of
) and an outer steeper exponential
() with a break at a radial distance of
and at a surface brightness of
R-mag .
We find an increase in scalelength of between the major
axis and about 3.6 times the mean vertical scaleheight
(at 15″) in the inner region.
Using only the two quadrants from the dust free side for
averaging (in opposite to all four) this increase in scalelength
for the inner disk grows to .
In this case – as expected from the model fits (cf. Fig3) – the scalelength on the major axis is less affected
by the dust, so smaller, whereas the scalelength at 3.6 vertical
scaleheights is almost identical ( for the mean quadrant
versus for the dust free part).
The scalelength beyond the break in the outer disk increases by a
factor of 1.4 between in our mean quadrant.
Owing to the described asymmetries in the disk on both sides this
galaxy is well suited to study their effects on the deprojected
profiles.
Fitting only a mean quadrant obtained from the NW(right)- or
SE(left)-side of the galaxy separately we find differences of
% for the scalelengths of the inner region. In the outer disk
(beyond the break) the differences are clearly larger, e.g., 40% on the
major axis, due to the obvious asymmetry.
UGC 10459:
This galaxy has only a very small bulge
component. There is a possible background galaxy, with unknown
distance, visible at ).
The major axis profile shows an obvious broken exponential structure
with a break radius at ″ ( mag ) separating a shallow inner and a
steeper outer slope.
The single disk fit by Pohlen (2001) yields a vertical scaleheight
of , a radial scalelength of , and an
inclination of .
The face-on-equivalent profile of UGC 10459 is well described as a
Type II with an inner shallow exponential (of
) and an outer rather steep
exponential () with a break at a radial distance of
and at a surface brightness of
R-mag .
We find an increase in scalelength of between the major
axis and about times the vertical scaleheight (at 11″) in
the inner disk region.
The scalelength on the major axis is slightly larger compared to
scalelength of the cut at , which is well explained by
the influence of the dust.
The scalelength beyond the break in the outer disk increases
by a factor of 2.2 between .
| Galaxy | Filter | Profile | cut | ||||||||
|---|---|---|---|---|---|---|---|---|---|---|---|
| type | [″] | [″] | [″] | [″] | [″] | [″] | [ ] | [ ] | [mag ] | ||
| (1) | (2) | (3) | (4) | (5) | (6) | (7) | (8) | (9) | (10) | (11) | (12) |
| ESO 380-019 | V | II | foe | 12 | 117 | 87.6 | 27.9 | 11.5 | 3.1 | 2.4 | 22.9 |
| ESO 380-019 | V | II | 0 | 12 | 117 | 93.7 | 26.1 | 8.6 | 3.6 | 3.0 | 27.4 |
| ESO 380-019 | V | II | 6 | 12 | 117 | 86.9 | 28.8 | 10.5 | 3.0 | 2.7 | 27.4 |
| ESO 380-019 | V | II | 12 | 0 | 117 | 77.4 | 30.4 | 14.2 | 2.6 | 2.1 | 28.1 |
| ESO 380-019 | V | II | 18 | 10 | 117 | 65.4 | 32.7 | 21.5 | 2.0 | 1.5 | 29.1 |
| ESO 380-019 | V | I | 23 | 10 | 90 | 34.9 | |||||
| ES0 404-018 | V | II | foe | 0 | 92 | 75.6 | 34.0 | 9.6 | 2.2 | 3.6 | 24.6 |
| ES0 404-018 | V | II | 0 | 0 | 92 | 72.4 | 31.1 | 9.0 | 2.3 | 3.5 | 28.0 |
(1) Principal name, (2) filter, (3) profile type (I: no break, II: downbending break, III: upbending break), (4) vertical position of the deprojected slices (‘feo’ means the face-on-equivalent profile), (5,6) inner and outer fitting boundaries, (7,8,9) break radius, inner, and outer scalelength in units of arcsec, (10) break radius in relation to the inner scalelength, (11) inner scalelength in relation to the outer scalelength, (12) the surface brightness at the break radius (estimated at the crossing point of the two exponential fits. The full version of this table is available online.
Appendix B Figures
The following figures show radial surface brightness profiles and isophote maps for four galaxies per page (in alphabetical order). For the isophote map (lower panels) each galaxy is rotated to the major-axis. The magnitude of the outer contour (, defined by a 3 criterion of the background) is indicated in each plot. The consecutive contours are equidistant spaced by 0.5 mag. In the plot, the contour lines are drawn with increasing smoothing towards the outer parts. Note however that for the actual fitting a constant scale smoothing is used. For the inner contours out to where the noise begins to increase no smoothing was applied. The following 2-3 contours are smoothed by replacing each pixel by the mean of -pixels “around” the central pixel. For the outer two contours this smoothing is increased to -pixels. The upper panels displays the major-axis surface brightness profile (top, solid line) and two parallel radial profiles (lower, solid lines) each above and below the major axis. The exact vertical positions () for the plotted profiles are indicated in the upper right corner of the plot. In some cases the best fit, sharply truncated, single disk model obtained by Pohlen (2001) is overplotted (dashed line).