GRO J1744-28, search for the counterpart: infrared photometry and spectroscopy
Abstract
Using VLT/ISAAC, we have detected 2 candidate counterparts to the bursting pulsar GRO J 1744-28, one bright and one faint, both within the X-ray error circles found using XMM-Newton and Chandra. In determining the spectral types of the counterparts we applied 3 different extinction corrections; one for an all-sky value, one for a Galactic Bulge value and one for a local value. We find that the local value, with an extinction law of is the only correction that results in colours and magnitudes for both the bright and faint counterparts that are consistent with a small range of spectral types, and in the case of the bright counterpart are also consistent with the spectroscopic identification. Photometry of the fainter candidate then indicates it is a K7/M0 V star at a distance of . Such a star would require a very low inclination angle () to satisfy the mass-function constraints; however this source cannot be excluded as the counterpart without follow-up spectroscopy to detect emission signatures of accretion. Photometry and spectroscopy of the bright candidate indicate that it is most likely a G/K III star. The spectrum does not show Brackett- emission, a known indicator of accretion. The bright star’s magnitudes are in agreement with the constraints placed on the probable counterpart by the calculations of Rappaport & Joss (1997) for an evolved star that has had its envelope stripped. The mass-function indicates the most likely counterpart has for an inclination of ; a stripped giant, or a main sequence M3+ V star would be consistent with this mass-function constraint. In both cases mass-transfer, if present, will be by wind-accretion as the counterpart will not fill its Roche lobe given the observed orbital period. In this case, the derived magnetic field strength of G is sufficient to inhibit accretion of captured material by the propeller effect, hence the quiescent state of the system.
keywords:
pulsars: individual (GRO J 1744-28) – X-rays: binaries – infrared: stars1 Introduction
The Bursting Pulsar GRO J 1744-28, was discovered with the Burst and Transient Source Experiment (BATSE) on the Compton Gamma-Ray Observatory (CGRO) on December 1995 (Fishman et al., 1995; Kouveliotou et al., 1996) during a period of outburst. GRO J 1744-28 was only the second system (after the Rapid Burster MXB 1730-335) to exhibit Type-II X-ray bursts. GRO J 1744-28 displays properties of both a pulsar and a Type-II burster, making it a unique source for studying the properties of accretion onto neutron stars (NS) and the interaction of magnetic fields with accretion flows.
Finger et al. (1996) detected coherent X-ray pulsations with a period of 467 ms. The pulsation rate increased during their observations at a rate of Hz s-1. They were able to determine the orbital period of the system to be days by fitting pulse phases. Determining through phase shifting, which is a result of Doppler shifts of the pulse period due to orbital motion indicates that it is unlikely that the system is face-on. These measurements indicate that the system consists of a magnetised NS with a magnetic field G (Giles et al., 1996; Lewin et al., 1996), and that the accretion is spinning up the NS. Cui (1997) also measured the pulsations of GRO J 1744-28 and was able to derive a magnetic field strength of , assuming that the source was entering the propeller regime at the end of its phase of outburst.
The system has undergone two periods of outburst; one lasting from December 1995 until April 1996, the second lasting from December 1996 until April 1997 (Woods et al., 1999). During these periods of outburst, hard X-ray bursts were initially observed with durations typically between 8 and s, and a frequency of per hour, falling to per hour after 1 day (Woods et al., 1999). It is believed that such outbursts are caused by instabilities in the accretion disc, leading to short intervals of increased accretion onto the surface of the NS (Lewin et al., 1996).
In 2001, GRO J 1744-28 was in a quiescent state with a very low level of X-ray emission. Its luminosity was measured to be erg s-1 with Chandra (assuming the source is near the Galactic Centre (GC) at a distance of ; Wijnands & Wang, 2002). More recently, Muno et al. (2007) re-observed GRO J 1744-28. Its luminosity was measured to be erg s-1, indicating increased activity from the X-ray source. These measurements are within the observed range of quiescent X-ray transients which exhibit luminosities of erg s-1 in these bands.
In this paper we describe the characteristics of two astrometrically selected candidate counterparts to the X-ray source and find that both are unlikely to be the true counterpart. From this we derive constraints as to the structure and composition of the binary system GRO J 1744-28.
2 Position
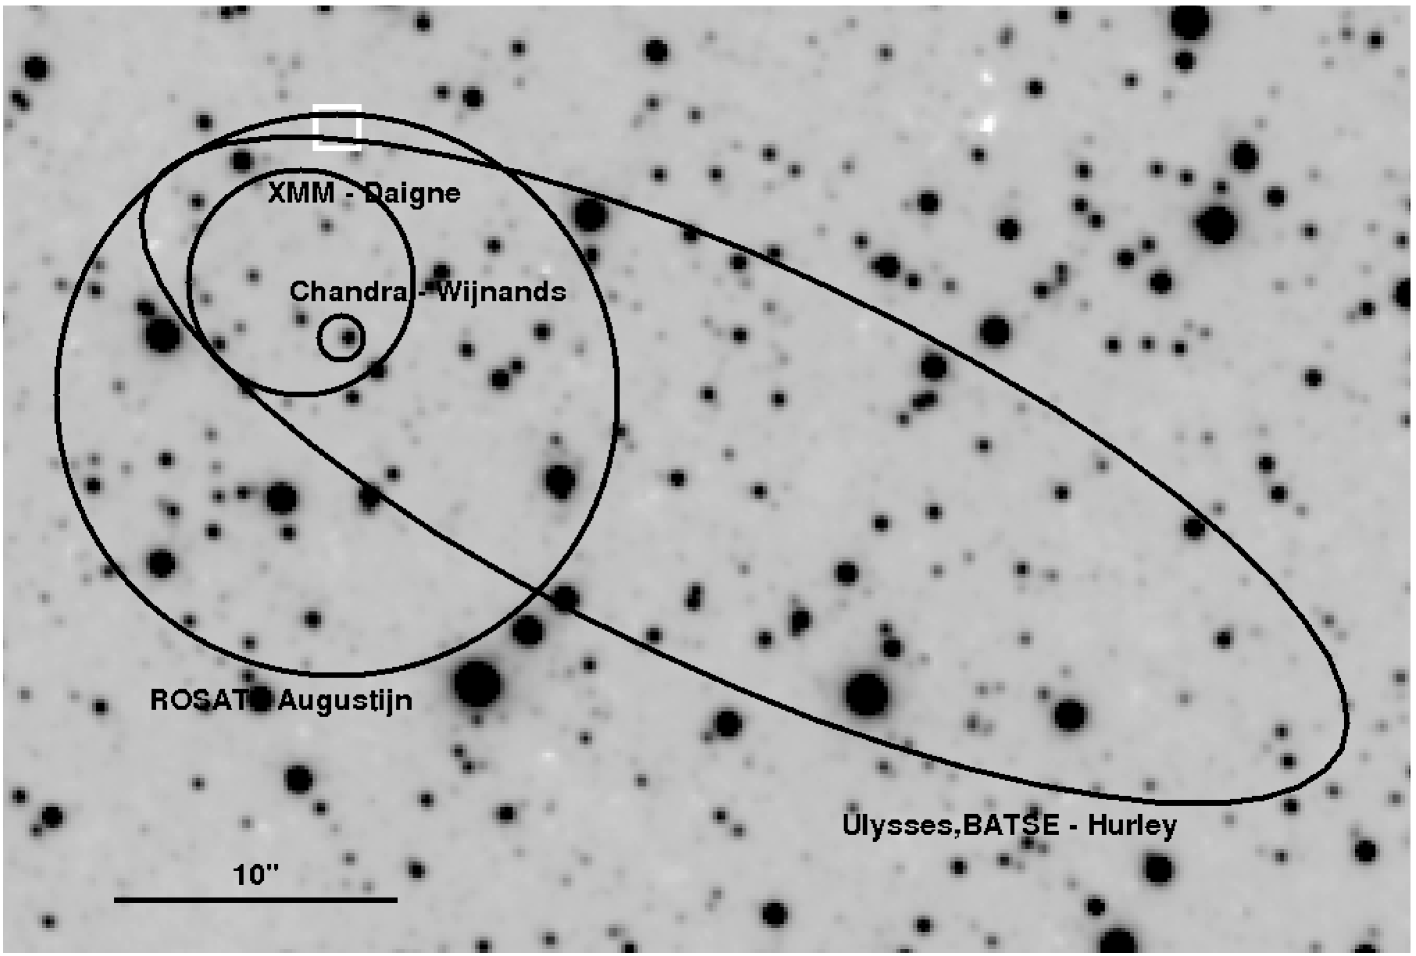
The accuracy of the measured position of GRO J 1744-28 has improved drastically over time as the astrometric precision of X-ray telescopes has improved. Initially, the position was only available with an error radius of at (Fishman et al., 1995). However, this was quickly refined and as new instruments and techniques were developed GRO J 1744-28 has been revisited many times. The positional error has been a critical issue for those searching for the stellar counterpart to GRO J 1744-28, as the GC has a very high stellar density, with an average stellar separation ″ in the -band at a magnitude limit of (Gosling et al., 2006). The current best measurement of the X-ray position is that of Wijnands & Wang (2002), obtained using Chandra.
Cole et al. (1997) and Augusteijn et al. (1997) announced the discovery of an optical/near-infrared counterpart candidate based on the ROSAT position for GRO J 1744-28. The positions reported by both groups were consistent within their errors. This counterpart was reported to show variability as it was present in only some of the observations for each telescope used. This candidate star was at the edge of the ROSAT error circle. More recently XMM-Newton (Daigne et al., 2002) and Chandra (Wijnands & Wang, 2002) observations of GRO J 1744-28 have shown that this variable star cannot be the counterpart to GRO J 1744-28 as these new, more accurate observations of the X-ray position are not coincident with the position of the previously proposed counterpart (see Fig. 1).
3 Data and Reduction
As part of a program of follow up study of the X-ray sources discovered by Wang et al. (2002), we have obtained IR imaging and spectroscopy of likely counterparts to the X-ray sources. The imaging is intended to select candidate counterparts astrometrically, and determine the colours of the general population of counterparts in comparison to the field population. To conclusively identify the counterparts to the X-ray sources, we are also undertaking a program of spectroscopic observations to identify accretion signatures in their spectra (Bandyopadhyay et al., 1997, 1999).
The observations of GRO J 1744-28 upon which this paper is based were were carried out in 2003 and 2005 during which period GRO J 1744-28 was assumed to be in quiescence based on X-ray luminosities measured by Chandra in 2001 and 2007 (Wijnands & Wang, 2002; Muno et al., 2007) and also the fact that no outbursts were detected by any of the X-ray all-sky monitors.

3.1 Imaging
In June and July of 2003, we observed 26 fields within the GC Chandra mosaic of Wang et al. (2002) using ISAAC, a pixel Hawaii Rockwell detector on the ESO VLT. This provides a field of view on the sky with resolution per pixel. One of these locations was chosen to cover the region containing GRO J 1744-28. This region was observed on the 26th July 2003. We obtained 6 minutes of exposure per pointing in each of the three near-IR bands, , and , on nights with seeing ″. The average magnitude limits of the images are , and . The initial reduction (flat-fielding, removal of bad pixels, and sky subtraction) was performed with the ESO/ISAAC pipeline reduction software. These image products were then astrometrically locked to the Two Micron All-Sky Survey (2MASS) resulting in a positional uncertainty. Photometric calibration was first carried out using the VLT zero-points and observed photometric standards. The data were then compared to the 2MASS catalogue and a photometric offset was applied to transform the VLT system to the photometric system of 2MASS. Source positions and magnitudes were measured using SExtractor (version 2.3.2; see Bandyopadhyay et al., 2005, for further details). We then performed astrometric matching of the IR source positions to the X-ray source positions to identify possible counterparts to the X-ray sources.
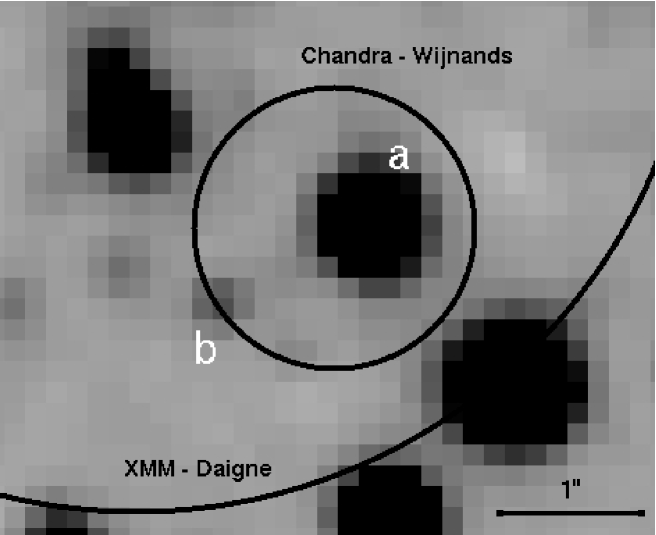
We detected two sources in all three bands within the error circle of the Chandra position for GRO J 1744-28. The position of the brighter of the two sources is , with a error. It has reddened magnitudes of , and . The position of the fainter of the sources is , with a error. It has reddened magnitudes of , and .
3.2 Spectroscopy
We obtained spectra for the candidate IR counterparts to 27 of the X-ray sources, identified in the imaging program described in Section 3.1. Spectra were obtained using the long slit mode on VLT/ISAAC with a 1″ slit-width, R = 450, in service mode in period 75 (April - September 2005). O and B type standard stars were observed for each spectrum. The spectra for the brighter of the two candidate counterparts to GRO J 1744-28 were obtained on the July and September, each with 120 s integrations, giving a total integration time on source of 240 s.
The spectra were reduced using the IRAF routine “apsum” to extract the 1 d spectra. Atmospheric lines were removed by dividing by the standard star spectra using the IRAF routine “telluric”. The spectra were observed on non-photometric nights to increase the chances of the observations being performed so no flux standards were observed, therefore they cannot be flux calibrated. The spectra have been normalised to 1 by dividing by the mean of the flux values. Identified lines and equivalent widths measured in the combined spectrum of the brighter candidate star are listed in Table 1, and the spectrum is shown in Fig. 2.
| Line | Width | |
|---|---|---|
| () | (Å) | |
| Na I (doublet) | ||
| Ca I (triplet) | ||
| Mg I | ||
| 12CO (2-0) | ||
| 12CO (3-1) | ||
| Fe I | ||
| 12CO (4-2) | ||
| 12CO (3-1) | ||
| 12CO (5-3) | ||
| 13CO (4-2) | ||
| 12CO (6-4) |
4 Extinction
The original, and generally applied, extinction law was calculated in the 1980’s using relatively primitive (by today’s standards) infrared detectors, using a small sample of individually selected stars whose spectral types were well known (Rieke & Lebofsky, 1985; Cardelli et al., 1989; Mathis, 1990; Catchpole et al., 1990). Based on this extremely small sample, they were able to express the near-infrared extinction law as “universal”, a fact that has been adopted in almost all studies since. However, in the last decade, as infrared detector technology has advanced, we have been able to obtain much higher-resolution, deeper surveys of the sky in the infrared band (2MASS, DENIS, UKIDSS, VISTA). Based on these observations, it has become evident that the extinction law is not the “universal” value that it was previously thought to be, but is in fact highly variable from point-to-point (Messineo et al., 2005; Nishiyama et al., 2006a; Fitzpatrick & Massa, 2007; Froebrich et al., 2007, and others). As we showed in Gosling et al. (2006), there is a high degree of spatial variation in the extincting material towards the Bulge, and we have also discovered that there is variation in the extinction law towards the Bulge (Gosling et al. in prep.). Fitzpatrick & Massa (2007) found that the Galactic extinction curve varies greatly from sight-line to sight-line and that any extinction curve will reflect biases in the local population. They also concluded that it is difficult to meaningfully characterise average extinction properties due to the sensitivity of the extinction to local conditions.
It is for this reason that in this paper we present extinction corrections, and the possible candidate counterpart properties that each imply, for the canonical value, a value determined by Nishiyama et al. (2006a) that deals specifically with the Galactic Bulge, and a more specific calculation based on the work of Gosling et al. (in prep.). We have presented all three so that the effect of the extinction correction on the determination of the spectral types of the candidate counterparts can be compared and to highlight the importance of making the correct extinction correction in the analysis of any source within this region. The derived extinction values are summarised in Table 2.
We show that only a specific, local extinction correction that takes into account the possibility for the extinction law to vary from the perceived universal value can produce consistent colours and magnitudes for both the bright and faint candidate counterparts, and that the results of this are entirely consistent with the possible spectral types derived from analysis of the spectrum of the brighter of the two candidate counterparts.
4.1 Canonical Value - all sky
Dotani et al. (1996a) measured the column density to GRO J 1744-28 to be for the persistent emission, and for the outbursts. Muno et al. (2007) measured the column density to be . Using the formula from Bohlin et al. (1978) we can convert the value for the persistent emission (since the source is not in a bursting period) to . This is close to the canonical value for extinction towards the Galactic Bulge of . Using the conversion factors from Rieke & Lebofsky (1985), this becomes , and .
4.2 Nishiyama Value - Galactic Bulge
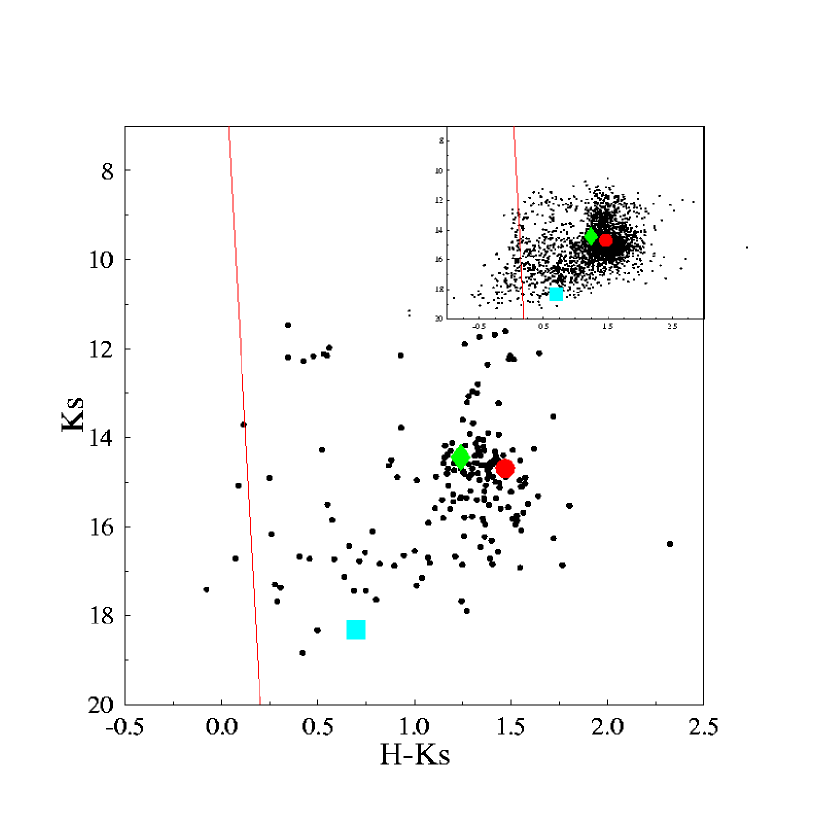
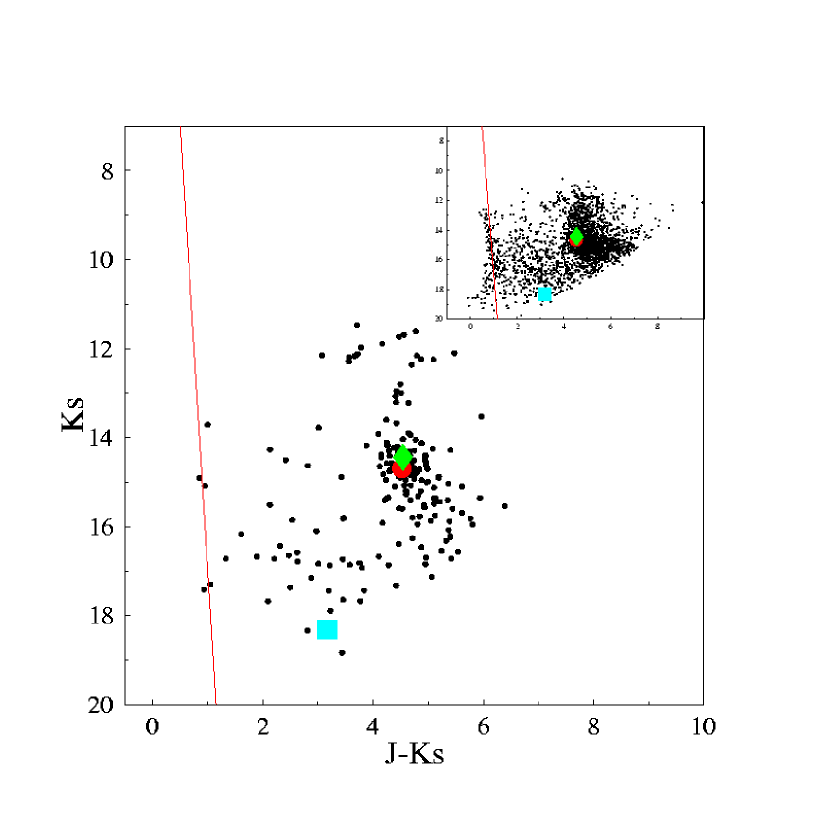
We extracted all the stars from within 20″ of the positions of the counterparts for which we had three-colour information, a total of 192 stars, in order to calculate the average colour excess for the counterparts. We obtained mean colours and magnitudes for the stars surrounding the candidate counterparts to GRO J 1744-28 of , and and , and . We obtained lines representing the foreground branch in each of the colour-magnitude diagrams (the population to the left of each diagram) by fitting the maximum in the colour distribution around the left hand population at different magnitudes for all the stars in the field (see Figures 3 and 4). Using this, we obtain the colour excesses to the stars surrounding the candidate counterparts to be , and . As the stellar population has the least spread in colour in the colour-magnitude plane, we will use the excess from this for calculating the absolute extinctions as it introduces the lowest error due to intrinsic scatter in the colour. The error in the determination of the colour excess in is .
Nishiyama et al. (2006a) analysed the stars of the Galactic Bulge and observed a variation in the relationship of extinction to wavelength across the quadrants of the North-East, North-West, South-East and South-West areas of the Bulge (with respect to Sgr A*). Extracting the red-clump stars from their data, and plotting their colours they were able to measure the extinction law values for these quadrants. GRO J 1744-28 lies in the quadrant they label N+, which has a measured slope for the extinction law of (), which equates to extinction relations of . Converting the colour-excess to absolute extinction with the formula
gives values of , and .
4.3 Gosling Value - local
We analysed the colour distribution of the stars in the field containing GRO J 1744-28, using the same stars extracted for the Galactic Bulge extinction calculation (see Section 4.2) and using a method we have developed for correction of our own VLT data (Gosling et al. in prep.), similar to that of Froebrich & del Burgo (2006) we were able to extract the slope of the extinction law for this specific region. Using the ratio of the mean colours for the 192 stars within 20″of GRO J 1744-28, we used the formula
and its permutations to obtain a value of for , and .
Calculating the extinction law for all three colour-colour ratios gave a value of in each case, which equates to extinction relations of . Converting the colour-excess to extinction as in the Galactic Bulge case gives , and , all substantially lower than implied by the other methods (with the exception of the value found for the Galactic Bulge extinction scenario).
| all-sky | 7.98 | 4.95 | 3.20 | |
|---|---|---|---|---|
| Galactic Bulge | 4.58 | 2.70 | 1.57 | |
| local | 4.60 | 1.93 | 0.79 |
5 Bright star
5.1 Star Properties
Using the extinction values found in Section 4 and summarised in Table 2, we can determine for each case the possible spectral types and luminosity classes of the bright candidate counterpart. The results, which we now go on to discuss in detail, are summarised in Table 3.
5.1.1 Corrected for all-sky extinction
Correcting for the all sky extinction values, the intrinsic magnitudes of the bright source become , and which gives colours of , and . The colour is inconsistent with any spectral type, indicating that there is either an error with the photometry, or with the extinction correction (see Section 7 for discussion of this).
Within the errors, the colour is consistent with an O-F V/I star, and the colour is consistent with O-B4 V/I stars.
Correcting for a Galactic Centre distance of (Nishiyama et al., 2006b), the magnitudes correspond to B0 V or K5/M0 III stars (Cox, 2000).
A supergiant at the GC would appear 3–4 magnitudes brighter than observed, or would have to be on the far side of the Bulge for its apparent magnitude to be that observed. The colours are not consistent with a giant star, so the candidate counterpart cannot be the K5/M0 III star that is a possible match to the magnitudes. Only a B0 V star is consistent with all the magnitudes and the and colours. The colour is not consistent with any spectral type.
5.1.2 Corrected for Galactic Bulge extinction
Using the Galactic Bulge extinction values from Section 4.2, the intrinsic magnitudes of the bright source are , and , giving the bright star colours of , and .
Of the colours, only the is a realistic value for a star, however, within the error bounds, all spectral types are possible (Cox, 2000). Both the and colours are too large for any spectral types, even at the limits of their errors. This indicates that the magnitude is too faint (see Section 7 for further on this).
Taking the colour to be correct, the most probable spectral types for this candidate include G8 I, K1 III and K4/5 V (Cox, 2000).
As the -band magnitude seems to be too faint, we will only use the and magnitudes of the star, which for a Galactic Centre distance of (Nishiyama et al., 2006b) correspond to a G6-K1 III or B2-4 V (Cox, 2000).
As with the all-sky correction, the supergiant type star consistent with the colours would be 3–4 magnitudes brighter than observed if it is at a GC distance, and would be on the far side of the Bulge. The K4/5 V star would be too faint at a GC distance suggested by the star’s position on the colour-magnitude diagrams, for it to be this star it would have to be at a distance of pc, very close by. The remaining option from the colour is the K1 III which is also consistent with the and magnitudes. We note again that the errors mean that any spectral type is possible.
5.1.3 Corrected for local extinction
Using the local extinction values from Section 4.3, the intrinsic magnitudes of the bright source are , and , giving the bright star colours of , and .
For this extinction correction, all three colours are consistent with the same classes of stars within the errors, being G–M V stars, M2 or earlier giants and G/K I stars. The most likely matches are K4-6 V, K0-2 III or G3 I which are good fits for all , and colours (Cox, 2000).
Correcting for a Galactic Centre distance of (Nishiyama et al., 2006b), the , and magnitudes are consistent with B5 V and G4 III stars (Cox, 2000).
As with the previous two cases, the supergiant solution to the colours would be 3–4 magnitudes brighter than observed, or would have to be on the far side of the Bulge. The K4-6 V star selected from the colours would be too faint for the observed magnitudes unless the distance to this source were –1.4 kpc. The best match to the photometry using a local extinction correction is a G/K III, with a G4 III star the best overall match, which fits with both colours and individual magnitudes for a Galactic Centre distance.
| Candidate Counterparts | |||||||
|---|---|---|---|---|---|---|---|
| all-sky | B0 V | ||||||
| Galactic Bulge | K1 III | ||||||
| local | G4 III |
5.2 The spectrum
We obtained a spectrum for the brighter of the two stars, shown in Figures 2 and 5. From the absorption lines in the spectrum, it appears that this source is a late type giant. There are strong 12CO band-heads, some evidence of 13CO band-heads and Mg, Ca and Na absorption features.
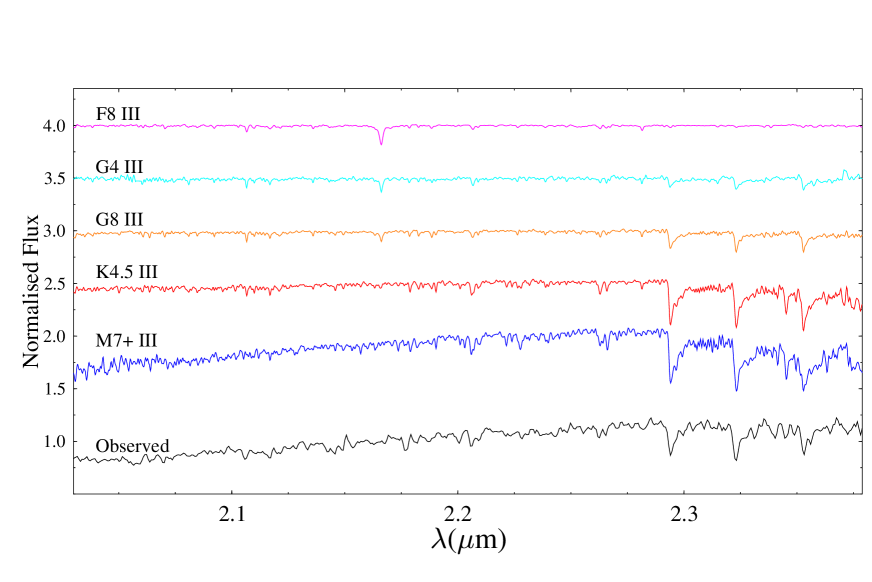
We performed an optimal subtraction (similar to a test where the difference between the normalised spectra are measured for each wavelength, the minimum being the best fit) in order to improve our identification of the spectral type of the counterpart. We used the spectral library of standards from Wallace & Hinkle (1997) which includes stars of most spectral types from A–M giants. The resolution of the standards was R = 3000, so we had to re-sample them to match the lower resolution of our observed spectrum.
The optimal subtraction enabled us to exclude the possibility that the counterpart is of spectral type earlier than a G III type star. This is based on the absence of CO band-heads from the spectra of these earlier type stars. The CO band-heads are the most prominent feature of the observed spectrum and so the subtraction is strongly influenced by their presence. Of the G, K and M type spectra, later types of each (5-8) proved the best fits based on the strength of the CO features, with G8 III, K4.5 III, and M7+ III proving the best fits for the respective spectral types as shown in Figure 5. The relatively low resolution of our target spectrum does not allow us to distinguish between these possibilities in a statistically significant way.
Brackett- emission was not observed in the spectrum, nor any other emission lines, indicating the brighter source is not in an accreting system. Alternatively, if it is, then the surface of the companion star or the outer regions of the accretion disc if present are not being heated sufficiently to produce an observable emission line in our spectrum.
The spectral types indicated by the optimal subtraction are in agreement with the spectral type as constrained using the photometry for the Galactic Bulge and local extinction cases. However it is only the local case that gives a consistent result for all the colours and magnitudes which also agrees with the spectrum.
6 Faint star
6.1 Star Properties
The position of the faint source on the colour-magnitude diagram (Fig. 3 and 4) indicates that it is not actually at the distance of the GC, but is in fact closer. The colour excess for this star is half that of the GC population in the field, therefore, we have chosen to apply only half the extinction correction to this star compared to the brighter counterpart. We have also applied a distance correction of with a larger error than the derived from the error on the GC distance due to the uncertainties in the actual distance as judged purely on the star’s position on the colour-magnitude diagram. Using these values for the distance and extinction correction, we now examine in detail the implications for the nature of the fainter star in each of the three extinction scenarios. The results are summarised in Table 4.
6.1.1 Corrected for all-sky extinction
Applying 0.5 of the all-sky extinction value gives the faint source intrinsic magnitudes of , and which gives it colours of , and .
The colour is inconsistent with any spectral type of stars, even at the limits of the errors. At the extreme of the error bounds, the is close to that for an M7 III. The colour is consistent with all spectral types of all stars within the error bounds, but the best fit is to early K1-4 V/III stars, or G8 I (Cox, 2000).
The magnitude is approximately 1.4 mag fainter than the and magnitudes, meaning that the three magnitudes are not consistent with a single spectral type, but at a distance of (Nishiyama et al., 2006b), the and magnitudes are consistent with a late type B V star (Cox, 2000).
Considering the spectral types allowed by the colours, the supergiant would be 6–7 magnitudes brighter than observed if it were at the distance estimated by the star’s position on the colour-magnitude diagram, or to achieve the observed magnitudes, it would have to be at a distance , on the far side of the Galaxy. Similarly for the giant, it would be 2–5 magnitudes brighter if at , or would have to be at , approximately in the Bulge, in contradiction to its position on the colour-magnitude diagrams. There is no spectral type that is consistent with both the colours and magnitudes.
6.1.2 Corrected for Galactic Bulge extinction
As above, applying only half of the extinction calculated using the values from Nishiyama et al. (2006a), the intrinsic magnitudes of the faint source become , and , giving the star colours of , and .
As with the all-sky extinction correction, using the extinction for the Galactic Bulge, the resulting colour is inconsistent with all spectral types, and the colour is consistent only with the late M III stars at the limit of the errors. The colour allows for all spectral types within the errors, but the best fits would be K2/4 V, a K0/1 III or a G3-8 I (Cox, 2000).
Correcting for half the Galactic centre distance of (Nishiyama et al., 2006b), as with the previous case, the magnitude appears too faint. The and magnitudes are consistent with a K5-7 V star, the magnitude for an M0/1 V star.
As with the all sky case, the supergiant and giant stars that are possible matches would be 2–7 magnitudes too bright at the distance determined from the colour-magnitude diagram. For them to have the observed magnitudes, they would have to be on the far side of the Galaxy, or in the Galactic Bulge respectively, but the position of the star on the colour-magnitude diagrams is inconsistent with this. A K4/5 V star is consistent with the colour and and magnitudes however the limits are most strongly placed by the and magnitudes as all spectral types are allowed within the colour errors.
6.1.3 Corrected for local extinction
Using the extinction values from Section 4.3, applying half of the local extinction, the intrinsic magnitudes of the faint source are , and , giving the star colours of , and .
After applying half the local extinction correction, all three colours of the faint counterpart are consistent with either M V, K III or G–M I type stars. This is based on the errors in the and colours since, as with the previous cases, the error allows all spectral types.
All three magnitudes are consistent with a K7/M0 V star when corrected for a distance of (Nishiyama et al., 2006b).
As with the other two cases, the supergiant and giant spectral types that match the colours would be 2–7 magnitudes too bright for the distance suggested by the position of the star on the colour-magnitude diagrams. A K7/M0 V star is consistent with all the colours and magnitudes within the errors, and so is the most likely candidate for the spectral type of this faint candidate counterpart.
| Candidate Counterparts | |||||||
|---|---|---|---|---|---|---|---|
| all-sky | - | ||||||
| Galactic Bulge | K4/5 V | ||||||
| local | K7/M0 V |
7 Extinction Discussion
For the all-sky and Galactic Bulge extinction cases, there are clear problems with the colours and magnitudes obtained after the extinction correction has been applied. These could be caused by an error in the extinction correction, be an intrinsic property of the stars, or result from an error in the original photometry of the sources. The bright candidate counterpart’s colours and magnitudes are consistent with the overall field population, and with the local surrounding population suggesting that the resultant problems with the photometry are not intrinsic to this star. Wang et al. (2007) observed the bright candidate counterpart to GRO J 1744-28 on February 2004 using the PANIC camera on the 6.5-meter Magellan/Baade telescope at Las Campanas Observatory in Chile. Their reddened magnitudes are similar to those of this work: , and , compared to our values of , and (Fig. 4). While there is a slight offset between the two sets of magnitudes, it is not sufficient to account for the problems with the photometric classification of the counterpart. Wang et al. (2007) use a different photometric calibration to ours (Z. Wang, private communications) which can account for the offset. The fact that they independently observed similar magnitudes suggests that there is not a calibration error in our data.
This leaves the extinction correction as the most likely cause of the abnormal un-reddened photometry. As mentioned in Section 4, the extinction towards the Galactic Centre is highly variable (Catchpole et al., 1990; Schultheis et al., 1999; Dutra et al., 2003; Gosling et al., 2006, and many others), and there is evidence to suggest that the behaviour of the extinction law is also variable not only towards the Galactic Centre but across the whole sky (Nishiyama et al., 2006a; Froebrich et al., 2007, Gosling et al. in prep.). When we applied a localised extinction correction, taking into account the variation of the extinction law we recovered consistent colours and magnitudes for the brighter candidate counterpart that agreed with the spectroscopic identification.
For the fainter candidate counterpart, we only applied an extinction correction of half that used for a star at the GC based on the position of the star on the colour-magnitude diagram. As with the bright candidate counterpart, using either an all-sky extinction correction or a Galactic Bulge correction were not able to recover a consistent spectral type (see Section 6). This was again caused by the magnitude seeming to be anomalously faint in comparison to the and . The localised extinction correction that takes into account a variation in the wavelength dependence of the extinction recovered colours and magnitudes that were all consistent with a K7/M0 V star at a distance of .
For both the bright and faint stars, we find that the magnitude measured is anomalously faint for both an all-sky and general Galactic Bulge extinction correction. For these cases, this prevented identification of a specific spectral type of the counterpart. We calculated a local extinction correction, which takes into account variations in the extinction law across the Galactic Bulge, which gave an extinction law of . This is significantly steeper than the extinction law was previously thought to be in this region (Rieke & Lebofsky, 1985; Cardelli et al., 1989; Schultheis et al., 1999; Dutra et al., 2003; Indebetouw et al., 2005; Nishiyama et al., 2006a) but would explain why in the all-sky and Galactic Bulge extinction cases we find that it is the magnitude that is anomalously faint, as such a high value for the extinction law means that the extinction will be proportionally underestimated at shorter wavelengths in such cases.
The local extinction case is the only one to produce colours and magnitudes that are all consistent with a single (or very small range) of spectral types, and in the case of the bright candidate counterpart, this spectral classification is in general agreement with the spectral types allowed based on the comparison of the observed spectrum to standard stars. We feel that although it is a departure from the accepted results for extinction corrections, this does result in accurate photometry for the target stars, and as we will show in Gosling et al. in prep, and has been shown in Nishiyama et al. (2006b); Fitzpatrick & Massa (2007) and Froebrich et al. (2007) is a phenomenon not limited to this one area, but is present across the entire Galactic plane.
8 Counterpart Discussion
8.1 Bright Counterpart
We obtained a spectrum of the brighter candidate, and the prominent CO and metal absorption features indicate that it is a late type giant star. The optimal subtraction that we performed narrowed it down to a late G, K or M giant, however the signal-to-noise of the spectrum was insufficient to be able to improve on this. Combining this with the photometry (using the local extinction correction) the bright candidate counterpart is most likely a late G/K III star.
Using this as a constraint, we can estimate some of the physical properties of the system. We use a NS mass of , a companion G/K III mass of (Cox, 2000) and the measured orbital period of (Finger et al., 1996). From this we calculate the system would have a semi-major axis of , and the Roche lobe of the donor star would be . In this case, if the bright star is the counterpart, then the radius of a G/K III giant (Cox, 2000) is on the limits for accretion to be by Roche lobe overflow. A star of this mass is also inconsistent with the mass-function measured by Finger et al. (1996), unless the inclination angle , i.e. we are observing the system nearly pole-on.
No Brackett- line was observed in the spectrum of this candidate counterpart, nor any other emission lines. Therefore if this source is the counterpart to GRO J 1744-28 then the surface of the star/outer accretion disc is not being illuminated and heated by the X-rays from the compact object, or if so the heating is not strong enough to cause detectable line emission. The source may not be in an accreting phase; if so the observed X-rays could be the residual cooling of the NS surface, assuming the quiescent flux measured by Wijnands & Wang (2002); Wang et al. (2007). If so, and this star is the companion, this would be in agreement with the theory put forward by Cui (1997) that GRO J 1744-28 is in the propeller regime which is inhibiting accretion when it is in its quiescent state.
8.2 Faint Counterpart
Using the local extinction correction, and a distance of the most likely spectral type for the star is K7/M0 V. This was the only result that was in agreement for all colours and magnitudes.
A K7/M0 V star has a mass of and radius of (Cox, 2000). Performing the same calculation as in Section 8.1, using the parameters from Finger et al. (1996) gives an orbital separation of , and the Roche lobe of the donor star would be . Mass transfer in such a system would be by wind accretion. Such a system would have an inclination angle, , still very unlikely.
The magnetic field strength estimated by Cui (1997) (), requires a mass accretion rate for the Alfvén radius to be greater than the co-rotation radius for this system, as required for the propeller effect. This is about 4 orders of magnitude greater than typical wind-accretion rates, so if the system is wind-fed then the observed quiescence could definitely be caused by the propeller effect as theorised by Cui (1997). However it is very unlikely that X-ray emission would be observed from a wind-accreting system containing a late main-sequence star as the stellar wind would result in very little mass transfer.
The distance used in calculations for this star, , is slightly lower than the distance as calculated by Giles et al. (1996). It is also at odds with the measured column density to the source that indicates that it should be closer to the GC (Dotani et al., 1996a; Giles et al., 1996; Muno et al., 2007, and others). However, the extinction correction that has provided the best corrected matches for the photometry (and compared to the spectroscopy in the bright candidates case) has a very steep extinction law, . If this steep law extends to X-ray wavelengths, it would cause an over-estimation of the source distance based on the column density measurement.
This star was too faint to obtain a spectrum with the integration times used for our 2003 VLT/ISAAC spectroscopy. In order to definitively rule out this star as the counterpart to GRO J 1744-28, high S/N K-band spectroscopy, with significantly higher integration times, will be required.
8.3 Mass Function Constraints
The mass-function for GRO J 1744-28 determined by Finger et al. (1996) is . Using this in conjunction with the (also from Finger et al., 1996) we calculated the expected mass of the companion as a function of the inclination angle, assuming a neutron star mass of (Fig. 6). From this we find that unless we are observing the system almost pole-on (inclination angle ), the companion will have , in agreement with the calculations of Bildsten & Brown (1997).

The mass function is still the strongest constraint on the properties of the counterpart. Neither of the stars detected in the X-ray error circle are consistent with it unless the system is almost pole-on, in which case almost any spectral type is possible (Fig. 6). Finger et al. (1996) measured the orbital period by fitting pulse phases, caused by Doppler shifting due to orbital motion, which would be un-observable if the system were pole-on. Both the candidates described above would require the system to be almost pole-on and so are unlikely to be the true counterparts.
Assuming the system is not pole-on, the mass-function places an approximate upper limit on the mass of the counterpart at (), which equates to an M3 or later main sequence star (Cox, 2000), or an evolved star that has lost a significant portion of its mass (Rappaport & Joss, 1997). Both of these scenarios rule out Roche Lobe overflow as the method of production of the currently observed X-ray emission in GRO J 1744-28 as neither would fill their Roche Lobes. Thus, the observed X-ray emission is either residual cooling of the surface, or wind accretion and as such in quiescence GRO J 1744-28 would have a minimal disc unlikely to affect the observed magnitude of the counterpart.
If the counterpart were a low-mass main sequence star, at the distance of the GC, it will be too faint to be detected in our ISAAC images (). It would require deep, very-high spatial resolution observations to reveal such a star, however such a low-mass star would never be able to produce a sufficiently strong wind to accrete enough material to explain the previous periods of outburst observed in the system. This will also be true of the faint candidate counterpart and as such it is unlikely that this star can be the counterpart.
Rappaport & Joss (1997) calculated that if the counterpart to GRO J 1744-28 was an evolved star that had had the majority of its enveloped stripped through binary interaction it would have a -band magnitude most likely of 14.1 with a range of 13.5-14.5 (95% confidence limit). The magnitude limit of our survey is so even with the highest extinction of the all-sky value, we would have detected such a star. The bright star in our survey, when corrected for the best, local extinction correction, has a magnitude of within the confidence limits of this value. Rappaport & Joss (1997) give a radius of ( 95% confidence range) for such a star as it has lost part of its envelope. This star would be even less likely to be accreting by Roche lobe overflow, although it is still possible within the errors. We do not observe Brackett- emission in the spectrum of this star, but as it is in quiescence, it is very likely that the emission is too faint to detect. However, this star would have an extremely low inclination , even lower than the constraints from Rappaport & Joss (1997) (, 95% confidence limit) but as this counterpart has lost a considerable amount of its envelope, it could have a lower mass than stated without having significantly changed its observed spectral type and therefore a slightly larger inclination angle. This low inclination angle is unlikely in a single system, but as Rappaport & Joss (1997) point out, by 1997, about 100 X-ray binaries had been studied in detail so it is reasonable to expect that there should be a few systems with very low inclinations.
9 Conclusions
We detected two sources within the X-ray error circle of GRO J 1744-28. The bright source has a position , and the faint source has position , with errors.
We calculated the extinction towards these sources using three methods. A canonical all-sky value using the extinction law from Rieke & Lebofsky (1985), a Galactic Bulge value using the extinction law measured in Nishiyama et al. (2006a) and a local value calculated using the colour-excesses of the stars within 20″ of the sources (see Section 4). When correcting for these three extinction cases, only the local value produced colours and magnitudes that were all consistent with each other and a single, or small range, of spectral types (see Sections 5.1.3 and 6.1.3), and consistent with the spectroscopic identification for the bright counterpart (see Section 5.2). This local extinction value has an extinction law relation of (), much steeper than the previously accepted values. This explains why in the all-sky and Galactic Bulge extinction cases the magnitude is always faint compared to the and magnitudes as the extinction will be proportionally underestimated compared to the extinction at these two wavelengths.
The mass-function for GRO J 1744-28, for an inclination of , constrains the mass of the counterpart to be . For this mass, the counterpart would have to be either an M3+ V (Cox, 2000) or an evolved star that has been stripped of mass (Rappaport & Joss, 1997). An M3+ V is too faint to be detected in this survey, assuming a Galactic Centre distance of and that the extinction is consistent with the local extinction case, and to be detected would require an observation with approximate limits of , and , 4 magnitudes deeper than the observations of this work. Rappaport & Joss (1997) give limits for the magnitude of the likely counterpart to GRO J 1744-28 if it is a stripped giant, and such a star would have been detected in the observations for this work. In either case, the counterpart would not fill its Roche Lobe, and mass transfer in the system, if there is any, would be by wind accretion. In this case, the magnetic field strength measured by Cui (1997) would mean that the propeller effect was inhibiting accretion explaining the quiescent state of GRO J 1744-28 as observed since 1997.
Photometry of the faint star indicates that its most likely spectral type is K7/M0 V. Based on comparison with the mass-function, it would require the system to be almost pole-on (). The distance of this source (, see Fig. 3 & Nishiyama et al., 2006b) is smaller than suggested by both the distance calculated by Giles et al. (1996), and the measured column densities which suggest the source is close to the GC. However, if the steep extinction law slope of the local extinction extends to X-ray wavelengths it could cause an over-estimation of the distance to the X-ray source using only the column density. This faint source thus cannot be ruled out as the counterpart, but further data are required, especially IR spectroscopy, to investigate this possibility.
Based on photometry and spectroscopy, the bright candidate is most likely a late type G/K III star. The mass-function for the GRO J 1744-28 system (Finger et al., 1996) means that if this is the counterpart, the system will be almost pole-on to the observer (). The spectrum shows no sign of Brackett-, so, if this source is indeed the counterpart, the illumination of the outer accretion disc or surface of the star is insufficient to produce an observable emission line. The constraints on the observed magnitude of the counterpart that are placed by the calculations of Rappaport & Joss (1997) agree with the un-reddened magnitude of the bright counterpart (within the 95% confidence limits) if it is an evolved giant that has lost a significant fraction of its envelope. If this is the case, and this star is the true counterpart, the mass-loss would mean that a higher inclination angle is also possible. As stated in Rappaport & Joss (1997), by 1997 over 100 X-ray binaries had been studied in detail so it is plausible that a system with such a low inclination angle could by now be included in the sample.
Although the evidence is in favour of the brighter of the two candidate counterparts being the companion to the GRO J 1744-28 X-ray source, without detection of a Brackett- line in the spectrum, or further observations to rule out a fainter source, a definitive answer cannot be given as to the nature of the companion.
10 Acknowledgements
AJG would like to thank the UK Particle Physics and Astronomy Research Council for his studentship. SAF acknowledges travel support provided by UNSW@ADFA and the Astronomical Society of Australia. This paper is based on observations made with the ESO VLT at Paranal under imaging programme ID 071.D-0377(A) and spectroscopic programme ID 075.D-0361(A). We would also like to thank the anonymous referee for the helpful comments made.
References
- Augusteijn et al. (1997) Augusteijn, T., et al. 1997, ApJ, 486, 1013
- Bandyopadhyay et al. (2005) Bandyopadhyay, R. M., et al. 2005, MNRAS, 364, 1195
- Bandyopadhyay et al. (1999) Bandyopadhyay, R. M., Shahbaz, T., Charles, P. A., & Naylor, T. 1999, MNRAS, 306, 417
- Bandyopadhyay et al. (1997) Bandyopadhyay, R., Shahbaz, T., Charles, P. A., van Kerkwijk, M. H., & Naylor, T. 1997, MNRAS, 285, 718
- Bildsten & Brown (1997) Bildsten, L., & Brown, E. F. 1997, ApJ, 477, 897
- Bohlin et al. (1978) Bohlin, R. C., Savage, B. D., & Drake, J. F. 1978, ApJ, 224, 132
- Cardelli et al. (1989) Cardelli, J. A., Clayton, G. C., & Mathis, J. S. 1989, ApJ, 345, 245
- Catchpole et al. (1990) Catchpole, R. M., Whitelock, P. A., & Glass, I. S. 1990, MNRAS, 247, 479
- Cole et al. (1997) Cole, D. M., et al. 1997, ApJ, 480, 377
- Cox (2000) Cox, A. N. 2000, Allen’s astrophysical quantities, 4th ed. Publisher: New York: AIP Press; Springer, 2000. Edited by Arthur N. Cox. ISBN: 0387987460,
- Cui (1997) Cui, W. 1997, ApJL, 482, L163
- Daigne et al. (2002) Daigne, F., Goldoni, P., Ferrando, P., Goldwurm, A., Decourchelle, A., & Warwick, R. S. 2002, A&A, 386, 531
- Dotani et al. (1996a) Dotani, T., Ueda, Y., Ishida, M., Nagase, F., Inoue, H., & Saitoh, Y. 1996, IAU Circ., 6337, 1
- Dotani et al. (1996b) Dotani, T., Ueda, Y., Nagase, F., Inoue, H., & Kouveliotou, C. 1996, IAU Circ., 6368, 2
- Dutra et al. (2003) Dutra, C. M., Santiago, B. X., Bica, E. L. D., & Barbuy, B. 2003, MNRAS, 338, 253
- Finger et al. (1996) Finger, M. H., Koh, D. T., Nelson, R. W., Prince, T. A., Vaughan, B. A., & Wilson, R. B. 1996, Nat, 381, 291
- Fishman et al. (1995) Fishman, G. J., Kouveliotou, C., van Paradijs, J., Harmon, B. A., Paciesas, W. S., Briggs, M. S., Kommers, J., & Lewin, W. H. G. 1995, IAU Circ., 6272, 1
- Fitzpatrick & Massa (2007) Fitzpatrick, E. L., & Massa, D. 2007, ArXiv e-prints, 705, arXiv:0705.0154
- Frail et al. (1996) Frail, D. A., Kouveliotou, C., van Paradijs, J., & Rutledge, R. 1996, IAU Circ., 6323, 2
- Froebrich & del Burgo (2006) Froebrich, D., & del Burgo, C. 2006, MNRAS, 369, 1901
- Froebrich et al. (2007) Froebrich, D., Murphy, G. C., Smith, M. D., & Walsh, J. 2007, ArXiv e-prints, 704, arXiv:0704.2993
- Frogel & Whitford (1987) Frogel, J. A., & Whitford, A. E. 1987, ApJ, 320, 199
- Giles et al. (1996) Giles, A. B., Swank, J. H., Jahoda, K., Zhang, W., Strohmayer, T., Stark, M. J., & Morgan, E. H. 1996, ApJL, 469, L25
- Gosling et al. (2006) Gosling, A. J., Blundell, K. M., & Bandyopadhyay, R. 2006, ApJL, 640, L171
- Hurley et al. (2000) Hurley, K., et al. 2000, ApJ, 537, 953
- Indebetouw et al. (2005) Indebetouw, R., et al. 2005, ApJ, 619, 931
- Kouveliotou et al. (1996) Kouveliotou, C., van Paradijs, J., Fishman, G. J., Briggs, M. S., Kommers, J., Harmon, B. A., Meegan, C. A., & Lewin, W. H. G. 1996, Nat, 379, 799
- Lewin et al. (1996) Lewin, W. H. G., Rutledge, R. E., Kommers, J. M., van Paradijs, J., & Kouveliotou, C. 1996, ApJL, 462, L39
- Mathis (1990) Mathis, J. S. 1990, ARA&A, 28, 37
- Muno et al. (2007) Muno, M. P., Wijnands, R., Wang, Q. D., Park, S., Brandt, W. N., Bauer, F. E., & Wang, Z. 2007, ATel, 1013
- Messineo et al. (2005) Messineo, M., Habing, H. J., Menten, K. M., Omont, A., Sjouwerman, L. O., & Bertoldi, F. 2005, A&A, 435, 575
- Nishiyama et al. (2006a) Nishiyama, S., et al. 2006a, ApJ, 638, 839
- Nishiyama et al. (2006b) Nishiyama, S., et al. 2006b, ApJ, 647, 1093
- Rappaport & Joss (1997) Rappaport, S., & Joss, P. C. 1997, ApJ, 486, 435
- Rieke & Lebofsky (1985) Rieke, G. H., & Lebofsky, M. J. 1985, ApJ, 288, 618
- Schultheis et al. (1999) Schultheis, M., et al. 1999, A&A, 349, L69
- Strohmayer et al. (1996) Strohmayer, T., Lee, U., & Jahoda, K. 1996, IAU Circ., 6484, 1
- Swank (1996) Swank, J. 1996, IAU Circ., 6291, 1
- van Belle et al. (1999) van Belle, G. T., et al. 1999, AJ, 117, 521
- Wallace & Hinkle (1997) Wallace, L., & Hinkle, K. 1997, ApJS, 111, 445
- Wang et al. (2002) Wang, Q. D., Gotthelf, E. V., & Lang, C. C. 2002, Nat, 415, 148
- Wang et al. (2007) Wang, Z., Chakrabarty, D., & Muno, M. 2007, ATel, 1014
- Wijnands & Wang (2002) Wijnands, R., & Wang, Q. D. 2002, ApJL, 568, L93
- Woods et al. (1999) Woods, P. M., et al. 1999, ApJ, 517, 431