The Post-Burst Awakening of the Anomalous X-ray Pulsar in Westerlund 1
Abstract
On September 21, 2006, an intense (10) and short (20 ms) burst was detected by Swift BAT at a position consistent with that of the candidate Anomalous X–ray Pulsar CXOU J164710.2455216, discovered by Chandra in 2005. Swift follow-up observations began 13 hours after the event and found the source at a 1-10 keV flux level of about 4.510, i.e. 300 times brighter than measured 5 days earlier by XMM-Newton. We report the results obtained from Swift BAT observations of the burst and subsequent Swift XRT observations carried out during the first four months after the burst. These data are complemented with those from two XMM-Newton observations (carried out just before and after the BAT event) and four archival Chandra observations carried out between 2005 and 2007. We find a phase coherent solution for the source pulsations after the burst. The evolution of the pulse phase comprises an exponential component decaying with timescale of 1.4 d which we interpret as the recovery stage following a large glitch (). We also detect a quadratic component corresponding to a spin-down rate of s s-1, implying a magnetic field strength of 1014 Gauss.
During the first SwiftXRT observation taken 0.6 days after the burst, the spectrum showed a keV blackbody ( km) plus a power-law accounting for about 60% of the 1-10 keV observed flux. Analysis of Chandra archival data, taken during 2005 when the source was in quiescence, reveal that the modulation in quiescence is 100% pulsed at energies above 4 keV and consistent with the (unusually small-sized) blackbody component being occulted by the neutron star as it rotates.
These findings demonstrate that CXOU J164710.2455216 is indeed an AXP; we compare them with the properties of three other AXPs which displayed similar behavior in the past.
1 Introduction
In recent years there has been a large observational and theoretical effort aimed at unveiling the nature of a sample of peculiar high-energy pulsars, namely the Anomalous X–ray Pulsars (AXPs; 8 objects plus one candidates) and the Soft -ray Repeaters (SGRs; 4 objects plus three candidates). SGRs were discovered in the seventies through the very intense bursts that they sporadically emit in the soft -ray band; AXPs were recognized as a distinct class of X–ray pulsars only a decade ago by virtue of their peculiar persistent emission and spin–down properties in the X–ray band (Paczyński 1992; Mereghetti & Stella 1995; for a recent review see Woods & Thompson 2004). It is now commonly believed that AXPs and SGRs are linked at some level, owing to their similar timing properties (spin periods in the 5-12 s range and period derivatives Ṗ in the 10-11–10-13 s s-1 range). Both classes have been proposed to host neutron stars whose emission is powered by the decay of their extremely strong inner magnetic fields ( G; Duncan & Thompson 1992; Thompson & Duncan 1995). The detection of X–ray bursts from 1E 1048.15937, 1E 2259586, 4U 0142614 and XTE J1810-197 has strengthened the possible connection between AXPs and SGRs (Gavriil et al. 2002; Kaspi et al. 2003; Woods et al. 2005; Kaspi et al. 2006), as well as the magnetar scenario.
Different types of X-ray flux variability have been displayed by AXPs, including slow and moderate flux changes (up to a factor of a few) on timescales of years (virtually all the objects of the class), moderate-intense outbursts (flux variations of a factor up to 10) lasting for 1-3 years (1E 2259586, and 1E 1048.15937), and dramatic and intense SGR-like burst activity (fluence of ergs) on sub-second timescales (4U 0142614, XTE J1810-197, 1E 2259586 and 1E 1048.15937; see Kaspi 2006 for a recent review on the X-ray variability). Particularly important was the 2002 bursting/outbursting event detected from 1E 2259586, the only known event in which a factor of 10 persistent flux enhancement in an AXP was detected in coincidence of a burst-active phase during which the source displayed more than 80 short bursts (Gavriil, Kaspi & Woods 2003; Woods et al. 2004). The timing and spectral properties of the sources changed significantly during this phase, and recovered within a few days. The short recovery time is likely because of the relatively high X-ray luminosity level of the pre-outburst phase ( in the 1-10 keV band). In 2003 The first transient AXP, XTE J1810-197, was discovered. This source displayed a factor of 100 persistent flux enhancement with respect to the pre-outburst quiescent luminosity level () where no pulsations were detected. Unfortunately, since the initial phases of the outburst were missed, we do not know whether an active bursting phase, similar to that of 1E 2259586, set in also in this source, leaving several questions concerning the mechanisms of the outburst onset unanswered (Ibrahim et al. 2004; Gotthelf et al. 2004; Israel et al. 2004; Rea et al. 2004). Until now, no transient bursting-outbursting AXP was known.
On September 21st, 2006, a burst was detected by the Swift Burst alert Telescope (BAT) at a position consistent with the AXP candidate CXOU J164710.2455216 in the open cluster Westerlund 1 (Krimm et al 2006; Muno et al. 2006). The 20 ms duration of the burst suggested that the origin of the burst was indeed the candidate AXP. Unfortunately, since the burst was initially attributed to a nearby Galactic source, the burst BAT position was not promptly re-observed by Swift. Moreover, because of the relatively low significance of the burst detection, the event was initially tagged as “not real”. A subsequent careful analysis of the data confirmed that the detection was indeed real (Krimm et al. 2006). We activated a ToO observation program with Swift in order to look for burst-induced persistent flux variations of the source. The first Swift pointing was carried out 13 hours after the burst. The AXP was detected at a flux level about 300 times higher than that in the previous measurement (5 days before, from an XMM-Newton Guest Observer Program pointing; Muno et al. 2006b; 1-10 keV flux level of 1.510), hence confirming the transient behavior of CXOU J164710.2455216 (Campana & Israel 2006; Israel & Campana 2006; Ibrahim et al. 2004).
A first radio observation of CXOU J164710.2455216 was carried out from Parkes at 1.4 GHz a week after the outburst onset, with the goal of searching for pulsed emission similar to the case of XTE J1810-197 (Camilo et al. 2006). The data put a tight upper limit of 40 on the presence of pulsed emission from the source (Burgay et al. 2006). The position of CXOU J164710.2455216 was also observed serendipitously by IBIS/ISGRI on board INTEGRAL on 2006 September 22nd (23ks of effective exposure time): the source was not detected and 3 sigma upper limits of 510 in the 20-40 keV band, and 1.710 in the 40-200 keV band were derived (Götz et al. 2006). Near-IR observations were carried out on 2006 September 29 in the Ks band and reaching a limiting magnitude of 20.3 (3; Wang et al. 2006): no IR counterpart or variable object was found at the Chandra position of CXOU J164710.2455216.
In this paper we report the results from the initial Swift BAT detection and the subsequent Swift XRT monitoring campaign consisting of 15 ToO observations. We also report on a re-analysis of archival Chandra datasets of Westerlund 1, which allowed us to carry out the first pulse-phase spectroscopic study of CXOU J164710.2455216 in quiescence. Finally, we compare the observed behavior of CXOU J164710.2455216 with that of three other AXPs (XTE J1810-197, 1E 1048.15937 and 1E 2259586), which displayed a similar phenomenology in the past.
2 Observations and Results
The Swift data (see Table 1) were reduced with the standard BAT and XRT analysis software distributed within Heasoft (v6.0.5) to produce cleaned event lists. For the XRT data we considered Windowed Timing (WT) and Photon Counting (PC) mode data (see Hill et al. 2004 for a full description of read-out modes) and further selected XRT grades 0–12 and 0–2 for WT and PC data, respectively (according to Swift nomenclature; Hill et al. 2004). XMMSAS v200606281801-7.0 and CIAO v3.3.0.1 were used to reduce the XMM-Newton and Chandra data, respectively. Timing and spectral analyses were carried out with XSPEC v12.2.1, Xronos v5.21, and ad-hoc developed pipelines (Israel & Stella 1996; Dall’Osso et al. 2003).
2.1 The BAT event
The BAT event took place at 01:34:52 in Barycentric Dynamical Time (TBC) on 2006 September 21. It was the first burst ever detected from an AXP at energies above 20-30 keV. We analyzed the 20 ms-integrated spectrum by considering the data in the 15–150 keV energy range and applying an energy-dependent systematic error vector111heasarc.gsfc.nasa.gov/docs/swift/analysis/bat_digest.html. Owing to poor statistics, a preferred model could not be singled out: both a blackbody and a power-law component gave 1 (3 degree of freedom, hereafter dof; see Figure 1). A of 9.9 keV and a of 1.8(5) were obtained for the two models (errors are at 90% confidence level). In both cases a fluence was found of erg cm-2, corresponding to a total energy of ergs (for an assumed distance of 5 kpc). Assuming an exponential decay for the burst flux, we determined a decay time of 3(1) ms (1 confidence level) from the 5 ms binned BAT lightcurve centered around the trigger (see inset in Figure 1). Compared with the properties of previously detected AXP bursts, the event from CXOU J164710.2455216 had a duration within 1 from the log-normal distribution average value inferred for 1E 2259586, while the fluence is significantly larger (by a factor of ) than the mean (Gavriil et al. 2004). Out of 80 detected from 1E 2259586, only three had fluences comparable to or slightly larger than that of the BAT event, while only one of the three shared a comparable duration.
2.2 XRT Monitoring Observations
Swift observed CXOU J164710.2455216 on 15 epochs between the BAT event and 2007 January 22, for a total effective exposure time of 50 ks (see Table 1). For the WT mode data, the extraction region was computed automatically by the analysis software and was a rectangle of 40 pixels along the WT strip, centered on the source and encompassing of the Point Spread Function in this observing mode. For PC mode observations, data were extracted from a circle with 30 pixel radius centered on the source. Background spectra were taken in PC mode from annular regions (inner and outer radii of 70 and 90 pixels, respectively), and in WT mode from a 40 pixel rectangular region in the vicinity of the source and free of sources. The photon arrival times were corrected to the Solar system barycenter. Note that the absolute timing calibration of the XRT is 200-300 s (Cusumano et al. 2005). Spectra were extracted from the same event lists. The 1–10 keV band was used in the spectral fitting. Spectra were re-binned so as to have at least 20 counts per energy bin, so that minimum techniques could be reliably used in the fitting.
2.2.1 Spectral analysis
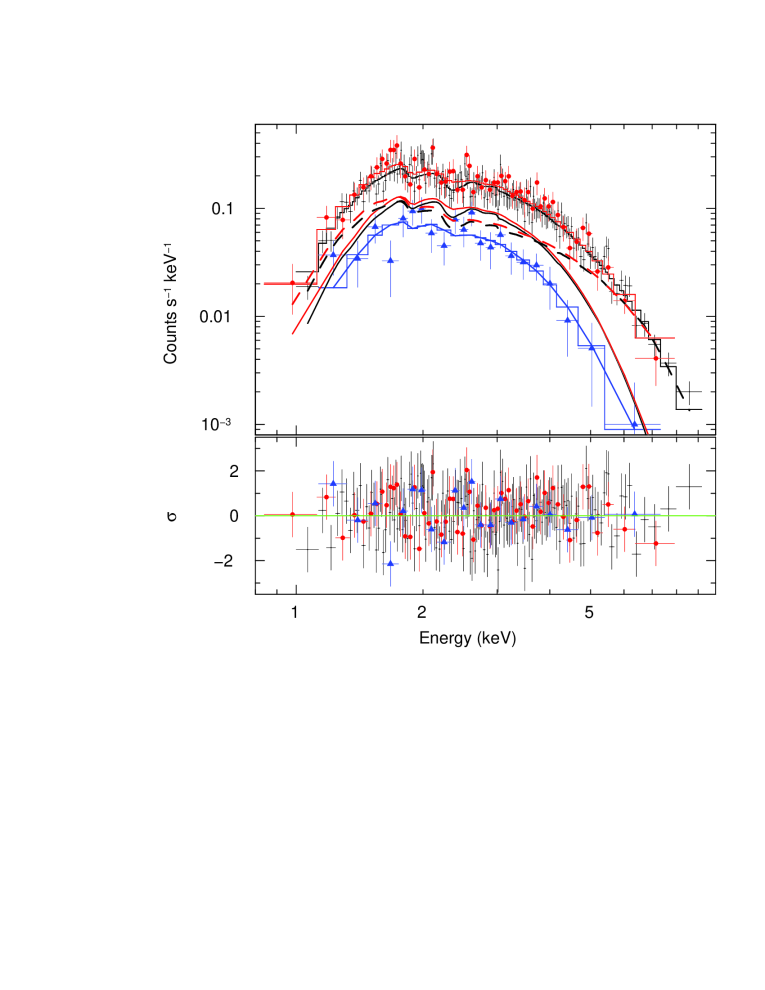
We fitted the 1-10 keV band spectral data of the first Swift ToO observation of CXOU J164710.2455216 with the pre-outburst models reported in literature (Muno et al. 2006; Skinner et al. 2006). The single absorbed black body (BB) model did not give acceptable results (reduced of 1.3 for 225 dof). A better fit (reduced 1.0 for 223 dof) was obtained by using an absorbed BB with keV, km at 5 kpc, plus a power-law (PL) component with photon index (see Figure 2). was fixed at the pre-outburst value of 1.91022 cm-2 measured with Chandra. Alternatively, two BBs with keV ( km) and keV ( km; all the uncertainties are at the 90% level; Campana & Israel 2006; Israel & Campana 2006). An F-test showed that the inclusion of the second component is significant at the 7 level. The 1–10 keV observed and unabsorbed fluxes were and , respectively, for both the two BB and the BB+power law models (the PL component accounts for up to about 60% of the observed flux). We note that the parameters of the BB component in the BB plus PL model are significantly different from those inferred in quiescence ( keV and km; Skinner et al. 2006; see also Section 2.3).
In the following analyses we adopt the canonical BB plus PL component to fit the entire Swift dataset (though there are no statistical reasons to prefer this model over the two-BB model). We first fitted all together the spectra obtained in 2006, by leaving all model parameters free except for NH, which we kept fixed at the value determined by Chandra (see above). Both the values of and were consistent with being constant in time with marginal evidence of becoming steeper as the outburst evolved. Therefore, we fixed both the BB temperature and the PL photon index to the values inferred from the first Swift pointing (which has largest S/N) and fitted all spectra together again. The PL dominated the CXOU J164710.2455216 flux during the first 10 days from the burst. The BB component accounted for nearly 80-90% of the total flux during the Swift observations one month later; this was similar to the spectrum in quiescence where the PL component was only marginally detectable (see also section 2.3). During the latest Swift observation on January 2007, the source was caught at a 1-10 keV observed flux level of 7.810 and only the BB component was detected with a characteristic temperature of kT=0.61(3) keV and radius RBB=1.7(1) km, clearly suggesting a cooling of the BB component as the size of the emitting region increases.
2.2.2 Timing
In this analysis we also included data from two XMM-Newton and two Chandra observations.222For the reduction of the two XMM-Newton observations we refer to Muno et al. (2006b); for the Chandra data reduction and analysis (obtained in continuous clock CC33_FAINT mode) we refer to the procedure reported, as an example, in Rea et al. (2005). We started by inferring an accurate period measurement by folding the data from each observation at the period reported by Muno et al. (2006; see also section 2.3). The majority of the resulting pulse profiles had three different peaks.
The relative phases and amplitudes were such that the signal phase evolution could be followed unambiguously for the observations in the 2006 October 2-27 time interval (see Figure 3). The resulting phase-coherent solution had a best-fit period of P s (uncertainties here are 1). TJD 13999.0 was used as reference epoch; Details on the phase-fitting technique are given in Dall’Osso et al. (2003). A quadratic component was required at 4 confidence level in the phase residual vs time fit. This corresponds to = 2.4(6) 10-12 s s-1. The value of is consistent, at the 2 level, with the measurement of s s-1 reported by Woods et al. (2006), who considered the data from 4 Chandra observations (from 2006 September 27 to October 28) in their fitting, and with the upper limit of 5.6 10-12 s s-1 derived by Israel et al. (2006) based on a reduced data sample.
Next, we compared our phase-coherent pulse profile with that derived from observations carried out in the 2006 September 21-26 time interval. The signal shape showed large changes across different observations. A one-to-one correspondence between peaks in different observations was found based on the fact that the reference/main peak and the dim peak remained nearly constant, both in amplitude and relative phase, during the whole observing period (see Figure 3). The third peak was highly variable in amplitude becoming comparable to, or even larger than, the reference peak after 10 days from the BAT event. The correctness of the reference and dim peak identification was supported by the fact that at higher energies the shape of the post-burst pulse profile a few days after the BAT event resembled more closely the single-peaked pre-burst pulse profile, as shown by Muno et al. (2006b; see also Figure 3). Based on the above findings we were thus able to track the phase evolution of the reference/main peak back to the first Swift observation. We note that techniques based on the cross-correlation of folded light curves from different observations proved unreliable in our case, as they tended to favor the alignment of the highest peak in each observation.
The phase-coherent solution determined for the 2006 October 2-27 time interval could not be extrapolated backwards to fit also the phases of the 2006 September 21-26 observations, not even by introducing higher period derivatives (up to the fourth order). The fit was improved by introducing an exponential term in the phase model, a likely signature of the occurrence of a pulsar glitch.. The model consisting of an exponential plus a linear and quadratic term gave a for 5 dof. In our best fit model, the exponential component has an e-folding time of d and an amplitude of Hz. These parameters imply a large glitch, with .
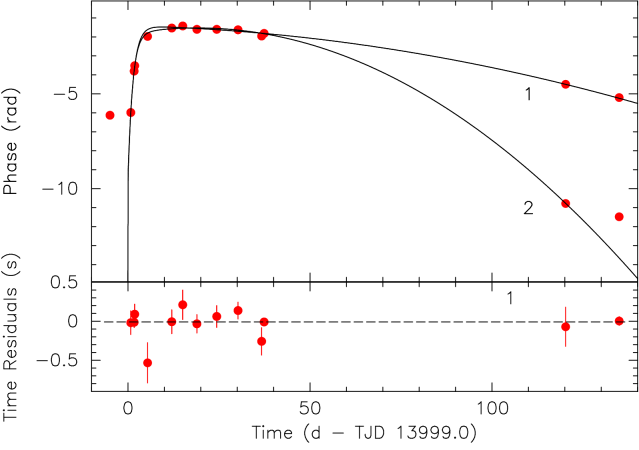
Subsequently we included three additional datasets obtained in 2007: two short Swift ToO observations carried out on January 19-22, 2007, at the beginning of the new visibility window of the source (see Table 2) and an archival Chandra DDT observations carried out on February 2, 2007. Unfortunately, the extrapolation of our phase coherent solution (at 99% confidence level) to 2007 January 19-22 observations resulted in a one cycle uncertainty, such that phase coherence was lost. The two possible phase values for the reference peak (separated by 2) yielded two solutions (see Figure 4). These are: (1) P s and = 8.9(6) 10-13 s s-1, and (2) P s and = 2.4(6) 10-12 s s-1. However, the expected phase shift for the two solutions in the week-long gap between the first Swift observation and the latest Chandra pointing is about 0.1 for solution (1) and 0.3 for solution (2). This provides a way to solve the ambiguity, thus recovering phase-coherence. Indeed, our phase fitting analysis showed that the pulse phase shift accumulated is 0.11(2), unambiguously identifying solution (1) as the correct one. Fitting the whole sample of phases with a linear (P), a quadratic (Ṗ) and an exponential component (glitch-like event) we derived the following final solution: P s, = 9.2(4) 10-13 s s-1, =1.4(1) days and an amplitude Hz, corresponding to a (reduced of 1 for 14 dof). We note that the periods inferred from the single pre- and post-burst XMM-Newton observations (which have a sufficiently good statistics for phase fitting techniques to be used) are P s and 10.61056(5) s respectively, therefore implying a P10-4 s. On the other hand, the expected P at the second XMM-Newton observation epoch, as inferred form the exponential decay parameters, is 210-4, which is in the same range as the P reported above.
We also tried to include the phase point obtained from the first XMM-Newton observation, carried out 5 days before the BAT event, in our solution for the post-burst phase. We identified the single-peak of the folded lightcurve as the reference peak we used for the phase fitting analysis (note that even a peak misidentification in the first XMM-Newton dataset would not affect the glitch parameters or the post-glitch phase-coherent solution).
We consider two possibilities for the glitch phenomenology. First, given its large amplitude, the exponential term is assumed to amount to essentially the whole spin-up episode, similar to what was observed in the second glitch from 1RXS J170849400910 (Dall’Osso et al. 2003; Kaspi et al. 2003). This would require that the glitch occurred within an hour from the first Swift observation. Alternatively, there could be a residual component of the spin-up that is recovered over a much longer timescale (of the order of months). A behaviour of this type was found in the glitch from 1E 2259586 (Woods et al. 2003), where the exponential recovery amounted to just 25% of the whole spin-up. In our coherent post-glitch timing solution, a residual spin-up component would imply a negative linear trend in the pre-glitch phases. The XMM-Newton data point could thus be in the position reported in Fig. 4 or shifted by multiples of .
Another possibility is that the exponential did not start exactly at , as it would be if the exponential had a finite rise time, or the glitch did not occur at exactly the same time as the burst. We found that even a delay of 8 hours (0.33 days) would decrease the expected value of the residual component of the spin–up by less than a factor of 2. Note that the 8 hour delay corresponds to the uncertainty in the glitch epoch determination of Woods et al. (2003) in the case of 1E 2259586.
As a last step, we disregarded our identification of the peaks, based on the requirement that two (out of the three) peaks remain nearly constant in relative phase and amplitude (see above) and looked for further possible timing solutions by selecting the other two peaks as the initial reference peak. The result of this additional analysis is reported in Figure 5, where the best possible alternative solution is shown. This was obtained by choosing the highest peak for each folded lightcurve and/or the nearest peak to the phase extrapolation of the possible timing solution. Fitting these phases with a model which included a Ṗ component gave a reduced of 2.5 (for 11 dof) corresponding to P s and 10-12 s s-1 (the values are very close to those reported by Woods et al. 2006). The first 3-4 datapoints display a marked scattering and give the largest contribution of the high value quoted above. Moreover, the phase of the first XMM-Newton pointing (even assuming a displacement of 2 in the y-axis position) would be too far to be reconciled with any simple timing solution involving only a P and Ṗ component. We therefore regard this possibility as highly unlikely.
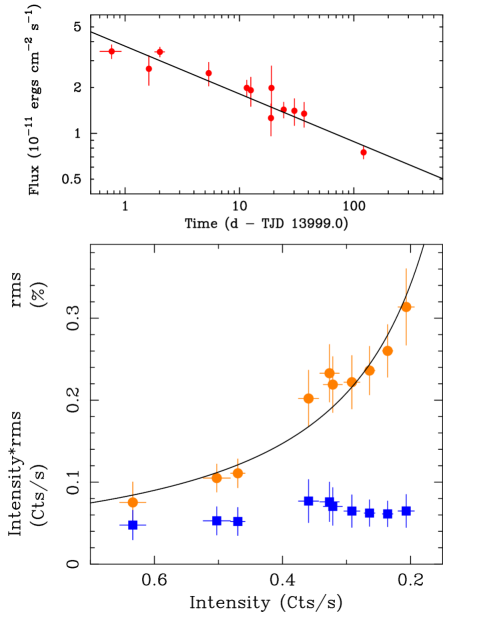
By means of the timing solution reported above, we folded the Swift XRT light curves in 13 phase-bins and inferred the corresponding root mean square (rms) pulsed fraction for each of them. In Figure 6 (lower panels) we report both the rms pulsed fraction as well as the pulsed intensity (in counts per second) as a function of the average source intensity. The fractional rms rose towards the pre-outburst value of toward the end of the monitoring observations. However, the countrate of the pulsed component remained nearly constant throughout the outburst, despite a factor of 3 variation in the average flux.
A search both in XRT and BAT monitoring data for additional X–ray bursts like the one detected by BAT gave negative results.
2.3 Chandra archival datasets
We retrieved from the Chandra archive two observations of Westerlund 1 carried out with the ACIS-S imaging array on 22-23 May 2005 and 18-19 June 2005 with effective exposure time of 18.8 ks and 38.5 ks, respectively. The observations were obtained in faint-event mode using a 3.2 s frame time. Details on the reduction were reported in Muno et al. (2006) and Skinner et al. (2006). In our re-analysis we focused on a pulse phase-resolved spectroscopy study of the longest observation.
Source photon arrival times were extracted from circular regions with a radius of 2″, which included about 95% of the source photons, and were corrected to the barycenter of the solar system. The best period of the longest observation was determined to be 10.61068(11) s, by fitting the phases of the modulation obtained over 4 consecutive intervals each s long duration (uncertainties are at the 90% confidence level). The value was consistent with the period reported by Muno et al. (2006).
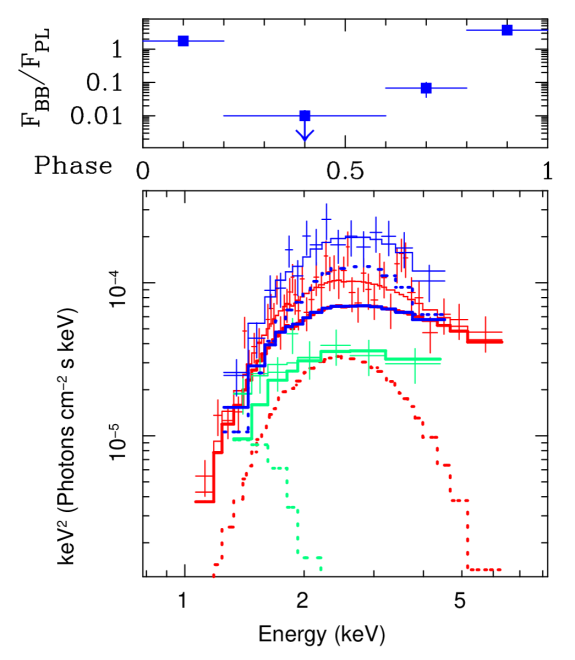
By folding the lightcurve at the best period reported above, a nearly sinusoidal shape of the modulation was found with a large pulsed fraction (78%4%; semi amplitude of the modulation divided by the mean source countrate; 52% in term of fractional RMS). Moreover, the pulsed fraction was consistent with being slightly energy–dependent in the soft and hard bands (pulsed fractions of 70%5% 88%5% for the 0.5-2 and 2-10 keV bands, respectively; 50%7% and 59%7% in term of fractional RMS). There were also indications that the minimum of the modulation was shallower at high energies (see Figure 8). Then, we identified 4 phase intervals (0.0-0.2, 0.2-0.6, 0.6-0.8 and 0.8-1.0; see Figures 8 and 7) within which a single spectrum was obtained.
We fitted the 1-10 keV phase-averaged spectrum with the BB and BB plus PL models. The inclusion of the PL component was found to be significant at the 98% confidence level. The best fit (reduced for 43 dof) was obtained for , keV and km. The PL component accounted for 60% of the total flux. These results are similar to those reported by Skinner et al. (2006). It should be noted, however, that a BB spectrum might not necessarily be the most appropriate description of the spectrum. Indeed, magnetized, light element atmospheres are often used to fit the spectra of magnetic neutron stars. Furthermore, general relativistic corrections (which are not accounted for in the BB model) also play a role in the observed spectrum. In the case of CXOU J164710.2455216, fits using a magnetized atmosphere and the appropriate general relativistic corrections were reported by Skinner et al. (2006). These yielded a slightly lower effective temperature and a slightly larger radius of the emitting region. However, the statistics were not sufficient to favor this model over the simple BB.
Finally, we carried out phase-resolved spectroscopic by keeping and fixed at the values inferred in the phase-averaged spectrum. The results of the spectral fitting are reported in Table 2 and shown in Figure 7 (lower panel). An F-test gave a probability of 99.2% for the PL component to be significant in the four phase interval spectra together. Based on the above analyses, we note that the presence of the PL component was corroborated by the fact that the countrate ratio between the pulse minimum and maximum were approximatively equal to the BB/PL flux ratios inferred from the PPS analysis (see first two panels of Figure 7). To further test this hypothesis we folded the lightcurve considering only photons at energies above 4.5 keV, where the contribution from the BB component was negligible at pulse minimum. The shape of the modulation changed drastically with respect to that at lower energies, showing an asymmetric profile with a flat 0.2 phase-long minimum consistent with zero countrate (see Figure 8).
We note that the unusually small size inferred for the BB emitting region (radius of 270 m) is consistent with the large pulsed flux. The BB component is emitted from a hot spot on the NS surface, and the pulsed fraction reaches its minimum as the BB emitting region gets completely occulted for a portion of the star rotation period. Therefore, at pulse minimum, the spectrum is dominated by the PL component.
3 Discussion
In the following we compare the Swift results of CXOU J164710.2455216 with those of other AXPs that showed a similar behavior.
A large glitch () was detected from 1E 2259586, nearly simultaneously with several intense (total fluence of erg cm-2) and short SGR-like bursts (Woods et al. 2004, Kaspi et al. 2003). Our Swift and XMM-Newton coherent timing solution of CXOU J164710.2455216 implies that an even larger glitch () occurred within 0.8 days from the burst epoch. The glitch was more than one order of magnitude larger than previous glitches detected from AXPs, or any other type of pulsar. This holds true even considering the minimum value of the residual component of the spin–up for a possible long-term glitch recovery component. The glitch effects () were recovered for the most part over less than 2 days, although the exponential component was still detectable after one week. In this respect the exponential decay time and its amplitude are, taken separately, within the wide range found for radio pulsars, but they were never observed to occur together (Wong et al. 2001; Hobbs et al. 2002). On the other hand, the combination of quick recovery and large amplitude is similar to that observed in other AXPs/SGRs (Dall’Osso et al. 2003; Woods et al. 2004). We also detected a secular spin-down = 9.2(4) 10-13 s s-1, implying a dipole field strength of Gauss (assuming a neutron star radius of 10 km and a mass of 1.4⊙), a value not dissimilar from that inferred for other AXPs. The long-term recovery of the glitch can be reasonably expected to be characterized by a second derivative of the period, which might be revealed by future monitoring observations of the source (as in the case of 1RXS J170849400910where it was revealed over a 500 day timescale). The detection of such a component would provide a further confirmation of the presence and amplitude of the residual component, especially once the recovery timescale is known (cf. Dall’Osso et al. 2003, 6.3 and references therein). From the energetic point of view we note that whatever was the cause of the burst, the glitch and the outburst, it released approximately 5 1041 ergs during the first 130 days: 0.004% of which has been emitted during the burst, 6% has been stored in the star during the glitch and lost again (either through internal dissipation or emission) within a couple of days. More than 90% of the total went to increase the persistent (mostly unpulsed) emission. Future monitoring observations of the source flux decay until the quiescence level will allow us to quantify the total energy budget of the outburst.
The prompt X-ray afterburst properties of CXOU J164710.2455216 also are amazingly similar to those of 1E 2259586. In fact, in the case of 1E 2259586, a drop in the pulsed fraction was observed together with a change in the pulse shape (from 25% to 15% rms) quickly recovering (within a week) towards the pre-burst shape and pulsed fraction. Similarly, the CXOU J164710.2455216 pulse shape varied from a nearly sinusoidal shape (before the burst) to a double peaked one (after 1 day) and to a triple-peak shape (for epochs later than 2 days), while the pulsed fraction dropped from a value of (as recorded by an XMM-Newton observation few days before the burst) to few hours after the BAT event. Since then the pulsed fraction has been recovering towards its pre-burst value. Moreover, the flux decay of CXOU J164710.2455216 is reminiscent of that of 1E 2259586, e.g. a power-law , with index of –0.280.05 after the first day from the BAT event (compared with the –0.22 in 1E 2259586). It is also apparent that the PL component decayed more rapidly ( index of –0.380.11; 90% uncertainty) than the BB flux ( index of –0.140.10). This implies that the cooling timescale of the hot spots on the neutron star’s surface is longer than that of the region responsible for the power law, likely an active coronal region (used to account for the broadband non-thermal PL component; Beloborodov & Thompson 2006). Regardless of the scenario, the pulsed emission was mainly accounted for by the BB, and the increase of the pulsed fraction in the post-burst phases was caused by the increase in the fractional contribution of the BB flux as the nearly-unpulsed PL component decayed. Further evidence in favor of this comes from the rise in the fractional RMS as a function of time. This was well-fitted by a power-law with index of +0.380.11, which is opposite to the slope of the decay of the amplitude of the power-law component.
The BB component also appears to play an important role in the quiescent state of this AXP, as shown by our PPS study in Section 2.3, where the timing and spectral properties were found consistent with the 100% pulsed component being totally accounted for by the BB component. This very high degree of modulation is consistent with the small size of the region for the BB component, if this originates at the NS surface and is periodically self-eclipsed by rotation. For a typical star of radius km, and a distance of kpc, the angular size BB emitting spot is only a few degrees. Although light-bending effects contribute to substantially suppress the degree of modulation, for a spot of such a small extent there exist geometries for which complete occultation can be achieved for a part of the star rotation (1983; see also Riffert & Meszaros 1988 and Özel 2002; DeDeo et al. 2001).
It is interesting to note that, though formally not required from a statistically point of view, there were indications of the presence of a soft excess in the Chandra spectrum corresponding to the pulse minimum (where the BB from the hot spot is absent; see central panel of Figure 7). By modeling this excess with a BB component we obtained an upper limit of 0.15keV and radius consistent with the NS size. If confirmed by future observations of CXOU J164710.2455216 in quiescence, this latter component might provide evidence for the thermal radiation emitted from the whole NS surface (similar to what we observed in the quiescent spectrum of XTE J1810-197).
One of the main differences (in the intial phases) between the outbursts from CXOU J164710.2455216 and 1E 2259586 is that the quiescent flux component was a factor of 100 larger in 1E 2259586, so that the relative amplitude of the outburst was smaller. In fact, the luminosity of these two sources one day after their respective glitches were the same to within a factor of 2 (1E 2259586 was slightly brighter). In this respect, the outburst properties of the two AXPs are more similar than they would appear at first sight. Indeed, the longer timescales over which the pulsed component rms recovers its initial value in CXOU J164710.2455216 is likely due to the fainter quiescent level of this source with respect to that in 1E 2259586 (where the rms is completely recovered, i.e. it reaches the pre-outburst value, in less than a week).
Particularly relevant is the flare event detected in 2003 from 1E 1048.15937, another historical AXP. A clear anti-correlation between pulsed fraction and intensity of the source was detected and found to be accompanied by relatively small variations in the phase-averaged spectrum (Tiengo et al. 2005). The presence of a hard component was detected in the PPS study at the maximum of the pulses. A monitoring campaign of 1E 1048.15937 carried out by RXTE showed that this phenomenology was also accompanied by a large outburst of the source flux above its previous average value, which lasted for about 2 years. However, no burst was detected close to the outburst onset epoch (Kaspi et al. 2005). In this case the timescale over which the pulsed fraction was recovered was of the order of the outburst duration itself instead of one week (as observed in 1E 2259586). This event has several similarities with the one currently observed in CXOU J164710.2455216.
Finally, it is likely premature to draw possible similarities between the outbursting behavior of CXOU J164710.2455216 during the first month and that of XTE J1810-197, (Ibrahim et al. 2004; Gotthelf et al. 2004; Israel et al. 2004; Rea et al. 2004). Both the timing and spectral properties appear to be different: the pulsed fraction of XTE J1810-197 increased its value from a pre-outburst upper limit of 20% (in the 0.1-2.5 keV band) to a 1-10 keV measurement of 53% after about one year, and decreased since then. Moreover, the quiescent spectrum differed, in that it was dominated by a very soft and extended BB in XTE J1810-197, and by a relatively hard and especially small radius BB in CXOU J164710.2455216. These differences may result from different viewing angles of and/or different burst emitting regions.
4 Conclusions
On September 21, 2006, the candidate AXP CXOU J164710.2455216 emitted a short and rather intense burst that was promptly detected by the Swift BAT. Together with the burst, large changes in the timing and spectral properties of the persistent component were detected and seen evolving during the subsequent weeks. In particular, the Swift XRT monitoring (plus two proprietary XMM-Newton and two archival Chandra observations) allowed us to find the following:
-
•
The pulse phase evolution is consistent with the occurrence of a large glitch (), the largest ever detected from a neutron star. The glitch was recovered over a timescale of 1.4 d, though its effects were present in the pulse phases until approximately one week after the glitch epoch. We also detected a quadratic component in the pulse phases corresponding to a s s-1.
-
•
The first 1-10 keV Swift XRT spectrum was measured 13 hours after the burst detection and showed, in addition to a keV blackbody ( km), a power-law component accounting for about 50% of the observed flux.
-
•
The flux decay of CXOU J164710.2455216 is well described by the function , with index of –0.280.05 (similar to the case of the 2002 1E 2259586 burst-active phase). Moreover, we found that the PL component decays more rapidly (index of –0.380.11; 90% uncertainty) than the BB flux (index of –0.140.10).
-
•
The pulsed fraction of the 10.61 s pulsations was seen to drop from a value of (as recorded by an XMM-Newton observation a few days before the burst) to a few hours after the BAT event. The spectral and timing analysis clearly show that only the blackbody component is responsible for the pulsed flux (at least during the initial phases of the outburst).
-
•
Archival Chandra data analysis revealed that the modulation in quiescence is 100% pulsed at energies above 4 keV and consistent with the (unusually small-size) blackbody component being occulted by the neutron star as it rotates.
-
•
A comparison of the properties of CXOU J164710.2455216 with those of other AXPs which showed similar behaviour confirmed that outbursting events of this kind are more common than previously thought.
All these results confirmed unambiguously that CXOU J164710.2455216 is a transient and bursting AXP, showing an unusually high pulsed fraction level in quiescence. Studying how the source will return from its post-burst/glitch timing and spectral properties to the quiescent ones might help revealing the mechanisms behind the outbursts of AXPs. Finally, the BAT detection of bursts from CXOU J164710.2455216 opens a new perspective for detecting bursts from known AXPs, and for identifying new AXPs/SGRs with Swift.
References
- Beloborodov (2006) Beloborodov, A.M. & Thompson, C. 2006, ApJ, in press (astro-ph/0602417)
- Burgay et al. (2006) Burgay, M., Rea, N., Israel, G.L., & Possenti, A. 2006, The Astronomer’s Telegram, 903
- Camilo et al. (2006) Camilo, F., Ransom, S. M., Halpern, J. P., Reynolds, J., Helfand, D. J., Zimmerman, N., & Sarkissian, J. 2006, Nature, 442, 892
- Campana & Israel (2006) Campana, S., & Israel, G. L. 2006, The Astronomer’s Telegram, 893
- Cusumano et al. (2005) Cusumano, G., et al. 2005, Proc. SPIE, 5898, 377
- Dall’Osso et al. (2003) Dall’Osso, S., Israel, G. L., Stella, L., Possenti, A., & Perozzi, E. 2003, ApJ, 599, 485
- DeDeo et al. (2001) DeDeo, S., Psaltis, D., & Narayan, R. 2001, ApJ, 559, 346
- Duncan & Thompson (1992) Duncan, R. C., & Thompson, C. 1992, ApJ, 392, L9
- Gavriil et al. (2002) Gavriil, F. P., Kaspi, V. M., & Woods, P. M. 2002, Nature, 419, 142
- Gavriil et al. (2004) Gavriil, F. P., Kaspi, V. M., & Woods, P. M. 2004, ApJ, 607, 959
- Gotthelf et al. (2004) Gotthelf, E. V., Halpern, J. P., Buxton, M., & Bailyn, C. 2004, ApJ, 605, 368
- Gotthelf & Halpern (2005) Gotthelf, E. V., & Halpern, J. P. 2005, ApJ, 632, 1075
- Gotz et al. (2006) Gotz, D., et al. 2006, The Astronomer’s Telegram, 953
- Hill et al. (2004) Hill, J. E., Burrows, D. N., Nousek, J. A., et al. 2004, Proc. SPIE, 5165, 217
- Hobbs et al. (2002) Hobbs, G., et al. 2002, MNRAS, 333, L7
- Ibrahim et al. (2004) Ibrahim, A. I., et al. 2004, ApJ, 609, L21
- Israel & Stella (1996) Israel, G. L., & Stella, L. 1996, ApJ, 468, 369
- Israel et al. (2004) Israel, G. L., et al. 2004, ApJ, 603, L97
- Israel & Campana (2006) Israel, G. L., & Campana, S. 2006, The Astronomer’s Telegram, 896
- Israel et al. (2006) Israel, G. L., Dall’Osso, S., Campana, S., Muno, M., & Stella, L. 2006, The Astronomer’s Telegram, 932
- Kaspi et al. (2000) Kaspi, V. M., Lackey, J. R., & Chakrabarty, D. 2000, ApJ, 537, L31
- Kaspi et al. (2003) Kaspi, V. M., Gavriil, F. P., Woods, P. M., Jensen, J. B., Roberts, M. S. E., & Chakrabarty, D. 2003, ApJ, 588, L93
- Kaspi et al. (2006) Kaspi, V., Dib, R., & Gavriil, F. 2006, The Astronomer’s Telegram, 794, 1
- Kaspi (2006) Kaspi, V. 2006, in ”Isolated Neutron Stars: From the Interior to the Surface” eds. S. Zane, R. Turolla, D. Page; Astrophysics & Space Science in press (astro-ph/0610304)
- (25) Krimm, H., et al. 2006, GCN Circular 5581
- Mereghetti & Stella (1995) Mereghetti, S., & Stella, L. 1995, ApJ, 442, L17
- Muno et al. (2006) Muno, M. P., et al. 2006, ApJ, 636, L41
- Muno et al. (2006b) Muno, M. P., et al. 2006b, ApJ, submitted
- Muno et al. (2006) Muno, M., Gaensler, B., Clark, J. S., Portegies Zwart, S., Pooley, D., de Grijs, R., Stevens, I., & Negueruela, I. 2006, The Astronomer’s Telegram, 902
- Özel (2002) Özel, F. 2002, ApJ, 575, 397
- Paczyński (1992) Paczyński, B. 1992, Acta Astronomica, 42, 145
- Pechenick et al. (1983) Pechenick, K. R., Ftaclas, C., & Cohen, J. M. 1983, ApJ, 274, 846
- Rea et al. (2004) Rea, N., et al. 2004, A&A, 425, L5
- Rea et al. (2005) Rea, N., Tiengo, A., Mereghetti, S., Israel, G. L., Zane, S., Turolla, R., & Stella, L. 2005, ApJ, 627, L133
- Riffert & Meszaros (1988) Riffert, H., & Meszaros, P. 1988, ApJ, 325, 207
- Skinner et al. (2006) Skinner, S.L., Perna, R., & Zhekov, S.A. 2006, ApJ, 653, 587
- Thompson & Duncan (1995) Thompson, C., & Duncan, R. C. 1995, MNRAS, 275, 255
- Tiengo et al. (2005) Tiengo, A., Mereghetti, S., Turolla, R., Zane, S., Rea, N., Stella, L., & Israel, G. L. 2005, A&A, 437, 997
- Wang et al. (2006) Wang, Z., Kaspi, V. M., Osip, D., Morrell, N., Kaplan, D. L., & Chakrabarty, D. 2006, The Astronomer’s Telegram, 910
- Wong et al. (2001) Wong, T., Backer, D. C., & Lyne, A. G. 2001, ApJ, 548, 447
- Woods & Thompson (2004) Woods, P., & Thompson, C. 2004, in ”Compact Stellar X-ray Sources”, eds. W.H.G. Lewin & M. van der Klis, astro-ph/0406133
- Woods et al. (2004) Woods, P. M., et al. 2004, ApJ, 605, 378
- Woods et al. (2005) Woods, P. M., et al. 2005, ApJ, 629, 985
- Woods et al. (2006) Woods, P. M., Kaspi, V. M., Gavriil, F. 2006, The Astronomer’s Telegram, 929


| Sequence ID | Obs/Mode | Start time (TDB) | End time (TDB) | Exposure |
|---|---|---|---|---|
| (yyyy-mm-dd hh:mm:ss) | (yyyy-mm-dd hh:mm:ss) | (s) | ||
| 00230341000aaBAT trigger. | BAT/EVENT | 2006-09-21 01:34:11 | 2006-09-21T01:34:54 | 43 |
| 00030806001 | XRT/WT | 2006-09-21 14:29:13 | 2006-09-21 22:10:33 | 1919.9 |
| 00030806001 | XRT/PC | 2006-09-21 14:29:29 | 2006-09-21 22:27:44 | 7736.6 |
| 00030806002 | XRT/WT | 2006-09-22 14:38:22 | 2006-09-22 14:51:10 | 766.9 |
| 00030806003 | XRT/WT | 2006-09-22 19:39:09 | 2006-09-23 05:04:12 | 4910.0 |
| 00030806003 | XRT/PC | 2006-09-22 19:39:17 | 2006-09-23 01:44:13 | 1765.6 |
| 00030806004 | XRT/WT | 2006-09-26 06:36:51 | 2006-09-26 11:35:03 | 1250.0 |
| 00030806004 | XRT/PC | 2006-09-26 08:12:58 | 2006-09-26 11:42:46 | 2482.3 |
| 00030806006 | XRT/WT | 2006-10-02 11:04:54 | 2006-10-02 17:09:01 | 1977.6 |
| 00030806007 | XRT/WT | 2006-10-03 12:19:42 | 2006-10-03 14:12:54 | 2034.1 |
| 00030806008 | XRT/WT | 2006-10-05 23:59:24 | 2006-10-06 01:48:39 | 2158.9 |
| 00030806009 | XRT/WT | 2006-10-09 17:51:53 | 2006-10-09 22:51:11 | 3521.8 |
| 00030806010 | XRT/WT | 2006-10-10 00:09:50 | 2006-10-10 02:13:09 | 2829.4 |
| 00030806011 | XRT/WT | 2006-10-15 05:38:04 | 2006-10-15 12:21:36 | 5617.9 |
| 00030806012 | XRT/WT | 2006-10-21 02:56:44 | 2006-10-21 08:07:58 | 5508.0 |
| 00030806013 | XRT/WT | 2006-10-27 16:10:55 | 2006-10-27 19:42:44 | 2816.6 |
| 00030806014 | XRT/WT | 2007-01-19 04:05:59 | 2007-01-19 06:00:28 | 2051.8 |
| 00030806015 | XRT/WT | 2007-01-22 01:07:57 | 2007-01-22 04:44:42 | 3817.7 |
| Spectral | Pulse Phase Interval | |||
|---|---|---|---|---|
| Parameter | A | B (minima) | C | D (maxima) |
| NH (cm-2) | Fixed at phase-averaged value of 1.9 | |||
| (keV) | 0.500.02 | 0.15 | 0.650.15 | 0.540.02 |
| RBB (km @ 5kpc) | 0.4 | 20 | 0.20.1 | 0.440.06 |
| PL | Fixed at phase-averaged value of 3.5 | |||
| () | 1.180.18 | 0.07 | 0.170.03 | 2.410.36 |
| 0.9 by fitting the 4 spectra together | ||||