Models of Vertically Stratified Two-Phase ISM Disks with MRI-Driven Turbulence
Abstract
We have performed time-dependent numerical simulations of the interstellar medium (ISM) which account for galactic shear and magnetic fields, vertical gravity, and a radiative cooling function for atomic gas. This allows us to study the magnetorotational instability (MRI) in cloudy, vertically-stratified disks. As in previous unstratified models, we find that thermal instability interacts with MRI-driven turbulence and galactic shear to produce a network of cold, dense, filamentary clouds embedded in a warm diffuse ambient medium. This structure strongly resembles the morphology of HI gas observed in the 21 cm line. There is significant thermally-unstable gas, but the density and temperature distributions retain the twin peaks of the classical two-phase ISM. Independent of the total gas surface density and vertical gravity levels adopted, the midplane ratios of thermal to magnetic pressure are , when the mean vertical magnetic field is . We analyze the vertical distributions of density and various pressure terms, and address what supports the ISM vertically. All models become differentially stratified by temperature; only when the cold mass fraction is small does turbulent mixing maintain a large cold-medium scale height. Turbulent velocities of the cold gas also increase as the cold mass fraction decreases, but are generally low () near the midplane; they increase to at high . Turbulent amplitudes are higher in the warm gas. The central thermal pressure is similar for all models even though the total weight varies by a factor 7 for a range of imposed vertical gravity; in higher gravity models the increased weight is supported by increased magnetic pressure gradients. Approximate vertical equilibrium holds for all models. Finally, we argue that in the outer parts of galactic disks, MRI is likely able to prevent the development of self-gravitating instabilities and hence suppress star formation, even if cold gas is present.
1 Introduction
The classical picture of the ISM began to take shape with Field’s work on thermal instability (1965), and subsequently the realization that for realistic heating and cooling functions the atomic ISM could exist in two distinct stable phases in pressure equilibrium (Field et al., 1969). McKee & Ostriker (1977) argued that supernovae (SNe) transform the ISM, allowing for variations in pressure, driven turbulence, and a hot component formed by SNe blast waves that overrun a significant fraction of the volume. Many elements of this “three-phase” model are still being scrutinized by both observers and theoreticians today. For understanding the ISM’s thermodynamics, perhaps the most important development in more recent years is that both observations and simulations have found large fractions of gas to exist at temperatures which are thought to be thermally unstable. This calls into question whether or not a two or three phase model of the ISM is valid, and more generally how thermal and dynamical processes interact in the ISM.
Surveys of the HI 21cm line have shown that the ISM is very turbulent. Typical turbulent velocities are found to be approximately (Heiles & Troland, 2003; Mohan et al., 2004). In the traditional picture of the ISM, the source of turbulence is attributed to SNe (Spitzer, 1978). Many simulations have been performed which explore the effects of SNe on the ISM, with increasingly complex methods used for incorporating star formation (e.g. de Avillez & Breitschwerdt (2004, 2005); Slyz et al. (2005)). Most simulations have looked only at SNe rates equal to or above what is thought to be typical of the Milky Way. However, Dib & Burkert (2005) find that for SNe rates lower than half of the mean Galactic rate, the velocity dispersions fall short by a factor of 2–3 compared to typical observed values. Since low turbulence disks containing cold gas may be susceptible to violent gravitational instabilities, this suggests a source of (kinetic and/or magnetic) turbulence other than SNe may be needed to self-consistently explain ISM conditions in the outer Milky Way – and other galaxies – where there is little star formation.
Various extragalactic observations have also implied that sources of turbulence other than SNe may be present. In external galaxies, the ISM appears to be turbulent regardless of whether an active star forming region is nearby. In NGC 1058, spiral arm and interarm regions have indistinguishable HI velocity dispersions (Dickey et al., 1990)), and turbulence levels in outer galaxies are comparable to those in inner galaxies, even though star formation rates drop off steeply (van Zee & Bryant, 1999).
These results have led us to explore another of the physical mechanisms which has potential to drive turbulence in the ISM. Among candidate mechanisms, perhaps the most viable in the outer parts of galaxies (where self-gravity is weak) is the magneto-rotational instability (MRI) (Fricke, 1969; Balbus & Hawley, 1991; Hawley & Balbus, 1991). The MRI may also contribute significantly in inner galaxy regions. In the past decade the MRI has been studied extensively in the context of accretion disks surrounding compact objects and protostars (e.g. Stone et al. (2000); Balbus (2003)). The MRI generates turbulent velocities and amplifies magnetic fields in magnetized, shearing disk systems, which leads to the transport of angular momentum outward through the disk, allowing matter to accrete toward the center. Galactic disks meet the basic requirements for the MRI to be present: a moderate magnetic field and decreasing angular velocity with increasing radius. Sellwood & Balbus (1999) suggested that turbulence in outer disks may be driven by the MRI.
Previous single-phase simulations of MRI in the context of galactic disks have been performed by Kim et al. (2003) (local models) and Dziourkevitch et al. (2004) (global models). We have addressed the issue of MRI in multiphase gas with direct numerical simulations, beginning with Piontek & Ostriker (2004) (hereafter Paper I), in which we performed two dimensional computations in the radial-vertical plane. These models were local, and utilized a linear galactic shear profile and shearing-periodic boundary conditions, a radiative cooling function which allowed for a two phase medium, and magnetic fields. Our two dimensional models were extended to three dimensions in Piontek & Ostriker (2005) (hereafter Paper II), allowing us to study late time evolution, as two dimensional simulations do not (and cannot) yield saturated state turbulence. We found in Paper II that the saturated state velocities can reach as high as in two-phase simulations with a mean density , which is comparable to the low values found in the outer Galaxy. Turbulent velocity amplitudes were found to scale with mean density as , while the saturated-state magnetic field strength was independent of , with plasma within each phase.
In this paper we extend the simulations of Paper II to include vertical gravity, thus allowing for stratification of the disk to develop. This enables us to address a longstanding question in studies of the ISM, namely, how is the gas vertically supported against gravity? Potentially, vertical support can be provided by thermal pressure, kinetic (ram) pressure, and magnetic stresses (and indirectly by cosmic-ray pressure). Boulares & Cox (1990), for example, argue that kinetic, magnetic, and cosmic ray terms contribute nearly equally to the vertical support of the gas. With a multiphase, cloudy medium, however, the dynamics of vertical support must be quite complex, and in particular the various components may be unequally supported and hence become differentially stratified. For atomic gas, investigations in the 1970’s indeed suggested that the cold HI component of the disk is signficantly thinner than the warm HI component (Falgarone & Lequeux, 1973; Baker & Burton, 1975). While an updated observational evaluation of the differential HI stratification would be very valuable, it is equally important to address the theoretical issue with modern, numerical methods. As we shall show with our simulations, cold and warm gas become differentially stratified, with high density cold clouds preferentially sinking towards the mid-plane. We find that the degree of differential stratification depends on the relative proportions of cold and warm gas.
In this work, we address a number of issues, many of which were not possible with the models presented in Paper II. What fraction of the ISM is found to exist in each of the warm, cold, and thermally unstable phases when turbulence is driven by the MRI? What is the vertical profile in a self-consistent turbulent system, and what fraction of vertical support is provided by thermal, kinetic, and magnetic stresses? Can turbulence driven by the MRI provide the necessary effective pressure to reproduce the observed scale height of the galactic disk? How do turbulent (kinetic and magnetic) amplitudes of stratified models compare with previous unstratified simulations, in particular for conditions that prevail in the outer, non-star-forming regions of galactic disks? To explore dependence on parameters, we address these (and other) questions by performing three simulations with fixed surface density which differ in the strength of gravity by a factor of sixteen, and an additional outer-disk model with low surface density and low gravity.
2 Numerical Methods and Model Parameters
We solve the equations of ideal MHD in a local model representing sheared rotating flows, with additional terms for radiative heating and cooling, heat conduction, and gravity in the vertical direction:
| (1) |
| (2) |
| (3) |
| (4) |
All symbols have their usual meanings. Rotational shear is described in terms of the dimensionless shear parameter , where is set to one to model a flat galactic rotation curve. We model the gravitational force as a linear function of height (assuming the gas scale height is smaller than most of the total mass),
| (5) |
The cooling function, , is adopted from Sánchez-Salcedo et al. (2002), and is a piecewise power-law fit to the data of Wolfire et al. (1995). The heating rate, , is spatially constant, modeling heating due primarily to the photo-electric effect of UV starlight on small grains and PAHs. This cooling function allows for two stable phases of gas, warm and cold, to coexist in pressure equilibrium. For the adopted cooling curve parameters, the minimum and maximum pressures for cold and warm stable equilibria, respectively, are and . Based on the transition temperatures in our adopted cooling curve, cold gas is defined to be below 141 , warm gas above 6102 , and unstable gas between these two temperatures. The conduction coefficient is set so that we can numerically resolve the length scales of thermal instability, with (this is larger than the realistic level of conduction in the ISM, but as discussed in Paper I the value does not affect our late-time results). Without conduction, TI would be most unstable at the grid scale.
We use a modified version of the ZEUS MHD code (Stone & Norman, 1992a, b) to integrate equations (4.1) - (4.4) in time. ZEUS is a finite difference, operator split, time-explicit method for solving the equations of MHD. Shocks are captured via an artificial viscosity. Paper I gives a complete description of our numerical implementation of heating, cooling, and conduction, as well as code tests. The same basic methods were used in Paper II, for a version of the code parallelized with MPI. The majority of the simulations presented here were run on the Thunderhead cluster at Goddard Space Flight Center, while others were run on the cluster at the Center for Theory and Computation at the University of Maryland.
The primary difference between the numerical approach here and that of Paper II is the addition of the gravity term in equation (2), which leads to vertical density stratification. We have made use of a density floor in order to prevent the time step from becoming prohibitively short, and also applied the Alfvén limiter of Miller & Stone (2000). The density floor was set to , and in our high surface density runs. For our outer galaxy model, which has a larger vertical extent than other models, the density floor was reduced to . The effect of the Alfvén limiter is essentially to limit the speed of MHD waves in a low density environment.
The use of a density floor has the undesired effect of increasing the total mass contained in the simulation domain over time. The total mass in our simulations increases by 60 – 70% over the course of the whole run (10 orbits). We attempted to assess the significance of this by reducing the density floor. This leads to a reduction in the time step in order to satisfy the Courant condition, however, so that the total number of numerical steps taken over a given physical time increases; thus lowering the density floor had little effect on the net increase in mass. Limitation of computational resources prohibits us from performing a comparison simulation without a density floor. In the following section we plot quantities such as mass fractions, turbulent velocities, and pressure as a function of time. These do not show any significant trends, indicating that the increase in the total mass due to the density floor is not seriously affecting our results. Furthermore, since the total fractional mass increase is almost the same for all models, their relative global parameters are the same as in the initial conditions.
Shearing-periodic boundary conditions are used in the radial () direction (Hawley & Balbus, 1992; Hawley et al., 1995; Stone et al., 1996), while periodic boundary conditions are used in the azimuthal () and vertical () directions. Though the use of periodic boundary conditions in the vertical direction is not ideal, it offers some advantages compared to outflow boundary conditions, which we also explored. Depending on the implementation of outflow boundary conditions, they may or may not maintain the divergence free constraint of the magnetic field. Outflow boundaries can also create strong unphysical magnetic forces as magnetic flux is advected through the boundary and field lines are “cut” (Stone et al., 1996). Our simulations with outflow boundaries also lost significant amounts of mass over the course of the simulations. However, we have verified that the important features of our simulations are the same regardless of the choice of vertical boundary conditions.
The simulations are initialized with an isothermal disk in vertical gravitational equilibrium; thus the initial profiles are Gaussian. The parameter space explored by our models is summarized in Table 1. For our standard model, the initial temperature of the disk is , the mid-plane density is , and the scale height, , is 150 pc. The total gas surface density is therefore . To explore the effect of gravity we also performed a high gravity model, as well as a low gravity model, respectively increasing and decreasing by a factor 4. The values of the gravity constant are , , and . To obtain the same initial mid-plane density and scale height as the standard model, and hence the same value of , the initial disk temperatures in the low- and high-gravity models were set to and , respectively.111After cooling is initialized at orbits the temperatures and pressures in these three models evolve to be roughly the same. We adopt as the unit of pressure in the code; we use this value of to normalize the pressure in a number of the figures. The central density and surface density were chosen to be generally consistent with estimated ranges near the Solar radius in the Galaxy. The largest value of is comparable to the estimated value near the Solar radius using , for the combined (stars + gas) mid-plane density (Holmberg & Flynn, 2000). The lowest gravity model is representative of outer-galaxy conditions (see below).
The magnetic field is initially vertical, with a plasma beta parameter for the standard model. In the high and low gravity runs was adjusted so that the initial magnetic field strength was the same as in the standard model. 222This initial vertical magnetic field strength, , is comparable to the local estimated vertical magnetic field of (Han & Qiao, 1994); the mean vertical magnetic field is constant in our simulations, due to imposed boundary conditions. Random white noise perturbations are added at the 1% level to seed the MRI. Cooling is not turned on until orbits, just as the MRI modes begin to become non-linear. Most simulations last approximately 10 orbits, with one orbit set equal to 240 Myrs. The size of the computational volume is (for pc the initial scale height), with 128 128 384 grid zones, giving a resolution of 2.3 pc.
We performed an additional simulation with a lower initial surface density of , to explore how MRI would behave under conditions more representative of outer galaxies. The gravity constant is the same as that of the low-gravity model described above (which is comparable to the level that would be provided without a stellar disk). In this model the initial scale height of the isothermal disk was increased to 300 pc, with a corresponding initial temperature of . The initial mid-plane density was set to . The initial magnetic field strength and configuration were identical to the previously-described models.
A final set of five simulations were performed to assess the importance of two important parameters: the initial magnetic field strength and the box size. These models were all run at half the linear resolution of our standard model. The control simulation, BOX1, is otherwise identical to the standard model, and serves as a point of comparison to assess the impact of reducing the resolution. In models BOX2 and BOX4 we increased the box size in both the X and Y directions by a factor of 2 and 4, respectively, and also increased the number of grid points by the same factor so the linear resolution is unchanged. The final two models, MAG1 and MAG2, are identical to BOX1 and BOX2, but have an initial magnetic field strength of , or .
In order to address the question of what supports the gas vertically in our turbulent disk models, and how much of each phase is present, we need a baseline for comparison. For this comparison we have performed (two dimensional) simulations which do not include magnetic fields, and therefore do not develop MRI-driven turbulence. Cooling is initialized at , and the gas quickly separates into two stable phases. The cold component settles to the mid-plane, with the warm gas found above and below the cold gas in pressure equilibrium with gravity. Both the warm and cold gas lie essentially on top of the thermal equilibrium curve in the plane. The warm and cold components are separated by a thin layer of unstable gas, and there is little mixing between the two stable phases. We performed four non-turbulent simulations, varying the initial temperature of the disk and , as in the turbulent models; all initial conditions other than are the same as adopted in the corresponding turbulent models.
For all the non-turbulent models, the pressure at the point where the gas makes a warm/cold transition is . This is close to the value which defines the minimum on the cold branch of the thermal equilibrium curve. Since the cold medium has a very small scale height, the warm/cold transition occurs very close to the midplane. As a consequence, the warm medium has a total surface density close to that of an isothermal layer with central pressure ; i.e.
| (6) |
where is the sound speed typical of the warm medium near . The cold medium must contain the balance of the total surface density present, . Thus, for the models with low, medium, and high gravity, the predicted warm fractions for the non-turbulent two-layer case with would be 0.48, 0.24, and 0.12, respectively. For the outer-disk model, the predicted warm fraction for a non-turbulent disk would be 0.79.
3 Results
3.1 Evolution
From to approximately orbits the disk is in pressure and gravitational equilibrium, with both heating and cooling disabled until this time. This method of initialization prevents the creation of a very thin cold disk, as would occur if the cooling function were initialized at . During these first few orbits the modes of the MRI begin to grow and strengthen from the small amplitude perturbations imposed in the initial conditions. At around orbits the modes of the MRI begin to saturate due to nonlinear interactions, at which point the cooling function is enabled. The disk then undergoes thermal instability and rapidly evolves into a two-phase medium which is no longer in vertical gravitational equilibrium. The heavier cold clouds quickly sink towards the mid-plane, but kinetic and magnetic turbulence driven by the MRI limits this settling (somewhat). Some of the largest turbulent amplitudes are seen during this stage as the channel flow forms, and then quickly breaks up. A quasi-steady state is soon established, after which time the averaged mass fractions, turbulent velocities, magnetic field strengths, and other quantities are fluctuating, but remain roughly constant.
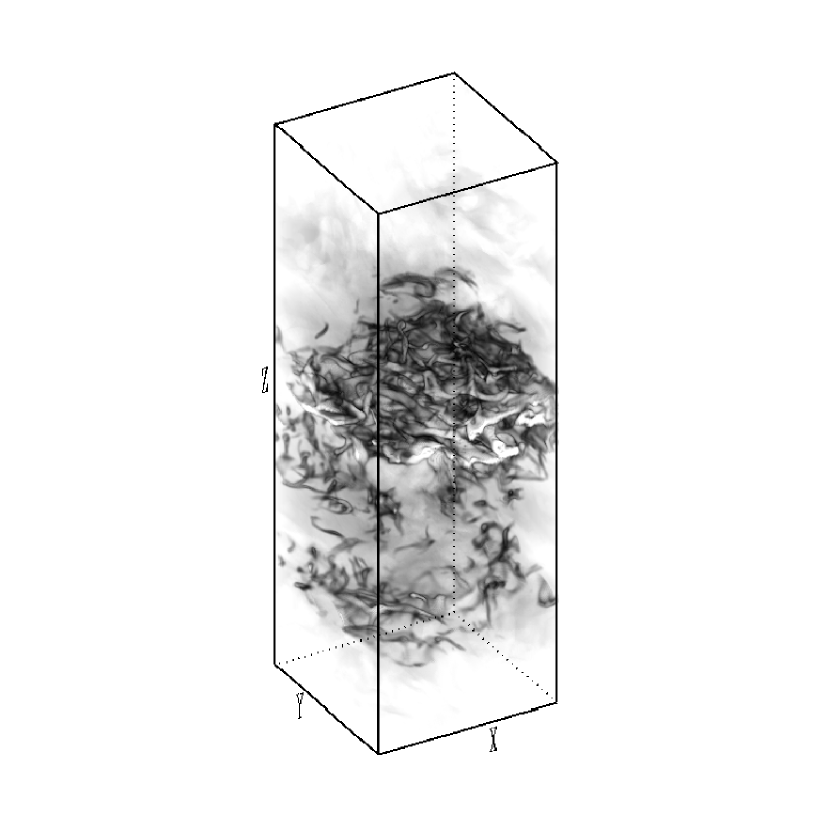
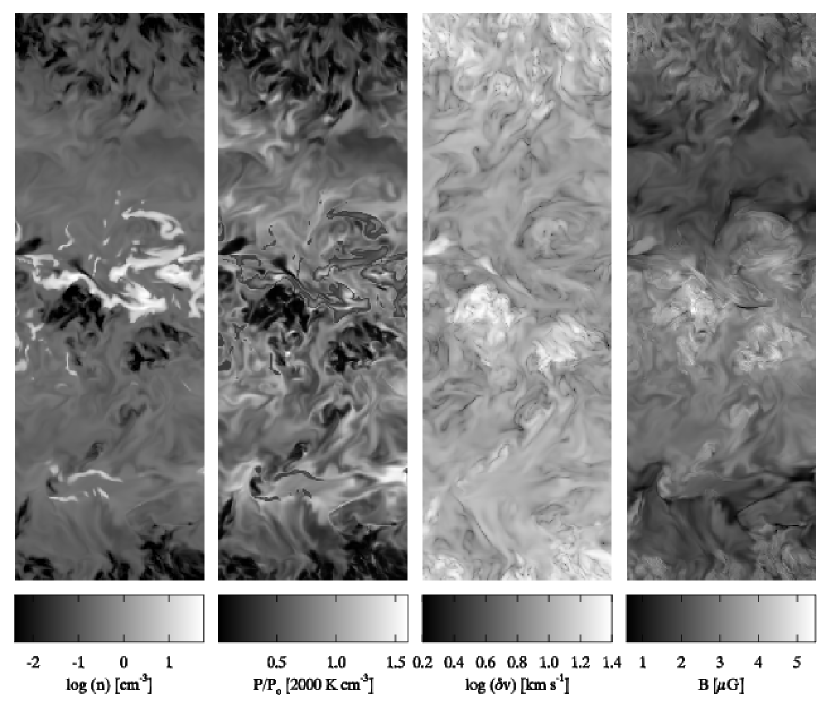
The MRI continues to drive turbulence throughout the duration of the simulation. In Figure 1 we show a volume rendering of density for our standard model late in the simulation at orbits. Though these simulations are stratified, the overall character of these models evidently appears similar to those presented in Paper II. In particular, the high density clouds are generally quite filamentary in character. In Figure 2 we show slices through the computational volume of the field variables: density, pressure, velocity, and magnetic field. Notice that while most of the high density gas is located near the midplane, there are still some high-density structures at large . Also evident in the midplane are regions of quite low density and thermal pressure where the magnetic fields and velocities are large.
The high-gravity and low-gravity models evolve similarly to the standard model. The evolution of our outer galaxy model differs from these in one important respect. When cooling is enabled at orbits, cold gas does not immediately form, because ambient pressures are not high enough. Only after the modes of the MRI have grown significantly are turbulence-induced compressions able to force gas into the cold, high density state. Initially this occurs throughout the simulation domain, at both low and high latitudes. Over time, however, the cold medium settles to the mid-plane.
In the following sections we analyze the turbulent velocities, magnetic fields, pressure, and thermal structure of the gas. We discuss the time history of averaged quantities, as well as presenting probability distribution functions of thermal and magnetic pressure, temperature, and density. In addition, we analyze the vertical structure of our models, considering the question of how material is supported against gravity. Throughout, we make comparisons among results of models with varying .
3.2 Turbulent velocities
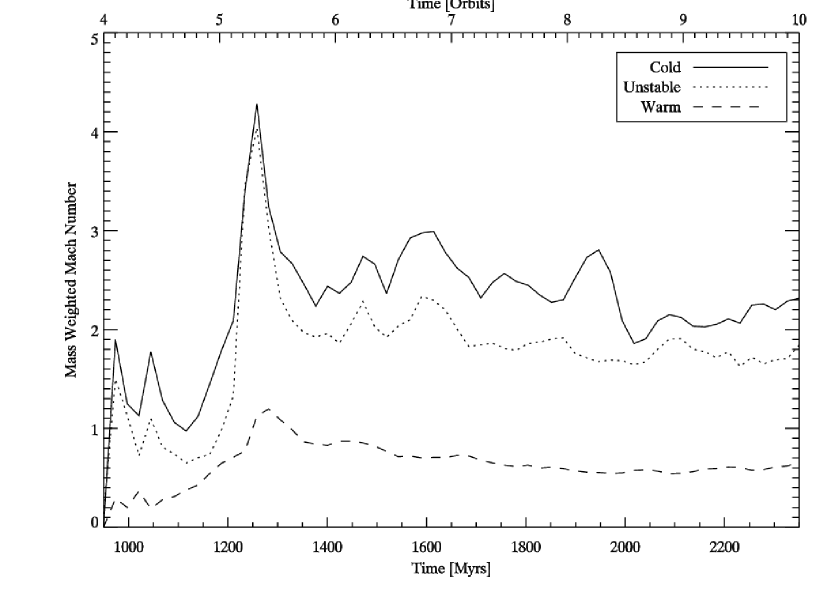
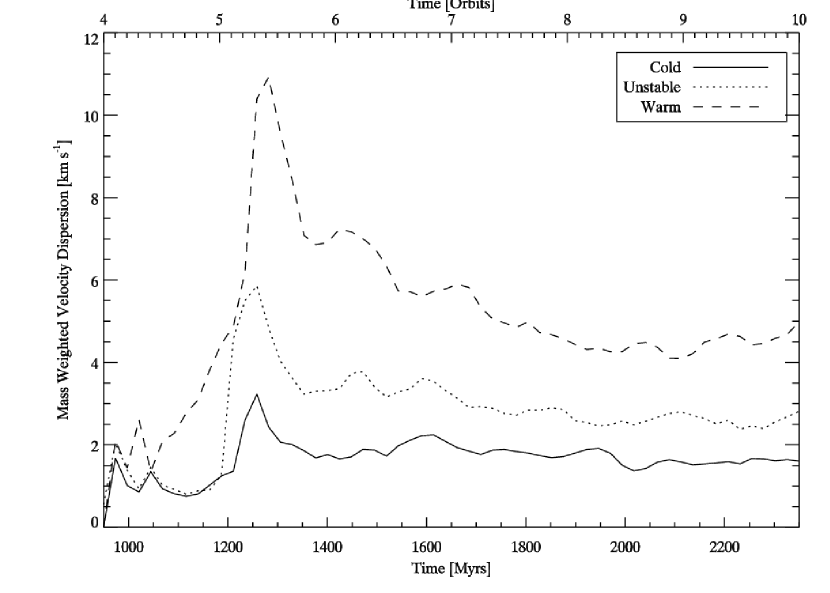
The mass-weighted RMS Mach numbers are plotted in Figure 3, from orbits for the standard run (cooling is disabled prior to orbits). The isothermal sound speed is computed individually for each grid zone, and the galactic shear component is subtracted from the azimuthal velocity as so that . The saturated state Mach numbers for the warm, intermediate and cold phases of gas, averaged over orbits 8–10, are 0.6, 1.7 and 2.2 for the standard model. In Figure 4 we plot the corresponding mass-weighted velocity dispersions for each of the three components; the time averaged values are 4.4, 2.6, and 1.6 , averaged over the same interval. The largest velocities (up to ) are observed when the MRI channel solution is strongest, at orbits.
In the high gravity model, the respective mass-weighted velocity dispersions are 6.5, 2.8, and 1.4 , for the warm, intermediate, and cold phases; in the low gravity model they are 4.9, 2.9, and 1.7 ; and the outer galaxy model they are 6.6, 3.3, and 2.5 . There is therefore little difference in the velocity dispersions of cold and intermediate-temperature gas between the three high surface density models, even though the vertical gravity varies by a factor 16. The velocity dispersions of warm gas vary slightly more, but still by only . The velocity dispersions are somewhat larger in the outer galaxy model, most noticeably in the cold medium.
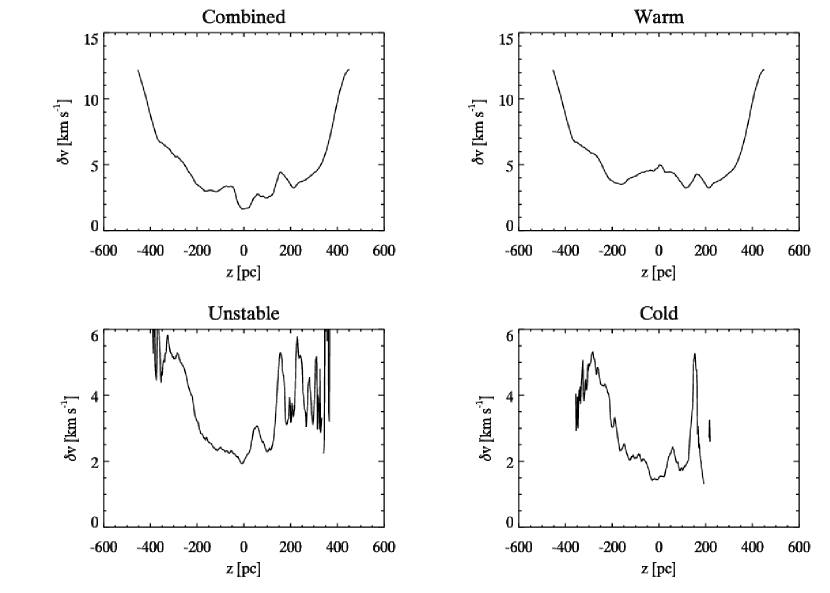
For the standard model, Figure 5 shows the late-time ( orbits) mass-weighted velocity dispersion profile in for the warm, unstable, and cold components separately (i.e. as a function of ), as well as for the combined medium. For the warm medium, generally increases with height, and reaches nearly near the boundary of the simulation domain. This increase with height simply reflects the (exponential) decrease in density of the gas with height. The low inertia of the high-altitude gas allow magnetic stresses to accelerate it to very high speeds. Note that the velocity dispersions of cold and intermediate-temperature gas are asymmetric at high . The asymmetry in this (and similar) plots is simply due to the relatively small amounts of cooler gas present at these heights, such that the turbulent velocity field is not fully sampled statistically (the warm medium, which samples the velocity field better, yields fairly symmetric profiles).
We can compare the velocity dispersions of the stratified models to those of the unstratified models from Paper II. The total mass weighted velocity dispersions of the low, middle and high gravity models are 2.9, 2.7, and 3.0 , and the mass-weighted mean densities333derived from the profiles of the average density as a function of ; see §3.5. are 1.5, 2.7, and 7.0 , respectively. The outer-galaxy model has mass-weighted velocity dispersion 5.5 and mass-weighted mean density 0.24 . From Paper II we found that the velocity dispersion followed a relationship with for the same initial magnetic field strength as the present models, and density . So, based on the non-stratified model scaling, the velocity dispersion at the corresponding mean densities would be predicted to vary from 2.0 in the low gravity model, to 1.3 in the standard model, to 0.6 in the high gravity model, and to 8.1 in the outer-galaxy model. The values we find for the velocity dispersion are within the same general range as the results from our unstratified models. However, in detail the results from our stratified models do not follow the velocity dispersion scaling with the mean density found in the unstratified models. In fact, this is not surprising given the large variation of mean density with and the nonlinear relationship between and . At high , as pointed out in Paper II, it is expected that the velocity dispersion/density relationship will turn over at velocities comparable to the thermal speed in the warm gas. Thus, we do not expect velocity dispersions to significantly exceed , and based on Figure 5 this is the case.
The numbers presented here illustrate the primary difference between the present simulations and those of Paper II. In the non-stratified models of Paper II the three phases of the ISM were well mixed within the simulation domain, which led to the result that the three phases of gas were found to have essentially the same turbulent velocities. In the current stratified simulations, cold gas is found primarily near the mid-plane, with the low density warm medium dominating the dynamics at higher latitude. For all of our models, turbulent velocities are significantly higher in the low density warm medium than the high density cold medium. Because of the differential stratification of diffuse gas and dense clouds, the large turbulent velocities in the high-latitude warm gas do not serve to drive comparably high turbulence levels near the mid-plane, where most of the cold medium is found. Even at a given height, the velocity dispersions in warm and cold gas differ. Near the midplane ( pc), the velocity dispersion is a factor two or more lower in the cold gas than in the warm gas; this is because warm gas mixes more vertically than the cold gas.
3.3 Magnetic Fields
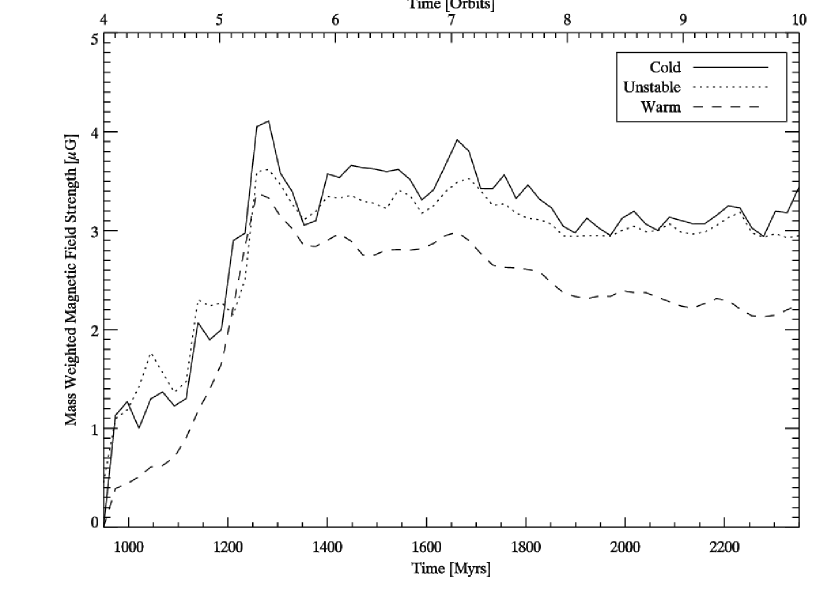
The initial magnetic field strength in all models is , and the field is vertical; due to periodic boundary conditions in the horizontal direction, the value of is unchanged over time. For the standard model, the mass-weighted magnetic field strength, is plotted in Figure 6, as a function of time. Over the course of the simulation, the MRI amplifies the initial field by an order of magnitude. The saturated state field strength is typically , slightly higher in the cold medium, and slightly lower in the warm medium. Averaged over orbits 8–10, the mean field strengths in the warm, unstable, and cold phases are 2.3, 3.0, and 3.1 . In the low gravity model the field strength values are 2.8, 3.0, and 3.1 , and in the high gravity model we find slightly larger means of 2.8, 3.5, and 3.7 , respectively. Magnetic field strengths are slightly lower in the outer galaxy model, where we find 2.1, 2.5, and 2.7 , respectively. Overall, there is much less variation of magnetic field strength with mean density or phase than the variations we find in velocity dispersions. This result is consistent with our findings from our unstratified models, where we also found very little variation in the saturated-state values of . Thus, the saturated-state value of appears to be controlled by the value of the midplane thermal pressure – which, due to the heating and cooling processes involved, is similar for all models.
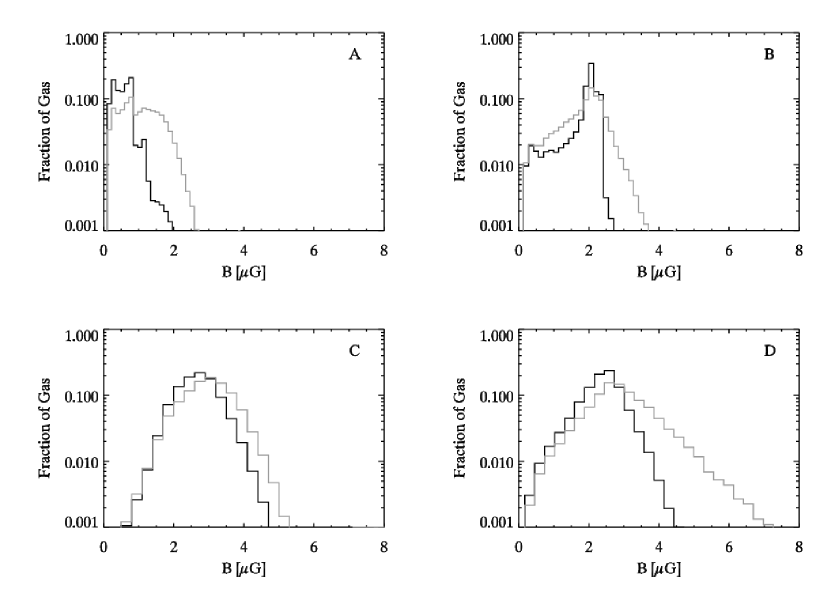
In Figure 7 we show the PDF of the magnetic field strength at , 5.0, 7.5 and 10.0 orbits, for our standard model. The breadth of the PDFs grow with time until 7 orbits. After that point, a tail in the mass-weighted PDF at high -values (up to G) develops, but the volume-weighted PDF as well as the mass-weighted mean remains nearly constant.
3.4 Distributions of Density, Temperature, and Pressure
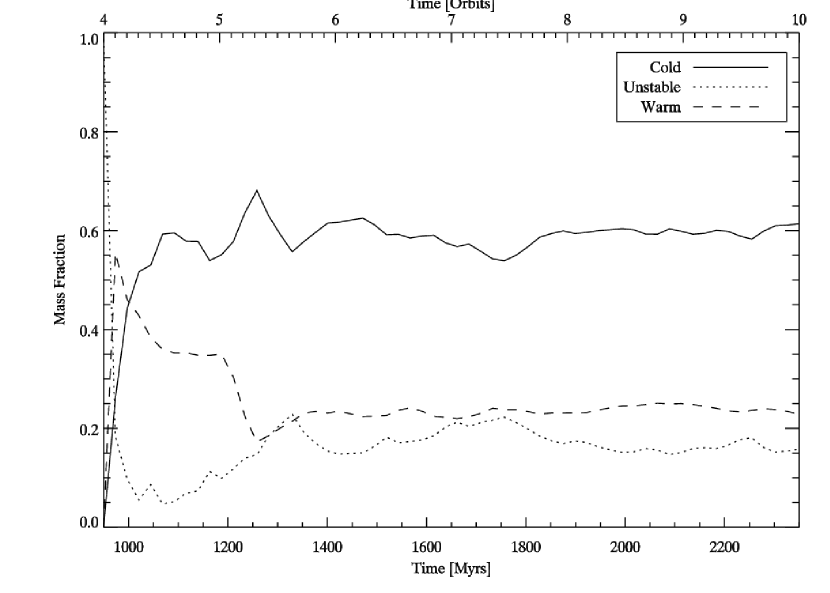
In Figure 8 we plot the mass fractions of the three phases in the standard model as a function of time, from orbits. By mass the warm medium is 24% of the total, with the unstable and cold media providing 16% and 60% of the mass, averaged over orbits 8–10. By volume the warm phase occupies 92%, with the unstable phase about 6% and the cold phase about 2% (this result, of course, depends on the chosen size of the computational box). For comparison, in the high and low gravity models, the mass fractions of warm, unstable, and cold gas are (16,11,73)% and (22,18,60)%, respectively. Thus, the proportions of mass in different phases appears fairly insensitive to . We can contrast this with the results of the non-turbulent comparison models. For those models, the cold mass fraction was 81%, 86%, and 92% for the low, medium, and high gravity models, with the warm fraction making up the balances of 19%, 14%, and 8%, respectively.444Note that while the high- and medium-gravity non-turbulent models have warm fractions generally consistent with the prediction and scaling of equation (6), the low-gravity case has a warm fraction much lower than this equation would predict. This is simply because the distance of 450 pc from the midplane to the top of the computational box is less than the warm medium scale height of 590 pc, so that the volume available for warm gas is limited. Thus, turbulence considerably lowers the fraction of gas found in the cold regime for these high-surface-density models.
For the outer galaxy model model at late times, we find mass fractions of (64,20,16)% for the warm, intermediate, and cold phases, respectively. All of our models are initialized as isothermal and are therefore out of in thermal equilibruim. When cooling is turned on at orbits, depending on the density and temperature, local regions in the disk will either heat or cool towards equilibrium. In the case of the outer galaxy model, unlike the standard model, the low mean surface density and large scale height of the initial distribution yields a medium which exists entirely in the warm regime after cooling is turned on. The initial central pressure is , and this rises quickly to approximately shortly after cooling is enabled, and then decreases somewhat. Later in the simulation, turbulence from the MRI forces some of the gas to condense into the cold phase. For this low surface density model, however, the total mass fraction of cold gas remains low; the warm medium dominates.
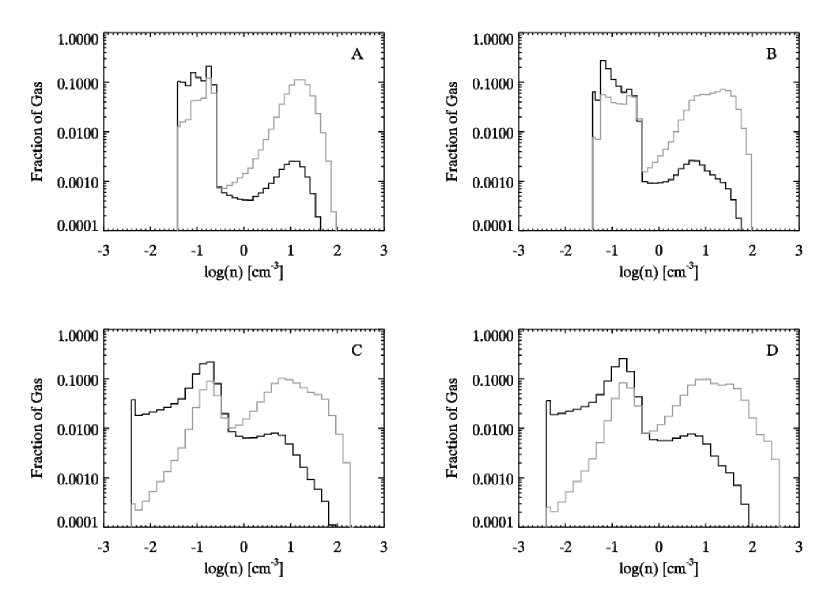
In Figure 9 we plot the density PDF at , 5.0, 7.5, and 10.0 orbits for the standard model. These PDFs indicate the presence of two distinct phases of gas, as there are peaks in the volume-weighted PDF near and a broader peak in the mass-weighted PDF centered on . The minimum density reaches the artificial density floor of 0.004 , while the maximum density can extend upwards of 400 . Overall these PDFs are similar to those of the non-stratified models of Paper II. The main difference in the results of the present models is the tail extending to low densities (due to gravitationally-imposed stratification). The density PDFs for the high- and low-gravity models are similar. Taking into account the large differences in the total mass and volume fractions between the outer galaxy model and the standard model, the density PDFs of the outer galaxy model are also qualitatively similar. The peaks in the distributions corresponding to the warm and cold phases lie in approximately the same location. However, the distribution of cold gas falls off more quickly at higher densities compared to the standard model case.
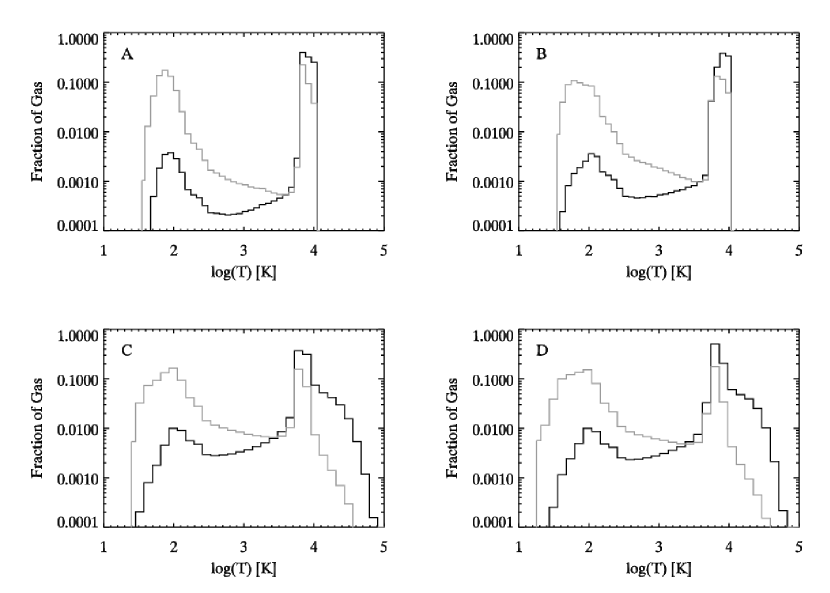
In Figure 10 we plot the temperature PDFs at the same times as those presented in Figure 9. The high temperature peak is fairly well defined. This feature is broadened later in the simulation, with a small fraction of the gas existing at temperatures higher by an order of magnitude compared to the PDFs from Paper II. In part, this is because the equilibrium temperature of high-altitude, low-pressure gas is higher than that of the warm gas near the midplane, for our adopted cooling curve. For the outer galaxy model the temperature PDFs are generally similar to those of the standard model. The peak in the cold medium is found in the same location, but towards cooler temperatures the distribution is somewhat truncated compared to that of the standard model.
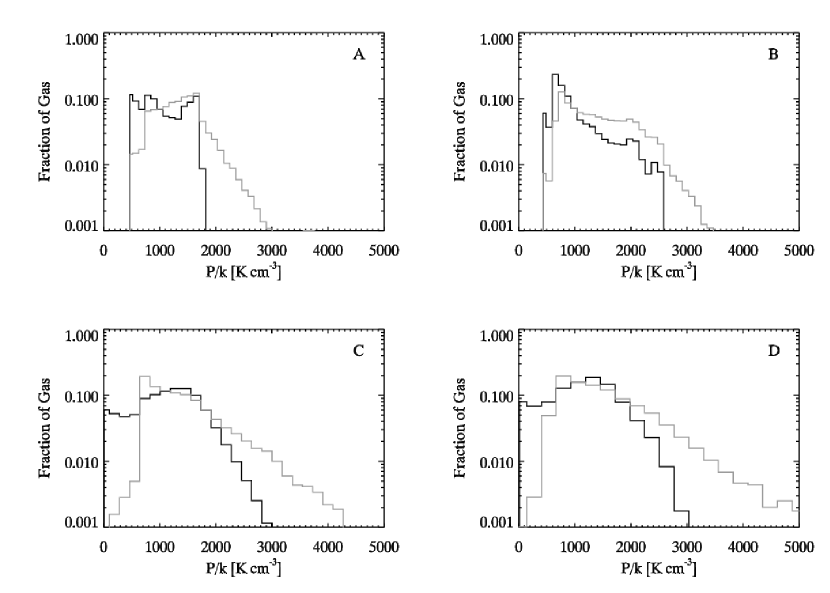
The pressure PDFs for the standard model are shown in Figure 11, again at , 5.0, 7.5, and 10.0 orbits. The pressure PDFs extend to very low values in the saturated state, with of the gas by volume (but only a few percent by mass) below . The maximum pressure is approximately , but only a few percent of the mass is at pressures above . The maximum pressure for which a warm medium can exist in thermal equilibrium (for our cooling function) is ; this is where the volume weighted PDF cuts off, implying negligible gas is above this pressure. Also, the mass-weighted fraction of gas drops sharply below , the lowest pressure for which a cold medium can exist in thermal equilibrium. The mass-weighted mean pressure in the warm, cold, and unstable phases for the standard model is shown in Figure 12. The mass-weighted mean pressures, averaged over orbits 8–10, for the warm, unstable, and cold phases are and , respectively. So, although the overall pressure distribution is quite broad, the mean pressures in the warm and cold phases are approximately equal. Our results are similar for the other two high-surface-density runs. In the high gravity run the mean warm, unstable, and cold pressures are and , respectively; and in the low gravity case the corresponding mean values for each phase are and , respectively. Interestingly, the mean pressures in “transitional” gas (i.e. in the thermally unstable temperature range) are lower than pressures in both the warm and cold phases, and similar to the transition pressure for the non-turbulent case.
In the outer galaxy model the mass-weighted pressure PDF does not extend above , unlike the results shown in Figure 11 for the standard model. The volume weighted PDFs are very similar in the standard and outer galaxy models, however, and the mass-weighted PDF of the outer galaxy model in fact follows its volume weighted PDF closely at pressures higher than . The mean mass-weighted warm, unstable, and cold pressures for the outer galaxy model are and , averaged over the final two orbits of the simulation. Thus, for this model in which the warm phase dominates the total mass, the mean warm-phase pressure slightly exceeds that of the cold phase.
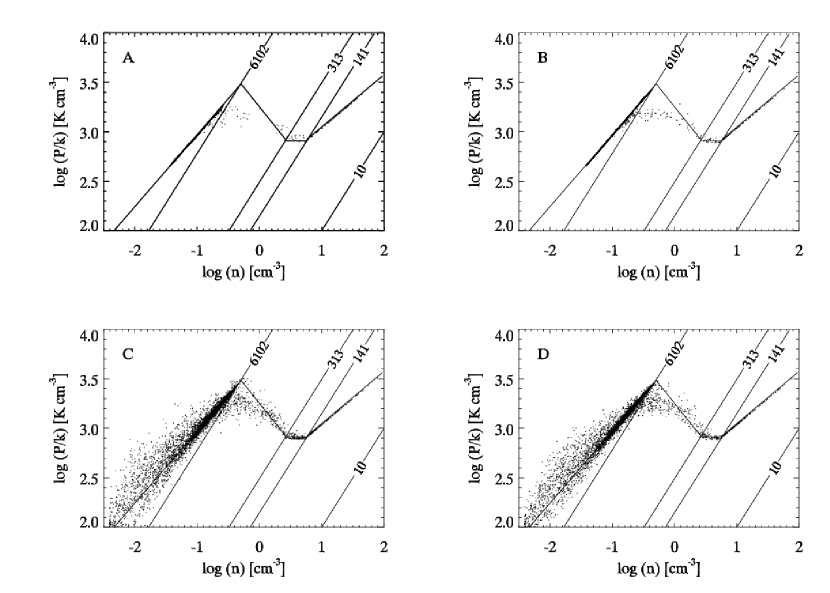
Scatter plots of density vs pressure for the standard run are shown in Figure 13. The solid line is the equilibrium cooling curve, and contours of constant temperature are plotted at the transitions between different temperature regimes in the cooling function. Gas at low temperatures cools relatively quickly, and is found to be very close to the thermal equilibrium curve. For the first orbit after the cooling function is enabled, during which turbulent amplitudes are relatively low, most of the gas is in thermal equilibrium in both the warm and cold phases. (Note that the transition from isothermal to this two-phase state occurs very rapidly, due to thermal instability, after cooling is enabled.) Later on, turbulence drives significant fractions of gas out of thermal equilibrium. Gas at higher temperatures takes longer to cool and is typically out of equilibrium, although is still roughly follows the shape of the equilibrium curve in the plane. Cold gas, with its short cooling time, always closely follows that thermal equilibrium locus. Scatter plots for our other models, including the outer galaxy case, do not show any significant differences from those of the standard model.
For all of our models, in the turbulent saturated state the mass-weighted mean value of pressure lies in the range for which two stable phases are possible. Quantitatively, this mean pressure is typically near the geometric mean of and . Compared to the non-turbulent situation, for which the mean pressure in the warm medium is lower (by a factor ), an increase of pressure at fixed temperature implies an increase in the mean warm density. Coupled with an increase in the warm medium’s scale height (due primarily to magnetic support), this tends to increase the fraction of gas in the warm phase compared to the non-turbulent case.
3.5 Stratification of Density and Pressure: What Supports Gas Vertically?
To address the issue of vertical support of the ISM, we first summarize results from our non-turbulent models that do not include MRI driven turbulence. Once the gas has settled, we can evaluate mass distributions (and total mass fractions; see §3.4) of each phase. The profiles of both the cold medium and warm medium are close to truncated Gaussians, with a narrow transition layer in the thermally unstable phase. While the cold mass fraction is higher when gravity increases, the cold disk thickness is smaller; the cold scale height decreases from 40 to 20 to 10 pc from the low- to medium- to high- gravity case. The transition between phases occurs at , i.e. close to the minimum pressure for which cold and warm gas can coexist. The warm disk has a scale height of 460, 240, and 120 pc in the low, mid, and high gravity models, respectively.555Note that these scale heights are computed by fitting to the density profiles; fits to the pressure profiles yield slightly larger scale heights of 580, 290, and 145 pc, respectively. These successive factors of two in the scale heights of cold and warm components are expected based on the successive factors of 4 in from low to moderate to high gravity, since for an isothermal pressure-supported disk, , where . We can compare the scale heights of these non-turbulent models to those which include MRI driven turbulence.
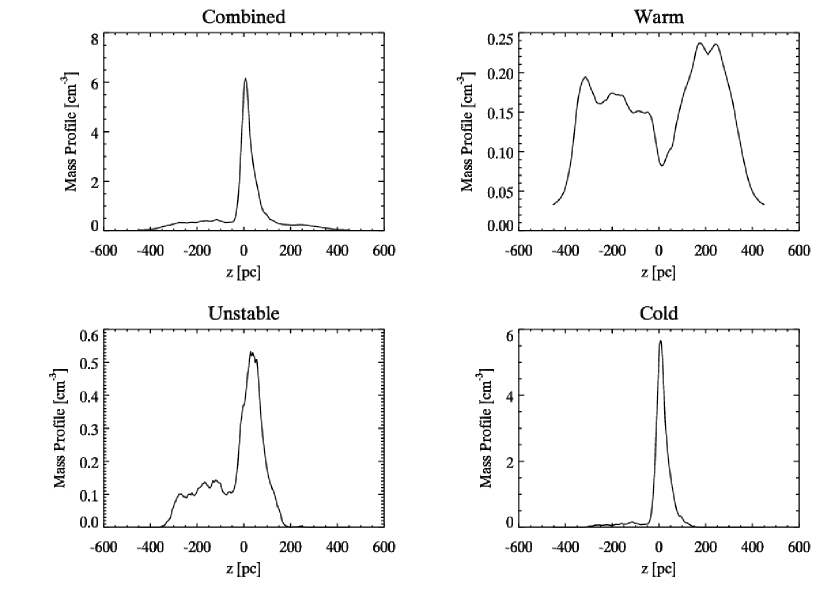
Mass profiles for the three phases of gas as well as the total are shown in Figure 14 for our standard turbulent model. These profiles are computed by integrating the density in each component in and , as a function of , dividing by the total number of zones in the and directions, and averaging over the last two orbits of the simulation. In the turbulent models, the scale height of the cold gas is 50, 20, and 12 pc from low to high gravity. Turbulence from the MRI therefore only slightly increases the scale height of the cold medium. The profile of the unstable gas is also non-Gaussian, but we estimate a scale height of the centrally peaked gas to be 90, 44, and 30 pc from the low to high gravity models. These values are roughly twice as large as the cold layer thickness. There is significant unstable gas at high latitude. For the low gravity case the warm medium is more or less evenly distributed vertically through the box. In both the standard gravity case and the high gravity case, the warm gas is very far from Gaussian, and has a local minimum at the midplane.
We also show mass profiles for our outer galaxy model in Figure 15. The total mass distribution is broadened significantly compared to the standard model, and the mean densities are approximately a factor ten smaller. The cold mass profile peaks slightly below 0.15 , compared to 6 for the standard model, indicating that the filling fraction of cold gas in the outer galaxy model near the disk mid-plane is significantly smaller than in the standard model. In the outer galaxy model the distribution of the cold medium also extends much farther above and below the mid-plane, dropping sharply at pc. Extended tails at large are also present for both cold and unstable gas. Gaussian fits to the cold and unstable phases yield scale heights of pc each. In each case, we fit to the entire mass distribution, neglecting the local minima at around 100 pc. For the cold component our fit overestimates the true distribution at higher latitudes, and underestimates it closer to the mid-plane. We emphasize, again, that these numbers should only be considered to be rough estimates.
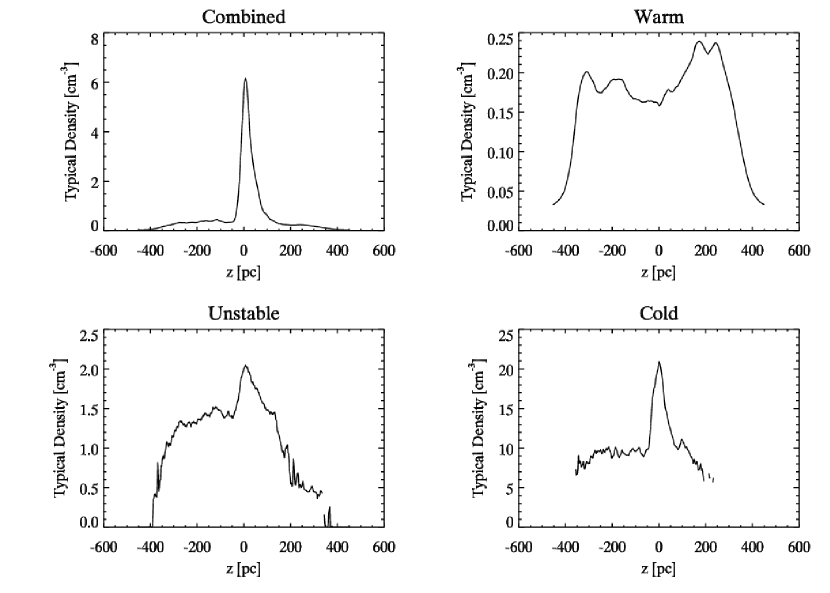
In Figure 16 we plot for the standard model the profile of typical density as a function of height for all the gas, as well as profiles of typical density in the warm, unstable, and cold components separately. The component typical densities are just the mean values in each phase at any . The typical density in the warm medium is approximately , decreasing at pc. In the unstable phase the typical density is around , increasing somewhat towards the mid-plane and decreasing at higher . For the cold medium the average density reaches as high as about 20 in the mid-plane, sharply decreasing to around 10 at higher latitudes. This is near the minimum possible density at which cold gas can be in thermal equilibrium (at ). The typical density in the warm and cold phases differ by two orders of magnitude. In the outer galaxy model the typical density of the cold medium is fairly uniform at around 8–10 , and does not show a strong central peak.
We next turn to what, physically, is responsible for these vertical mass profiles. By averaging the component of the momentum equation in horizontal planes, and making use of shearing periodic boundary conditions, we obtain
| (7) |
Thus, kinetic, thermal, and magnetic stresses can all contribute to vertical support of the disk. Note that the term arises due to the vertical magnetic tension force; where the horizontally-averaged magnitude of increases upward (magnetic “hammock” geometry, in which field lines are more horizontal near the midplane and more vertical at large ), a net upward tension force is exerted on the medium.
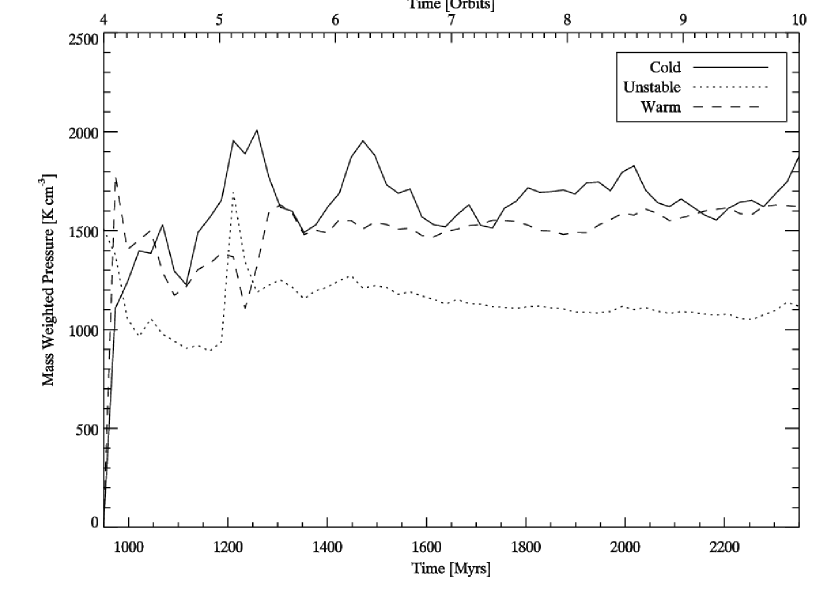
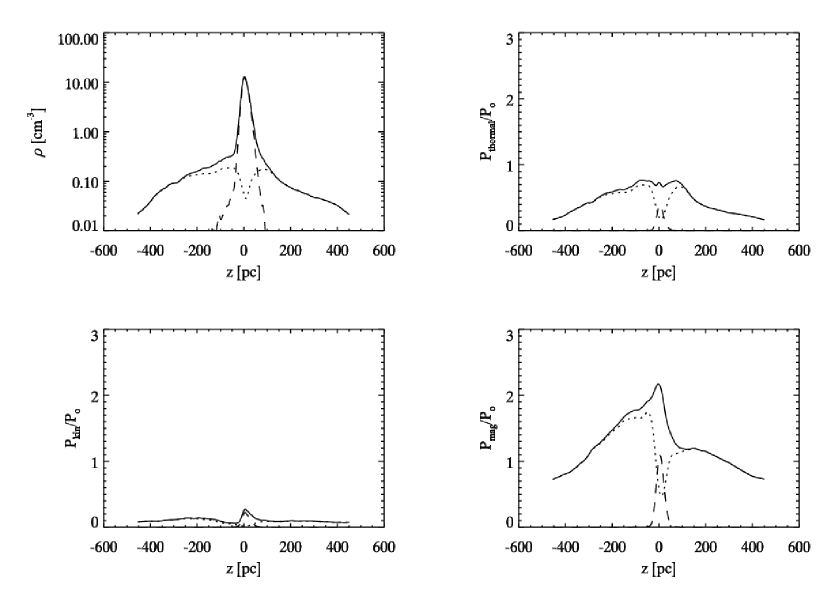
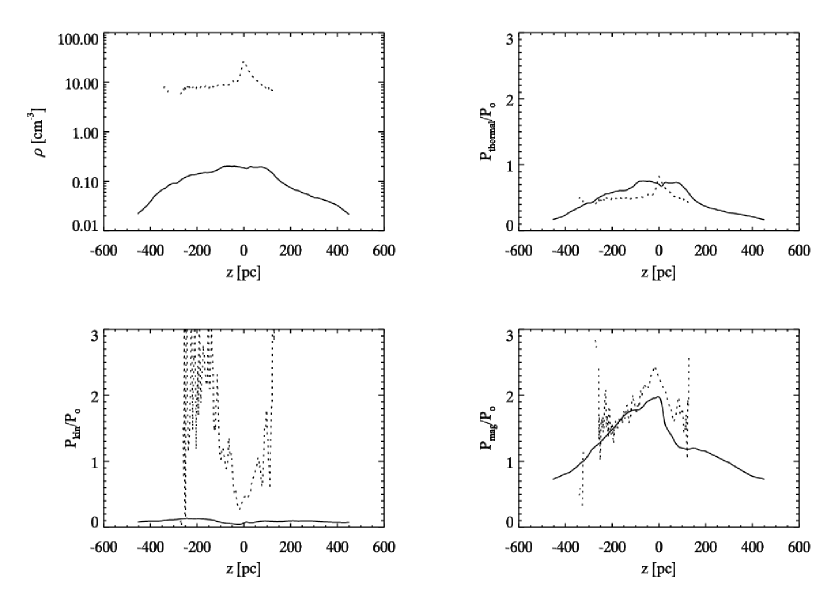
The contributions to thermal, kinetic (i.e. ), and magnetic pressures for the high gravity model (averaged over orbits) are plotted in Figure 17 for the warm and cold phases, along with the density profile. At each height, the contribution from each phase consists of the sum over zones in that phase, divided by the total number of zones. The warm medium dominates the density profile at high , while the cold medium dominates near the midplane. For both the warm and cold components, the magnetic pressure is the largest of the three pressures, followed by thermal, and then kinetic pressures. At , the ratio of mean thermal to mean magnetic pressure is ; this drops to at .
In Figure 18, we show the vertical profiles of the same quantities shown in Figure 17 averaged separately over each phase. Similar to the standard gravity run (see Fig. 16), the typical density of the cold medium is around , increasing significantly towards the mid-plane. The typical density of the warm medium is around within a few 100 pc of the midplane, decreasing at higher . The kinetic pressure of the cold medium can be very large, but this is only at high where little cold gas is actually present. The kinetic pressure is large here as the cold medium is driven to approximately the same velocity as the warm medium, but has a much higher density than the warm medium. The kinetic pressure in the warm gas varies less in than any other pressure, but is only 20% of the mid-plane thermal value. Away from the midplane, the kinetic pressure of cold gas exceeds its thermal pressure. The thermal pressures of the warm and cold phases are approximately equal near the mid-plane. (Note that the “typical” midplane pressures may be slightly lower than the average values reported in §3.4, because the latter is based on a mass-weighted mean.) The thermal pressure decreases quickly for the cold medium away from the mid-plane, while tapering off more slowly in the warm medium. The typical magnetic pressures in the warm and cold phases have similar magnitudes and profiles. At the midplane, the cold medium has , and the warm medium has .
Generally, the same trends and behaviors are seen in the standard gravity run as for the high-gravity case. For the low-gravity and outer-galaxy models, the thermal and magnetic pressures show much less central concentrations. However, as is true for the high-gravity case, all models are centrally magnetically dominated: for all components and all models, the midplane values of are in the range 0.3-0.6.
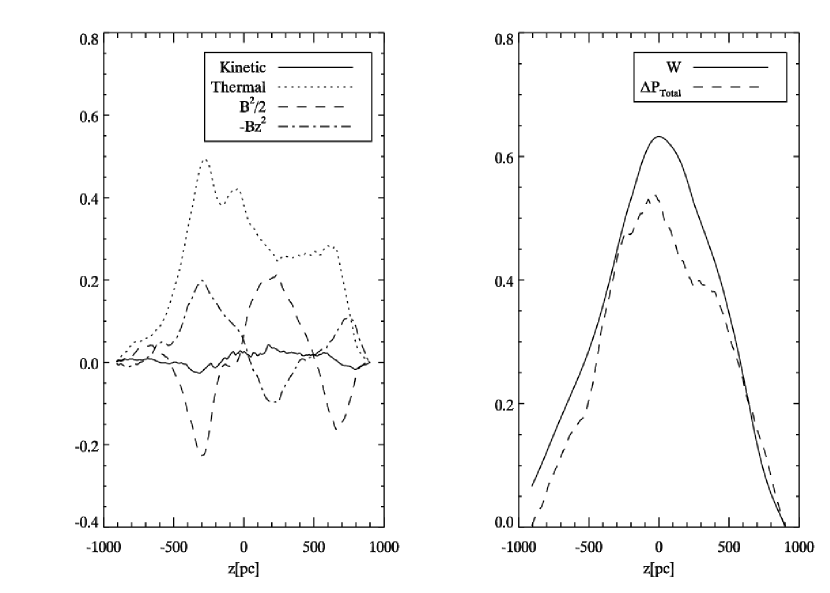
In addressing the issue of the vertical distribution of the ISM, and the relative importance of thermal, kinetic, and magnetic terms to vertical support, we can test the extent to which quasi-equilibrium is established. In an equilibrium situation, the left-hand side of equation (7) would equal zero. Then, integration of equation (7) from some height to the top of the box allows us to relate the “total pressure” to the weight of the overlying material. We define
| (8) |
with the averages taken over and at fixed . If the time dependent term in equation (7) is zero, we would then have
| (9) |
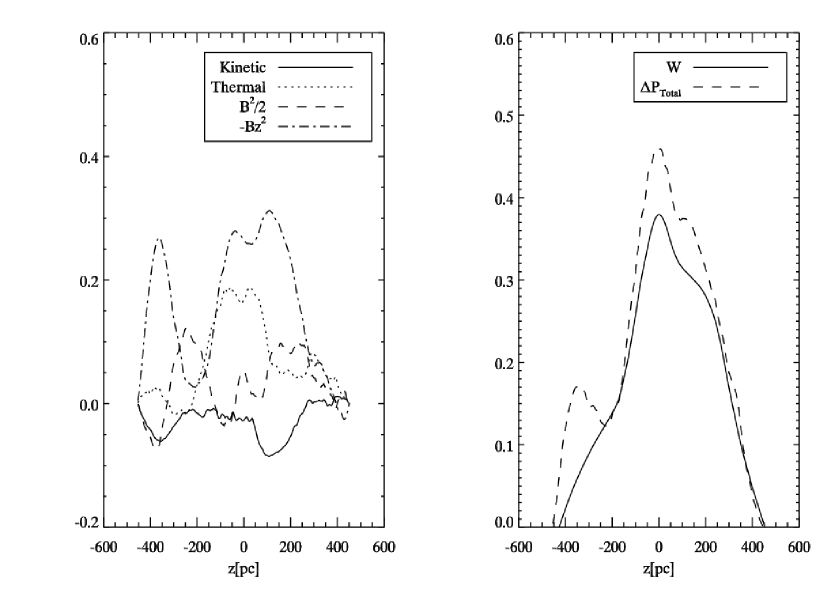
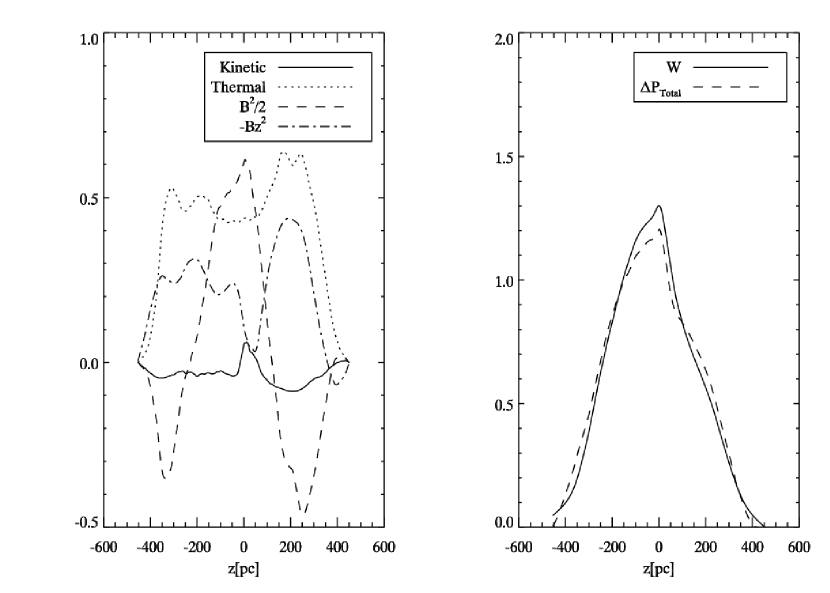
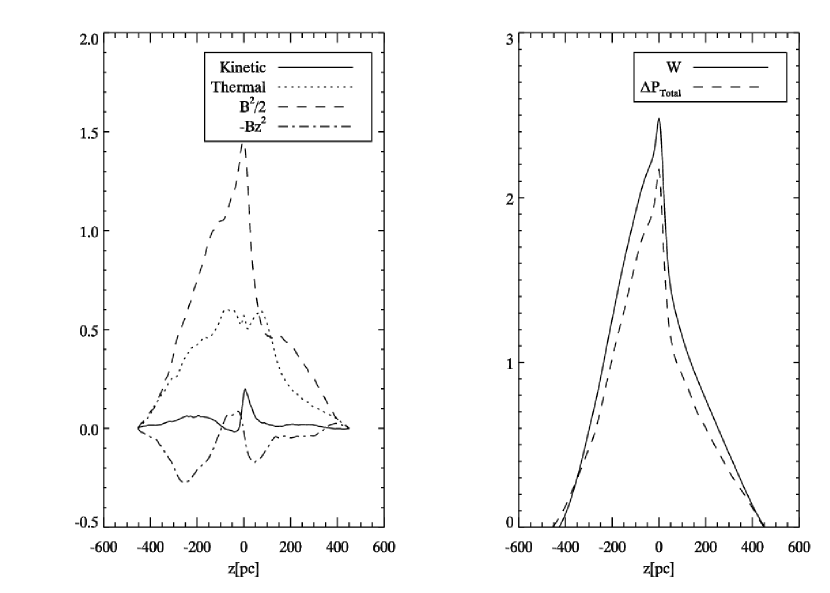
We can then compare to the weight . In the right hand panel of Figure 19 we plot these two quantities for the low gravity model, and on the left we plot the four component terms of equation (8) for comparison. The same quantities are shown for the mid- and high-gravity, and outer galaxy models in Figures 20, 21 and 22, respectively. In each case, these profiles have been averaged over the last two orbits of the simulation ( orbits). Generally the agreement between and is quite good, indicating that the models are indeed in rough vertical equilibrium.
By comparing the contributions of the four pressure terms in our different models, we can gain some insight as to what provides support against the pull of gravity. An interesting feature of all the models is that while there are quite large variations in individual components, these compensate each other in such a way that is quite smooth. Another obvious feature, and perhaps one of the most interesting results, is that the kinetic pressure support term is small in all of our models. This suggests that turbulent kinetic pressure driven by the MRI does little to provide vertical support of the ISM. Perhaps this is not too surprising because the total turbulent velocity amplitudes in these models are lower than those which are observed. Furthermore, turbulent amplitudes of tend to be smaller than or , which further reduces the effectiveness of the MRI in providing turbulent kinetic support to the ISM.
In the low gravity model (see Fig. 19), all of the terms are small compared to the peak values in other models (see Figs. 20 - 22). This is because the individual components of in fact vary relatively weakly with in the low-gravity model, so that the ’s are small. Thus, although at any is larger than each of the other terms by at least a factor of two in the low gravity model, and dominate over . In the mid-gravity case, increases towards small enough so that, together with the thermal term, provides most of the vertical support near the midplane. Finally, in the high gravity case the magnetic pressure term strongly increases inward, and completely dominates the midplane vertical support.
The thermal term plays an important role in vertical support in all of the models, and in particular it is the dominant term in the outer galaxy model. Here, is larger than all the other terms (see Fig. 22), even though the magnetic pressure is typically a factor two larger than ; it is the lack of central concentration in magnetic pressure that renders it less important than the thermal pressure for vertical support.
One last interesting point is that the gas is distributed much more uniformly in our outer galaxy model (see Fig. 15), as compared to our low gravity model (with the same ) with higher surface density. In comparing Figures 19 and 22, it appears that the large-scale thermal pressure gradients are more effective in providing this support in the outer galaxy model, because of the large fraction of warm gas.
3.6 Effects of Box Size and Vertical Magnetic Flux
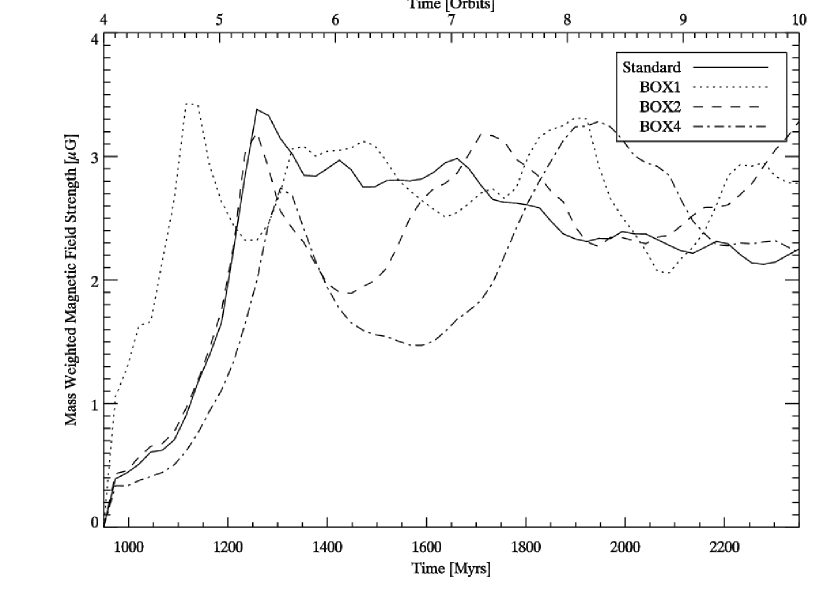
We have performed five additional lower resolution simulations in order to address the impact of two important parameters, one numerical and the other physical. We first consider the effect of increasing the size of the simulation domain. The BOX1, BOX2, and BOX4 models are identical to our standard model, but performed at half the linear resolution, and with respective box sizes a factor of 1, 2, and 4 times larger in the radial and azimuthal directions. The vertical extent of the domain in all three BOX models is the same as the standard model, but the resolution is reduced by a factor of two. See Table 1 for a comparison of these parameters. The purpose of the BOX tests is to assess whether the saturation amplitude of the turbulence is sensitive to the size of the domain simulated.
The main result of the BOX tests is illustrated in Figure 23. We plot the mass weighted mean magnetic field strength for the warm medium as a function of time for the standard, BOX1, BOX2, and BOX4 models together. Averaging over the final two orbits of these simulations, all three low resolution models have a similar, but slightly larger, time-averaged values of the field strength, and , compared to the mean value for the standard model. The slight differences in the mean value may be some indication of a resolution effect on the saturated state field strength, but longer time averages would be needed to draw a definitive conclusion. The main conclusion from these tests, however, is to confirm that the saturated-state value of is independent of box size, at least for horizontal domains up to .
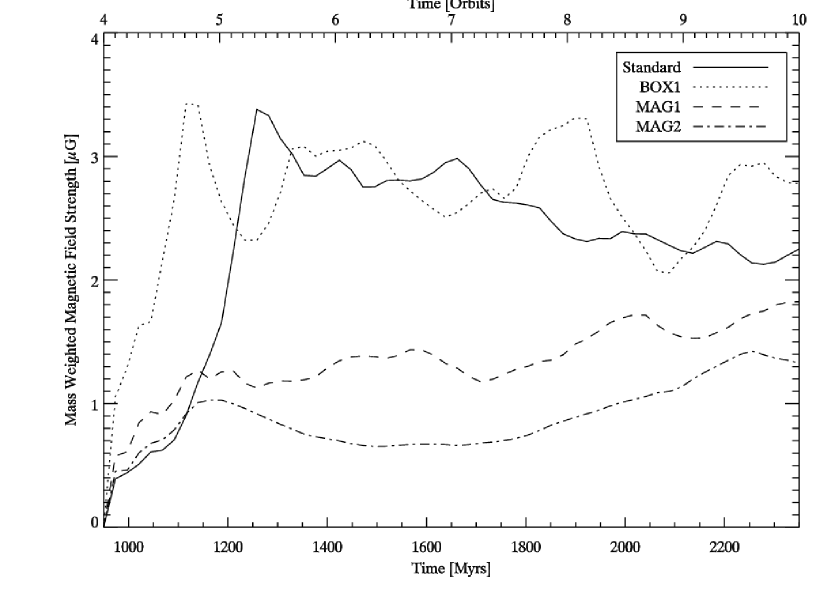
We have also examined the effect of decreasing the initial vertical magnetic field strength on the saturated state value of the magnetic field. The standard value we chose for the mean vertical field, , is motivated by Galactic observations (Han & Qiao, 1994). From a general theoretical point of view, however, it is useful to assess how the value of affects the mean amplitude of the field that develops. Previous single-phase models have found an increase in the saturated-state level according to (Hawley et al., 1996) or (Sano et al., 2004). Here, two additional simulations, MAG1 and MAG2, were performed with an inital vertical magnetic field of , corresponding to . The MAG1 model is identical to the BOX1 model, except for the initial field strength. The MAG2 model is idential to MAG1, but we increase the box size by a factor of 2, keeping the linear resolution the same; thus, MAG2 is a low- version of BOX2.
The mass weighted magnetic field strength for the warm medium is shown for the models MAG1 and MAG2 models in Figure 24, with the standard and BOX1 models shown for comparison. Averaging over the final two orbits, for the MAG1 model is clearly smaller than that for BOX1, 1.6 and , respectively. In MAG2, , indicating that in this case increasing the box size also slightly reduces the saturation amplitude. The results on lower are generally consistent with the predictions from previous single-phase models cited above. We also note, however, that the slow rise in in both MAG1 and MAG2 might continue if these models were allowed to run longer in time, yielding a higher final saturated state value of . Thus, although our tests indicate a reduction in if is reduced, further study would be required for a quantitative analysis.
4 Summary and Discussion
4.1 Model Results
We have performed numerical simulations of the ISM which include atomic heating and cooling, galactic shear, magnetic fields and vertical gravity. This allows us to study the MRI in the presence of a two phase medium, with the vertical structure of the disk determined self-consistently. Our simulations include three models with initial surface density typical of that in the solar neighborhood () and vertical gravity coefficients that vary by a factor 16. The high gravity value is representative of conditions in the main star-forming portion of a galactic disk (similar to the Solar neighborhood), while the lower gravity models allow us to explore how results vary with the degree of midplane gas concentration. We have also performed a fourth simulation with a lower initial surface density () and low gravity, representative of outer-galaxy conditions. Our simulations are local, with dimensions of pc for the inner-disk models, and a box twice as large for the outer-disk model. Tests with larger numerical boxes suggest that our results are not sensitive to the size of the simulation domain; the parameters adopted enable adequate linear resolution ( pc) at moderate computational cost.
Our main results are as follows:
1. Thermal phase components – For all of our models, and similarly to our results in Papers I and II, we find that thermal instability tends to separate gas into warm and cold phases on a short timescale, with shear stretching the cold clouds into filamentary shapes. Although turbulence maintains a significant portion of the gas in the thermally-unstable regime, the density and temperature PDFs still show two distinct – but broad – peaks.
For the high- models, the cold mass fractions are (60,60,73)%, the mass fractions in the unstable temperature range are (18,16,11)%, and the warm mass fractions are (22,24,16)%, respectively, from low to high gravity. For comparison, without turbulence the cold medium makes up (81,86,92)% from low to high gravity, and the remaining (19,14,8)% is in warm gas. Thus, turbulence can significantly enhance the amounts of warm and thermally-unstable gas at the expense of cold gas, and the proportions of gas in the different phases seem relatively insensitive to the strength of vertical gravity. Although the cold mass fraction is somewhat larger than the fraction in the local Milky Way estimated observationally by Heiles & Troland (2003), our result that warm and unstable gas are present in similar proportions to each other is consistent with observational findings. For our outer-galaxy model, the cold mass amounts to only of the total, compared to at unstable temperatures and in the warm phase.
2. Thermal pressure levels – The pressure PDFs resulting from our simulations are quite broad, yet the mean midplane pressures in the warm gas are almost identical () in all models in spite of the large differences in the total weight of overlying material (due to varying and ). The cold gas is nearly in pressure equilibrium with the warm gas, with mean midplane thermal pressures of the cold gas within of the warm-medium values. Thus, there appears to be a mass exchange between phases so as to maintain typical thermal pressures comparable to the geometric mean of and (here, and ). This is consistent with observational indications that the mean local ISM pressure is (Jenkins & Tripp, 2001), comparable to the geometric mean between and in the standard model of Wolfire et al. (1995).
3. Vertical Stratification – Because the cold clouds have densities a factor greater than that in the warm medium, they tend to sink toward the midplane, creating a differentially-stratified vertical density distribution. The space-and-time-averaged density profiles show different scale heights for components of different temperatures. In particular, the high- inner disk models (with 60-70% cold gas) all have very strong central density peaks due to the concentration of cold gas near the midplane (see Figs. 14 and 17). The cold component thicknesses are only slightly increased relative to the corresponding non-turbulent models. For the low- outer-disk model, on the other hand, the overall vertical distribution is somewhat irregular but lacks a narrow central density peak (see Fig. 15). With a much smaller fraction of cold gas (20%), turbulence in the warm medium is able to maintain a larger cold-disk scale height, for an (approximate) Gaussian fit. The scale height for thermally-supported cold gas at mean temperature in the outer-disk model would be only . Thus, turbulence significantly increases the cold disk’s scale height for this case; the equivalent effective sound speed would be three times the thermal value.
How do our results compare to observations? Observations of high-latitude HI in the Solar neighborhood yield fairly smooth distributions which can be fit by one or two Gaussians with an overall effective scale height of pc (Dickey & Lockman, 1990; Lockman & Gehman, 1991). Cold HI gas is not included in the fits from high-latitude observations but early estimates (see §1) suggest smaller scale heights than in the warm gas. Interestingly, observations of extinction using the 2MASS data set (Marshall et al., 2006) also show a significant central excess above a profile that follows away from the midplane, suggestive of a cold component with a scale height much less than 100 pc. Recent simulations of the ISM with model supernovae driving turbulence (Joung & Mac Low, 2006) have also shown quite non-Gaussian vertical density profiles with strong central peaks.
Although the precise scale height of cold gas in the inner Galaxy is not well known (an updated observational study of this would be very valuable), it is unlikely to be as small as was found for our inner-disk high-gravity model (a few 10s of pc). Thus, we conclude that MRI is not able to account for the overall vertical HI distribution in the inner portion of the Milky Way’s ISM disk. When the surface density is high enough that half (or more) of the gas is forced into the cold component, turbulence driven by MRI in the diffuse warm gas is not sufficient to lift the cold component off the midplane. The gas in the outer Milky Way (and other galaxies) is observed to have a much larger vertical extent than in the inner disk (e.g. Olling & Merrifield 2000), but the detailed vertical profile is not certain. While our outer-disk model’s vertical profile (see Fig. 15) appears reasonable compared to existing observations, it is not yet possible to reach a firm conclusion.
4. Velocity dispersions – For all of our models, we find that the turbulent velocity dispersion decreases with decreasing gas temperature for the various components. In the warm phase, mass-weighted turbulent velocity dispersions are , while in the cold phase they are . This result differs from that of Paper II, in which we found similar turbulent velocity dispersions for all components. The reason for this difference is well understood. In Paper II, we showed that the velocity dispersion in a two-phase medium depends on the average density, with sufficiently low mean density allowing velocity dispersion up to , and higher mean density yielding modest velocity dispersions. In the models presented in this paper, the cold gas tends to sink to the mid-plane, producing differential stratification. The mean density is high in the midplane regions where cold gas is overrepresented, and the velocity dispersion of cold gas is consequently low. The mean density is low at high altitudes where cold gas is depleted, and the velocity dispersion of warm gas is consequently high (exceeding ). This effect is also self-reinforcing, since the low amplitudes of MRI near the midplane are not able to drive cold gas to higher latitudes, which would lower the mean midplane density and raise the turbulent velocity there.
Because the outer-galaxy model has a lower cold mass fraction than the other models, differential stratification by temperature is less extreme. The mean velocity dispersion of cold gas is only a factor two lower than the warm gas velocity dispersion for this case, while the ratio is a factor five for the highly-stratified high-gravity model. For the inner-galaxy high- models, the mean turbulent velocity dispersions are far lower than the the 7 observed locally (Heiles & Troland, 2003). Thus, other physical processes must be responsible for driving these large observed velocities. Even for the outer-galaxy model, the mean turbulent velocity dispersion is just , although with the high warm fraction the total velocity dispersion including thermal broadening would be . Turbulent and thermal velocity dispersions cannot be separated in HI emission observations of external galaxies, so it is not yet known what the true turbulent amplitudes (or warm/cold mass fractions) in the outer portions of galaxies are (see §4.2).
5. Magnetic field strengths – An interesting result of this work, in agreement with the results of the unstratified models of Paper II, is that the saturated-state magnetic energy density is fairly independent of mean density (i.e. the proportions of warm and cold gas). While there is a factor 30 difference in the mean midplane density between the high-gravity, high- inner disk model and the low-gravity, low- outer disk model ( vs. ), the ratio of magnetic energy densities is only a factor two ( vs. ). This suggests that MRI saturates when the magnetic energy density is in approximate equipartition with thermal energy. While it is important to understand this process in detail, one interpretation of this result might be that growth of the magnetic field (at a rate when dominates) is balanced by magnetic reconnection (at a rate or depending on vertical support) when (see also Sano & Inutsuka (2001); Sano et al. (2004), who consider saturation levels in MRI models with explicit resistivity).
The range in midplane values of the plasma parameter for all of the models performed, including both warm and cold phases of gas. For our chosen cooling curve, which yields midplane thermal pressure , this corresponds to midplane magnetic field strengths of . Averaging over all of the gas, the saturated-state magnetic field strengths range from , lowest for the warm gas in the outer-galaxy model, and highest for the cold gas in the high-gravity model. Allowing for the fact that our adopted cooling curve results in mean thermal pressure lower by a factor compared to Solar-neighborhood observations, these magnetic field strengths are entirely consistent with observed local Milky Way magentic fields of (Heiles & Troland, 2005), and similar values in external galaxies (Beck, 2006). This shows that the MRI is capable of amplifying weak magnetic fields up to realistic interstellar values, and as such is one of the most important elements of the galactic dynamo. We note that the quantitative levels above were obtained using G, motivated by observations. Models with smaller result in lower saturated-state , consistent with the results of single-phase MRI simulations.
6. Vertical support of the disk – Analysis of the contributions to the time-averaged momentum equation show that our models reach approximate vertical equilibrium between the downward force of gravity and the upward forces of the combined effects of thermal pressure, kinetic pressure, and magnetic pressure and tension. The dominant terms are thermal and magnetic pressure gradients; the latter is most important in regions where the majority of the mass is in cold gas, while the latter predominates elsewhere.
While the profiles of weight and total pressure difference are both fairly smooth as a function of , the individual terms in can be quite irregular. In addition, even when there is strongly dominant support by a single term, as for the magnetic-pressure supported midplane regions of the high-gravity case, the vertical variation of magnetic pressure and gas density differ, such that at the midplane does not yield an accurate value for the scale height. In this case, it overestimates the density scale height of 12 pc by about 60%.
4.2 Astronomical Persectives
A major motivation for the present study, together with Papers I and II, has been to quantify the amplitude of turbulent motions that can be driven by MRI in interstellar gas with realistic properties. Sellwood & Balbus (1999) originally proposed that the observed near-constant HI velocity dispersion reported in the outer parts of NGC 1058 (Dickey et al., 1990) could potentially be attributed to random motions of an ensemble of small cold clouds associated with MRI-driven turbulence. In fact, we find that the saturated-state velocity dispersion in the cold-cloud ensemble is always fairly low, so that the cold medium’s intrinsic contribution to the total (thermal+nonthermal averaged over all phases) velocity dispersion would exceed the contribution from the warm medium only if the warm medium represents a miniscule () proportion of the gas mass. Since MRI-driven turbulence even in the warm medium is at most sonic and the vertical component is smaller than the in-plane components, thermal broadening should in practice exceed turbulent broadening for face-on galaxies.
Thus, we suggest that observed values of the velocity dispersion lower than may imply the presence of cold gas with velocity width smaller than the 21 cm receiver’s channels. This could have the effect of reducing the inferred linewidth relative to what would be measured if only warm gas were present. For example, if warm medium with thermal dispersion of makes up 40% of the total mass and the intrinsic instrumental linewidth and turbulent velocity dispersion are each , then adding in quadrature would yield a total linewidth of 6.6 . This is quite similar to the mean value reported for NGC 1068. If, on the other hand, the observed velocity dispersion exceeds , we suggest that there must be little cold gas. MRI-driven turbulence in the warm medium can contribute at a moderate level to the velocity dispersion in this case. However, it is possible that corrugation in the disk is allowing rotation to contaminate the inferred velocity dispersion when values as large as 15 are reported in regions where there is little observed star formation (and negligible spiral structure) in external galaxies.
Another important astronomical motivation for our work has been to help understand what controls the spatial extent of disk star formation. Usually, the sharp drop in star formation in the outer parts of disks is attributed to a gravitational threshold; if the effective velocity dispersion is , the mean critical Toomre parameter is measured to be 1.4 at the threshold for active star formation (Kennicutt, 1989; Martin & Kennicutt, 2001; Boissier et al., 2003). The value is consistent with theoretical measures of the -threshold for nonlinear gravitational runaway, allowing for both self-gravitating gas and stars (Kim & Ostriker, 2007).
An alternative proposal is that the star formation threshold simply marks the radius in the disk inside which the midplane hydrostatic pressure is sufficient for a cold phase to be present (Schaye, 2004). This radius depends through the heating and cooling curves on the metallicity and level of ambient UV radiation present, but since for a non-turbulent, pure-gas disk and in the outer parts of disks (Elmegreen & Parravano, 1994; Wolfire et al., 2003), this would typically be near where . 666Since MRI can compress gas to pressures higher than would be possible from hydrostatic equilibrium alone, cold gas would in reality be present even at lower values of the total surface density. For a flat rotation curve with circular velocity , the value of at radius is
| (10) |
Schaye’s proposal is based on the idea that if were only to include the thermal sound speed , then with for cold gas, gravitational instability and hence active star formation would develop essentially wherever there is a cold component (provided that the not-very-restrictive condition is met).
The proposal of Schaye in fact does not appear consistent with observations, since observed star formation thresholds often occur where the ISM is predominantly molecular, well inside the maximum radius for cold HI to be present(Martin & Kennicutt, 2001). 777de Blok & Walter (2006) also give direct evidence that cold gas is present in the outer, non-star-forming parts of NGC 6822, based on the clear broad/narrow components of high-velocity-resolution HI line profiles. But if cold gas is present in the outer parts of galaxies, then its thermal pressure is certainly inadequate to prevent gravitational instability. This implies that must include other terms that are large enough to yield . We have shown that turbulent velocities of develop in the cold medium under outer-disk conditions where the cold mass fraction is small; even if is as large as this turbulence would suppress instability in the cold medium out beyond kpc. Perhaps even more important, however, are the magnetic fields.
Our models show that MRI amplifies the magnetic field until the midplane magnetic pressure is times the thermal pressure . If the mean midplane density is or less (as is true for our outer-galaxy model), then the Alfvén speed at the midplane would exceed . Even if the midplane thermal pressure is somewhat lower in the outer parts of galaxies than for our models, the magnetic fields would still be quite large. If the substitution in equation (10) legitimately describes the effect of turbulent magnetic fields on gravitational instability in a two-phase ISM disk, then it may be primarily MRI-driven magnetic fields that suppress outer-disk star formation. 888MRI could not on its own suppress star formation in the inner disk, however, since cold gas settles at the midplane when too much is present, resulting in a high and low at . Whether this naive approach is even approximately valid or not, however, is not certain. In some circumstances magnetic fields are known to suppress self-gravitational instability, and we have seen here that they provide support against vertical gravity in the simulations we have performed. In other situations, however, turbulent magnetic fields can encourage disk instabilities by transferring angular momentum out of condensations (e.g. Kim et al. 2003). Addressing this question directly with numerical simulations represents an important problem for future study.
References
- Baker & Burton (1975) Baker, P. L., & Burton, W. B. 1975, ApJ, 198, 281
- Balbus (2003) Balbus, S. A. 2003, ARA&A, 41, 555
- Balbus & Hawley (1991) Balbus, S. A., & Hawley, J. F. 1991, ApJ, 376, 214
- Beck (2006) Beck, R. 2006, ArXiv Astrophysics e-prints
- Boissier et al. (2003) Boissier, S., Prantzos, N., Boselli, A., & Gavazzi, G. 2003, MNRAS, 346, 1215
- Boulares & Cox (1990) Boulares, A., & Cox, D. P. 1990, ApJ, 365, 544
- de Avillez & Breitschwerdt (2004) de Avillez, M. A., & Breitschwerdt, D. 2004, A&A, 425, 899
- de Avillez & Breitschwerdt (2005) —. 2005, A&A, 436, 585
- de Blok & Walter (2006) de Blok, W. J. G., & Walter, F. 2006, AJ, 131, 363
- Dib & Burkert (2005) Dib, S., & Burkert, A. 2005, ApJ, 630, 238
- Dickey et al. (1990) Dickey, J. M., Hanson, M. M., & Helou, G. 1990, ApJ, 352, 522
- Dickey & Lockman (1990) Dickey, J. M., & Lockman, F. J. 1990, ARA&A, 28, 215
- Dziourkevitch et al. (2004) Dziourkevitch, N., Elstner, D., & Rüdiger, G. 2004, A&A, 423, L29
- Elmegreen & Parravano (1994) Elmegreen, B. G., & Parravano, A. 1994, ApJ, 435, L121+
- Falgarone & Lequeux (1973) Falgarone, E., & Lequeux, J. 1973, A&A, 25, 253
- Field et al. (1969) Field, G. B., Goldsmith, D. W., & Habing, H. J. 1969, ApJ, 155, L149+
- Fricke (1969) Fricke, K. 1969, A&A, 1, 388
- Han & Qiao (1994) Han, J. L., & Qiao, G. J. 1994, A&A, 288, 759
- Hawley & Balbus (1991) Hawley, J. F., & Balbus, S. A. 1991, ApJ, 376, 223
- Hawley & Balbus (1992) —. 1992, ApJ, 400, 595
- Hawley et al. (1995) Hawley, J. F., Gammie, C. F., & Balbus, S. A. 1995, ApJ, 440, 742
- Hawley et al. (1996) —. 1996, ApJ, 464, 690
- Heiles & Troland (2003) Heiles, C., & Troland, T. H. 2003, ApJ, 586, 1067
- Heiles & Troland (2005) —. 2005, ApJ, 624, 773
- Holmberg & Flynn (2000) Holmberg, J., & Flynn, C. 2000, MNRAS, 313, 209
- Jenkins & Tripp (2001) Jenkins, E. B., & Tripp, T. M. 2001, ApJS, 137, 297
- Joung & Mac Low (2006) Joung, M. K. R., & Mac Low, M.-M. 2006, ArXiv Astrophysics e-prints
- Kennicutt (1989) Kennicutt, Jr., R. C. 1989, ApJ, 344, 685
- Kim & Ostriker (2007) Kim, W.-T., & Ostriker, E. C. 2007, ArXiv Astrophysics e-prints
- Kim et al. (2003) Kim, W.-T., Ostriker, E. C., & Stone, J. M. 2003, ApJ, 599, 1157
- Lockman & Gehman (1991) Lockman, F. J., & Gehman, C. S. 1991, ApJ, 382, 182
- Marshall et al. (2006) Marshall, D. J., Robin, A. C., Reylé, C., Schultheis, M., & Picaud, S. 2006, A&A, 453, 635
- Martin & Kennicutt (2001) Martin, C. L., & Kennicutt, Jr., R. C. 2001, ApJ, 555, 301
- McKee & Ostriker (1977) McKee, C. F., & Ostriker, J. P. 1977, ApJ, 218, 148
- Miller & Stone (2000) Miller, K. A., & Stone, J. M. 2000, ApJ, 534, 398
- Mohan et al. (2004) Mohan, R., Dwarakanath, K. S., & Srinivasan, G. 2004, Journal of Astrophysics and Astronomy, 25, 185
- Olling & Merrifield (2000) Olling, R. P., & Merrifield, M. R. 2000, MNRAS, 311, 361
- Piontek & Ostriker (2004) Piontek, R. A., & Ostriker, E. C. 2004, ApJ, 601, 905
- Piontek & Ostriker (2005) —. 2005, ApJ, 629, 849
- Sánchez-Salcedo et al. (2002) Sánchez-Salcedo, F. J., Vázquez-Semadeni, E., & Gazol, A. 2002, ApJ, 577, 768
- Sano & Inutsuka (2001) Sano, T., & Inutsuka, S.-i. 2001, ApJ, 561, L179
- Sano et al. (2004) Sano, T., Inutsuka, S.-i., Turner, N. J., & Stone, J. M. 2004, ApJ, 605, 321
- Schaye (2004) Schaye, J. 2004, ApJ, 609, 667
- Sellwood & Balbus (1999) Sellwood, J. A., & Balbus, S. A. 1999, ApJ, 511, 660
- Slyz et al. (2005) Slyz, A. D., Devriendt, J. E. G., Bryan, G., & Silk, J. 2005, MNRAS, 356, 737
- Spitzer (1978) Spitzer, L. 1978, Physical processes in the interstellar medium (New York Wiley-Interscience, 1978. 333 p.)
- Stone et al. (2000) Stone, J. M., Gammie, C. F., Balbus, S. A., & Hawley, J. F. 2000, Protostars and Planets IV, 589
- Stone et al. (1996) Stone, J. M., Hawley, J. F., Gammie, C. F., & Balbus, S. A. 1996, ApJ, 463, 656
- Stone & Norman (1992a) Stone, J. M., & Norman, M. L. 1992a, ApJS, 80, 753
- Stone & Norman (1992b) —. 1992b, ApJS, 80, 791
- van Zee & Bryant (1999) van Zee, L., & Bryant, J. 1999, AJ, 118, 2172
- Wolfire et al. (1995) Wolfire, M. G., Hollenbach, D., McKee, C. F., Tielens, A. G. G. M., & Bakes, E. L. O. 1995, ApJ, 443, 152
- Wolfire et al. (2003) Wolfire, M. G., McKee, C. F., Hollenbach, D., & Tielens, A. G. G. M. 2003, ApJ, 587, 278
| Model | Boxsize [] | |||||||
|---|---|---|---|---|---|---|---|---|
| Low Gravity | 1.94 | 150 | 600 | 0.85 | 10 | 0.26 | ||
| Standard | 7.76 | 150 | 2500 | 0.85 | 10 | 0.26 | ||
| High Gravity | 31.0 | 150 | 10000 | 0.85 | 10 | 0.26 | ||
| Outer Galaxy | 1.94 | 300 | 2500 | 0.26 | 6 | 0.26 | ||
| BOX1 | 7.76 | 150 | 2500 | 0.85 | 10 | 0.26 | ||
| BOX2 | 7.76 | 150 | 2500 | 0.85 | 10 | 0.26 | ||
| BOX3 | 7.76 | 150 | 2500 | 0.85 | 10 | 0.26 | ||
| MAG1 | 7.76 | 150 | 2500 | 0.85 | 10 | 0.08 | ||
| MAG2 | 7.76 | 150 | 2500 | 0.85 | 10 | 0.08 |