1–4
Kinematic Substructures in the Coma Cluster Core as traced by Intracluster Planetary Nebulae
Abstract
The Coma cluster is the richest and most compact of the nearby clusters, yet there is growing evidence that its formation is still on-going. A sensitive probe of this evolution is the dynamics of intracluster stars, which are unbound from galaxies while the cluster forms, according to cosmological simulations. With a new multi-slit imaging spectroscopy technique pioneered at the 8.2 m Subaru telescope and FOCAS, we can now detect and measure the line-of-sight velocities of the intracluster planetary nebulae which are associated with the diffuse stellar population of stars, at 100 Mpc distance. We detect significant velocity substructures within a 6 arcmin diameter field, centred on the Coma X-ray cluster emission. One substructure is present at kms-1, probably from infall of a galaxy group, while the main intracluster stellar component moves at kms-1. Hence the ICPNs associated with the diffuse light at the position of the MSIS field are not bound to the nearby cD galaxy NGC 4874, whose radial velocity is kms-1 greater.
keywords:
(ISM:) planetary nebulae: general. Galaxies: kinematics and dynamics,(cosmology:) large-scale structure of universe1 Introduction
Diffuse intracluster light (ICL) has now been observed in nearby (Feldmeier et al. 2004, Mihos et al. 2005) and in intermediate redshift clusters (Zibetti et al. 2005, Krick et al. 2006). Recent studies show that the ICL contains of order 10% of the mass in stars overall (Aguerri et al. 2005, Zibetti et al. 2005), but in the cores of dense and rich clusters like Coma, the local ICL fraction can be as high as 50% (Bernstein et al. 1995).
Intracluster planetary nebulae (ICPNs) are presently the only tracers which allow us to measure the kinematics and dynamics of the ICL, using their [OIII] 5007Å emission for identification and radial velocity measurements. By determining the projected phase space distribution of ICPNs we can constrain the dynamical age of the ICL component, how and when this light originated. Owing to the small fluxes of distant ICPNs this was so far only possible for the nearby Virgo cluster (Arnaboldi et al. 2004).
To study the effect of a dense environment on galaxy evolution, we have recently carried out a pilot survey in the Coma cluster (A1656), using a multi-slit imaging spectroscopy (MSIS) technique with the FOCAS spectrograph and the Subaru telescope (Gerhard et al. 2005). First detections and line-of-sight velocities for one mask configuration were presented in that paper. Here we discuss the result from the data reduction and analysis of the whole dataset. We present the spatial and velocity distribution of 40 detected PN candidates and compare with those of Coma cluster galaxies from the most recent compilation by Adami et al. (2005).
2 Observations
Observations of a field centered on (J2000) 12:59:41.784; (J2000) 27:53:25.388 were carried out with the Faint Object Camera and Spectrograph (FOCAS) at the 8.2 m Subaru telescope on April 21-23, 2004. This field is near the X-ray centroid of the Coma cluster and is essentially coincident with the field observed by Bernstein et al. (1995). The instrument was used with a mask of parallel multiple slits (shown in O. Gerhard’s review at this conference), and with a narrow band filter centered on the wavelength of the redshifted [OIII] 5007Å line at the mean velocity of the Coma cluster. We observed three MSIS masks to obtain spectra of all PNs that happen to lie behind the slits.
The spatial resolution of FOCAS is pixel-1, so the diameter (equivalent to 174 kpc in Coma) of the circular field of view (FOV) corresponds to 3600 pixels. We used grating 300B, which gives a measured dispersion of 1.41 Å pixel-1 on the two FOCAS CCD chips. The effective spectral resolution is Å, or kms-1. We used the N512 filter with an FWHM of 60 Å, centered at . The FWHM includes only the galaxy velocity dispersion in the Coma core. In the current instrument configuration the dispersion axis is the axis, while the spatial direction is along the axis. For a detailed description of the technique and signal-to-noise calculations we refer to Gerhard et al. (2005).
2.1 Data reduction
The complete data reduction of the three observed MSIS masks was carried out in IRAF and included the following standard steps: correction for bias/flatfield, frames alignment and co-addition. We had 13 frames in the first two masks respectively, and 6 frames for the third mask; the final three coadded MSIS images for the 3 masks were then free of cosmic rays. Flux calibration was done using the spectrophotometric standard star BD .
The median averaged MSIS frame for each night was inspected for the presence of emission line objects. Monochromatic, point-like emitters appear as elongated ellipses on the CCD, with a width which depends on the binning adopted for the coordinate and seeing ( pix for 1st and 2nd night, 4 pix for the night) and a height of 5 pixels in the wavelength direction.
In these scientific frames we looked for three kinds of emission line objects:
-
•
unresolved (both in wavelength and in space) emission line objects with no continuum, which are our ICPN candidates;
-
•
continuum point-like sources with unresolved/resolved line emissions. These are most likely background galaxies;
-
•
unresolved line emissions associated with the extended continuum halo of any of the Coma galaxies in the field - these are compatible with being PNe associated with the stellar population emitting the continuum light. In this case, a check on the measured LOS velocity is required to confirm the PN candidate – galaxy association.
2D slit spectra which contained one of these objects were then extracted, rectified and wavelength calibrated.
A detailed description of the data reduction, including astrometry and positions of the emission line candidates, is described in Arnaboldi et al., in preparation.
3 Spatial and velocity distribution of ICPNe in the MSIS field
Figure 1 shows the spatial distribution of all IPCN candidates in the MSIS field, and Figure 2a shows the LOS velocity distribution of the ICPNe associated with the diffuse light in the Coma cluster core. The LOS velocities of the PN candidates show a clear association with the Coma cluster. The average velocity of the distribution is 6315 kms-1 and the standard deviation is 867 kms-1, but two substructures are also clearly visible, with a main peak at kms-1 and a secondary peak at kms-1. The main peak in the LOS velocity distribution of PN candidates is close to the systemic velocity of NGC 4889, kms-1.
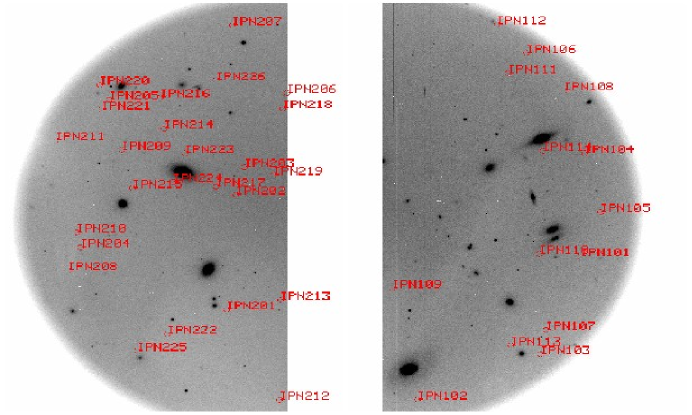
Figure 2b shows the velocity distribution of the Coma galaxies in a field centred on the MSIS position. This has multiple peaks: the largest peak is coincident with the kms-1 of NGC 4889, and two less prominent peaks are at kms-1 and kms-1.
The main peak of the ICPN velocity histogram coincides with that of the Coma galaxy velocities around the MSIS field, and it is centered on the systemic velocity of NGC 4889 at kms-1. The galaxy NGC 4874, which lies nearer to the MSIS field, the peak of the X-ray emission, and the center of the larger-scale X-ray emission (White et al 1983), is at kms-1, displaced by kms-1 from the velocity peaks for both the galaxies and the ICPNs. Hence the ICPNs associated with the diffuse light at the position of the MSIS field are not bound to the nearby NGC 4874, but have motions similar to those of the Coma galaxies in this field.
Acknowledgements.
We would like to acknowledge the financial support by the Swiss SNF and by INAF. We are grateful to the on-site Subaru staff for their support.References
- [Adami et al.(2005)] Adami, C., Biviano, A., Durret, F., Mazure, A., 2005, AA, 443, 17
- [Aguerri et al.(2005)] Aguerri, J.A.L., Gerhard, O.E., Arnaboldi, M., Napolitano, N., et al.2005, AJ, 129, 2585
- [Arnaboldi et al.(2004)] Arnaboldi, M., Gerhard, O.E., Aguerri, J.A.L., et al., 2004, ApJ (Letters), 614, L33
- [Bernstein et al. (1995)] Bernstein, G.M., Nichol, R.C., Tyson, J.A., Ulmer, M.P., Wittman, D., 1995, AJ, 110, 1507
- [Feldmeier et al.(2004)] Feldmeier, J.J., Mihos, J.C., Morrison, H.L., Harding, P., et al., 2004, ApJ, 609, 617
- [Gerhard et al.(2005)] Gerhard, O., Arnaboldi, M., Freeman, K.C., et al., 2005, ApJ (Letters), 621, L93
- [Krick et al.2006] Krick, J.E., Bernstein, R.A., Pimbblet, K.A., 2006, AJ, 131, 168
- [Mihos et al.(2005)] Mihos, J.C., Harding, P., Feldmeier, J., Morrison, H., 2005, ApJ (Letters), 631, L41
- [White et al.1983] White, S.D.M., Briel, U.G., Henry, J.P., 1983, MNRAS, 261, L8
- [Zibetti et al.2005] Zibetti, S., White, S.D.M., Schneider, D.P., Brinkmann, J., 2005, MNRAS, 358, 949