The SDSS-DR5 Survey for Proximate Damped Ly Systems
Abstract
Using the Sloan Digital Sky Survey, Data Release 5 (SDSS-DR5), we survey proximate damped Ly systems (PDLAs): absorption line systems with H I column density at velocity separation from their background quasar. These absorbers are physically associated with their background quasars, and their statistics allow us to study quasar environments out to . However, the large ionizing flux emitted by a quasar can ionize the neutral gas in a nearby galaxy possibly giving rise to a “proximity effect”, analogous to the similar effect observed in the Ly forest. From a sample of 111, we measure the H I frequency distribution , incidence, and gas mass density of the PDLAs near luminous quasars over the redshift interval to 5. The incidence and mass density of PDLAs at is approximately twice that of intervening DLAs, but at and the distribution is consistent with the intervening population. We interpret the observed enhancement of PDLAs around quasars in terms of quasar-galaxy clustering, and compare the strength of the clustering signal to the expectation from independent measures of the respective clustering strengths of DLAs and quasars, as well as a complementary analysis of the clustering of absorbers around quasars in the transverse direction. We find that there are a factor of fewer PDLAs around quasars than expected and interpret this result as evidence for the hypothesis that the ionizing flux from the quasars photoevaporates H I in nearby DLA galaxies, thus reducing their cross-section for DLA absorption. This constitues the first detection of a “proximity effect” for DLAs.
Submitted to ApJ; March 16 2007
1 Introduction
Although quasars are believed to reside at the centers of massive galaxies which are themselves located in groups or clusters, their spectra rarely exhibit the absorption signature of either their host’s neutral interstellar medium (ISM) or the ISMs of associated nearby galaxies111The relatively few cases where one observes significant absorption at are characterized by very broad features and are termed Broad Absorption Line (BAL) quasars. These BAL quasars are typically attributed to gas with extreme densities and large velocity fields residing in the broad line region of the quasar (e.g. Weymann et al., 1991; Tolea, Krolik & Tsvetanov, 2002; Reichard et al., 2003; Trump et al., 2006) and should not be confused with the much larger galactic scale absorption which causes DLAs.. Nearly every galaxy at should exhibit an ISM comprised of neutral hydrogen. If the quasar sightline penetrates this ISM, it will absorb light along the hydrogen Lyman series, with strongest absorption at Ly: Å. Systems with H I column densities exceeding are termed damped Ly (DLA) systems owing to the strong damping wings that they exhibit (see Wolfe, Gawiser & Prochaska, 2005, for a review). Gas clouds at these high column densities, characteristic of a galactic disk, are optically thick to Lyman continuum () photons, giving rise to a neutral interior self-shielded from the extragalactic ionizing background.
One might guess that the absence of DLAs near most quasars is related to the large ionizing flux emitted by the quasar. In particular, for a quasar at with an -band magnitude of , the flux of ionizing photons is 400 times higher than that of the extragalactic UV background at a comoving distance of (corresponding to Hubble flow velocity of km s-1), and increasing as toward the quasar. Indeed, the decrease in the number of optically thin absorption lines ( hence ), in the vicinity of quasars, known as the proximity effect (Bajtlik, Duncan & Ostriker, 1988), is well studied and has been detected (Scott et al., 2000; Faucher-Giguere et al., 2007).
On the other hand, it has long been known that quasars are associated with enhancements in the distribution of galaxies (Bahcall, Schmidt & Gunn, 1969; Yee & Green, 1984, 1987; Bahcall & Chokshi, 1991; Smith, Boyle & Maddox, 2000; Brown, Boyle & Webster, 2001; Serber et al., 2006; Coil et al., 2007), although these measurements of quasar galaxy clustering are mostly limited to low redshifts . Recently, Adelberger & Steidel (2005), measured the clustering of Lyman Break Galaxies (LBGs) around luminous quasars in the redshift range (), and found a best fit correlation length of (), very similar to the auto-correlation length of LBGs (Adelberger et al., 2003, 2005). Cooke et al. (2006) recently measured the clustering of LBGs around DLAs and measured a best fit with , but with large uncertainties (see also Gawiser et al., 2001; Bouché & Lowenthal, 2004). If LBGs are clustered around quasars, and DLAs, might we expect DLAs to be clustered around quasars? This is especially plausible in light of recent evidence that DLAs arise from a high redshift galaxy population which are not unlike LBGs (Møller et al., 2002).
Can DLAs continue to self-shield against the large flux of ionizing photons emitted by quasars or are they be photoevaporated? Is the distribution of DLAs around quasars dominated by ionization effects or does galaxy clustering around the quasars dominate? Does the column density distribution of DLAs near quasars differ from the distribution in average places in the Universe? What can quasar-DLA clustering teach us about quasars and the physical nature of high redshift galaxies?
In this paper, we take positive step towards answering these questions by measuring the abundance and distribution of DLAs near quasars. Recently, (Prochaska, Herbert-Fort & Wolfe, 2005, ; hereafter PHW05) surveyed the quasar spectra of the Sloan Digital Sky Survey (SDSS) Data Release 3 (Abazajian et al., 2005) for damped Ly systems at . The statistical survey, comprising over 500 DLA systems, provides a relatively precise measure of the incidence of intervening DLA systems per unit redshift, , from to 4. To focus on the cosmic average of and avoid biases from the quasar environment, PHW05 excluded proximate DLAs (PDLAs) from their analysis, which are defined to be DLAs with velocity offset from the emission redshift of the background quasars222At corresponds to roughly 30 comoving Mpc assuming and km s-1 Mpc-1.. Here we present the results of a survey for proximate damped Ly (PDLA) systems in the full SDSS Data Release 5 (DR5 Adelman-McCarthy et al., 2006).
The first statistical study of PDLAs was performed by Ellison et al. (2002) who surveyed their sample of radio-selected QSOs. Our work is motivated by this and several recent, closely related studies. First, Russell et al. (2006; hereafter REB06) have previously performed a search of a subset of the SDSS-DR3 quasar spectra for PDLAs. They reported an enhancement of for DLA systems with and, oddly, an enhancement of PDLAs with , corresponding to very large distances () from the quasar if interpreted as Hubble flow. Our search builds on their work, but we survey the larger SDSS-DR5 to recover a final sample with nearly an order of magnitude more PDLA systems. Second, Hennawi et al. (2006) published a large sample of optically thick absorption line systems in the vicinity of quasars, which were identified using a background line-of-sight in close projected quasar pair systems. Based on this sample, Hennawi & Prochaska (2006) measured the cross-correlation function between foreground quasars at and optically thick absorbers, detected in the background quasar spectra. Their measurement of the transverse clustering of absorbers around quasars should be commensurate with incidence of similar systems along the line-of-sight, provided that the clustering pattern of absorbers around quasars is isotropic. However, Hennawi & Prochaska (2006) argued that the strength of the transverse clustering predicts that of all quasars should show a absorber within km s-1, which is certainly not observed. Finally, another goal of our survey is to identify candidates for follow-up observations to study Ly emission from PDLAs which could possibly yield insights into fluorescent Ly recombination radiation from DLAs, the size of DLA galaxies, and the physics of Ly halos surrounding high quasars (Hennawi et al., ).
In the following section, we describe the survey and search for PDLA candidates and, in 3, we discuss their measurements. A new estimate of the quasar redshifts with PDLA candidates is given in 4. The H I frequency distribution and incidence of PDLA systems is presented in 5 and we discuss these results in terms of clustering and the proximity effect in 6. We summarize and conclude in 7. Throughout the paper we adopt a CDM cosmology with and Mpc-1.
2 Survey Design and PDLA Candidates
We began with the full SDSS-DR5 sample of 67000 spectroscopically classified quasars. The SDSS fiber-fed spectrometer gives a FWHM resolution of Å and wavelength coverage spanning 3800 to 9200Å. Following PHW05, we demanded that the quasar spectrum exhibit at least one region where the median signal-to-noise (S/N) of 20 consecutive pixels equals or exceeds 4. This requirement eliminates many of the quasars at which have poorer S/N data. For each QSO, we determine a starting and ending redshift and which determines the search path of that object:
| (1) |
In the PHW05 analysis, corresponded to the first pixel where the data satisfied the S/N requirement under the restriction that this not occur within 10000km s-1 of the Ly+O VI emission region of the QSO333Note that PHW05 failed to implement this restriction in their published sample. Although the differences to the computed statistics of the intervening DLA systems are small, future analyses by those authors will properly implement the algorithm and the authors provide the correct SDSS-DR3 statistical sample at http://www.ucolick.org/xavier/SDSSDLA. The analysis here includes the proper statistical sample. . For a search focusing on PDLA systems, we will define to be a velocity blueward of under a strict restriction: the quasars must also satisfy the S/N criterion at a velocity greater than (3000km s-1 + ) from the QSO. We adopt this restriction for two reasons: (i) we wish to avoid the presence of a DLA system with from biasing the S/N below our criterion; (ii) as discussed in 5, we wish to maintain a search path for each QSO to be set exactly by .
| Plate | MJD | FiberID | Name | |||||
|---|---|---|---|---|---|---|---|---|
| 750 | 52235 | 82 | J000009.385618.4 | 2.240 | … | 0 | … | |
| 650 | 52143 | 178 | J000050.602155.8 | 2.640 | … | 0 | 2.604 | |
| 750 | 52235 | 550 | J000143.412021.4 | 2.638 | … | 0 | 2.602 | |
| 650 | 52143 | 519 | J000159.124712.4 | 2.308 | … | 0 | 2.276 | |
| 387 | 51791 | 556 | J000221.112149.4 | 3.057 | … | 0 | 3.017 | |
| 650 | 52143 | 111 | J000238.411149.8 | 3.941 | … | 0 | … | |
| 750 | 52235 | 608 | J000300.340027.7 | 3.675 | … | 0 | 3.629 | |
| 650 | 52143 | 48 | J000303.345150.6 | 3.647 | … | 1 | 3.600 | |
| 750 | 52235 | 36 | J000335.214743.6 | 3.484 | … | 0 | … | |
| 650 | 52143 | 604 | J000413.635529.5 | 2.424 | … | 0 | 2.390 |
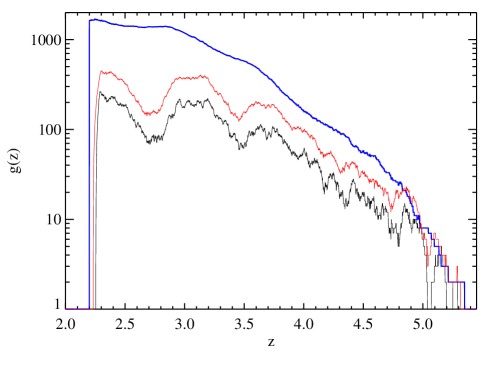
The total redshift search path of the survey can be summarized by its sensitivity function (e.g. Lanzetta, 1993):
| (2) |
where is unity if is included within a given quasar’s search path and zero otherwise. The function for the SDSS-DR5 database is shown in Figure 1 for and 6000km s-1 (bottom and middle curves respectively). For comparison, we show the same quantity for the intervening DLA search of PHW05 (corrected for the error described in footnote 3). In contrast to the intervening curve, the PDLA curves show significantly more structure. The curves closely track the redshift distribution of SDSS quasars and most of the structure is the result of the SDSS quasar target selection algorithm (Richards et al., 2004). On average, the intervening DLA search path is higher than the PDLA path for and higher at . If the incidence of PDLA systems matches that of intervening DLAs, then we will expect to find a statistical sample with to fewer systems than PHW05, i.e. systems.
Every quasar with an emission redshift measured to be greater than 2.2 by the SDSS pipeline was searched for a PDLA candidate. The search algorithm is nearly identical to the algorithm described in PHW05 for intervening absorbers, only modified to find candidates up to 7000km s-1 redward of . The algorithm keys on any regions in the spectrum where the S/N is coherently low over a window of Å. The algorithm triggers on the cores of damped Ly systems, but also on the metal-line absorption features of strong BAL systems. Therefore, we removed BAL quasars from the search sample; all of the SDSS-DR5 quasars were visually inspected and those exhibiting very strong C IV profiles at were eliminated. Because many PDLA systems will exhibit strong C IV absorption, we chose to flag only those where the C IV doublet is blended with itself (i.e. ) and the rest equivalent width exceeds Å. We admit, however, that this ‘by-eye’ analysis is somewhat subjective and, in general, we conservatively included border-line cases under the expectation that a true BAL would not show damped Ly absorption. All of the quasars comprising the search are listed in Table 1.
3 MEASUREMENTS
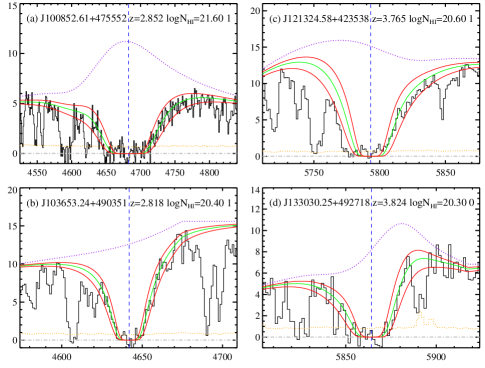
Our procedure to measure the values of the PDLA candidates follows that of PHW05 and, in fact, we adopt their published values for PDLA candidates from the Data Release 3. For each new PDLA candidate, we searched for the presence of metal-line absorption near the redshift of the Ly centroid. Because the absorption redshift coincides with the quasar emission redshift (), the strong low-ion transitions of Si II 1206, C II 1334, and Al II 1670 generally lay clear of the Ly forest and we found that nearly every PDLA system exhibit at least one of these transitions. We defined to be the centroid of the strongest, unblended low-ion transition.
We then fit a Voigt profile to the candidate’s Ly profile while also estimating the quasar continuum. The latter effort is significantly complicated by the quasar’s Ly and N V emission lines. We guided the continuum placement by the observed heights of the Ly and C IV emission features, but the systematic uncertainty related to this exercise dominates the errors reflected in our measurements of . Therefore, while we have reported relatively conservative errors for the measurements, we are certain the error distribution is non-Gaussian. For example, we expect that the probability of an error greater than is not less than . We do believe, however, that of the values lie within of the reported measurements.
| Quasar | log | ||
|---|---|---|---|
| J004142.55704.6 | 3.6069 | 2 | |
| J014049.13942.5 | 3.6966 | 2 | |
| J014214.72324.3 | 3.3482 | 2 | |
| J074823.82051.2 | 2.9755 | 2 | |
| J075901.24703.4 | 2.8226 | 2 | |
| J080523.34921.1 | 3.4774 | 0 | |
| J080553.02937.3 | 3.4294 | 2 |
| Quasar | log | ||
|---|---|---|---|
| J001134.55137.4 | 4.3175 | 1 | |
| J001134.55137.4 | 4.3592 | 2 | |
| J014214.72324.3 | 3.3482 | 2 | |
| J074823.82051.2 | 2.9755 | 2 | |
| J075901.24703.4 | 2.8226 | 2 | |
| J080553.02937.3 | 3.4294 | 2 | |
| J081114.33633.2 | 3.0415 | 1 | |
| J081543.10037.0 | 3.1780 | 2 | |
| J081813.03136.9 | 4.1610 | 2 | |
| J082021.30327.2 | 4.2838 | 2 |
A set of representative fits is shown in Figure 2. One notes, in several cases, the challenges of continuum placement (dotted line) near the Ly emission line. One also notes cases where the PDLA Ly profile is significantly blueward of the quasars Ly emission line. This is a clear indication that determinations of based primarily on Ly emission will give a poor result. We will return to this issue in the following section. The complete set of fits can be found at http://www.ucolick.org/xavier/SDSSDLA. Finally, we wish to briefly compare the values we derived with those reported in REB06 (measured from the same spectra). As REB06 noted, the agreement between their vales and PHW05 is good. We identify a few cases (e.g. the DLA at toward J111224.18+004630.3), however, where we find much lower values than REB06. In these cases, we have verified our lower values by analyzing the corresponding Ly profile.
4 NEW MEASUREMENTS OF QUASAR REDSHIFTS
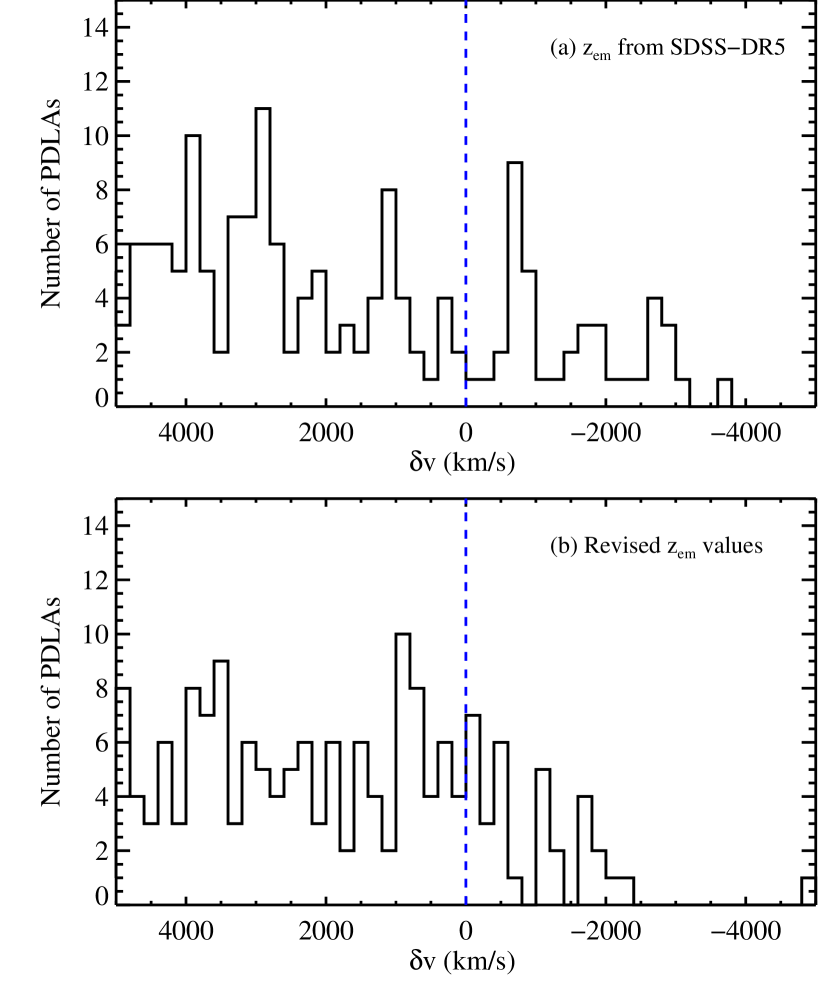
In Figure 3a we present a histogram of the velocity offsets,
| (3) |
with between for all of the fitted PDLA candidates and from its corresponding quasar as listed in the SDSS-DR5 database. It is evident from the figure that the quasar redshifts are systematically in error. The presence of very few PDLA candidates with and many examples with very negative suggests that the Ly absorption profiles of PDLA systems have significantly biased the measurement of away from its correct value.
It is well known that the primary rest-frame ultraviolet quasar emission lines which are redshifted into the optical for , can differ by up to km s-1 from systemic, due to outflowing/inflowing material in the broad line regions of quasars (Gaskell, 1982; Tytler & Fan, 1992; Vanden Berk et al., 2001; Richards et al., 2002). The quasar redshifts provided by the SDSS spectroscopic pipeline come from a maximum likelihood fit to multiple emission lines (see e.g. Stoughton et al., 2002), which does not result in robust systemic redshifts estimates. Concerned that the errors in will significantly affect our clustering analysis, we estimated the systemic emission redshift of every QSO with a PDLA candidate exhibiting and , following the approach described in Shen et al. (2007, see also Hennawi et al. 2006). Shen et al. (2007) measured the correlation between the relative shifts of the high-ionization emission lines Si IV, C IV, C III, and the shift between these respective lines and the Mg II line. Since the redshift defined by Mg II is tightly correlated with the systemic redshift (Richards et al., 2002), the Shen et al. (2007) approach exploits these correlations to “shift” into the systemic frame. The emission lines in the SDSS spectra were centered using the algorithm described in Hennawi et al. (2006) which was also employed by Shen et al. (2007). The updated redshifts are presented in column 6 of Table 1.
In the lower panel of Figure 3, we present the velocity offsets for all PDLA candidates with . We note a nearly smooth distribution of systems with and PDLA with . Although we expect the revised redshifts still suffer from systematic uncertainties, we are optimistic that the uncertainty is smaller than a few hundred km s-1 and, more importantly, that the errors are symmetrically distributed. One may be concerned that we have restricted the new measurements to a subset of the SDSS-DR5 QSO database. As discussed below, because we include all PDLA systems with negative in our clustering analysis, the error in for quasars without PDLA candidates should have minimal effect on our results.
| Form | Parameters | |||
|---|---|---|---|---|
| Single | ||||
| Gammaa | ||||
5 THE H I FREQUENCY DISTRIBUTION AND ITS MOMENTS
5.1
Akin to the luminosity function of galaxies,
the fundamental measure of a DLA sample is its H I
frequency distribution, .
Here, is the absorption distance (Bahcall & Peebles, 1969) defined
to give a constant comoving distance.
Following PHW05, we
have calculated for the PDLA systems. The results
are presented in Figure 4 and given in
Table 4. We have fitted the frequency distribution
with a single power-law
and a -function
.
The maximum likelihood solutions are overplotted in
the Figure. The power-law has exponent while
the -function has a similar power-law slope and allows any value
at the 95 c.l.
We conclude that the PDLA sample does not show a break from
a single power-law model.
For comparison, we also show the best-fit -function for
of intervening DLA from PHW05 renormalized to give
the same number of PDLA systems as observed. The shaded region
shows the approximate uncertainty in the shape of this
-function.
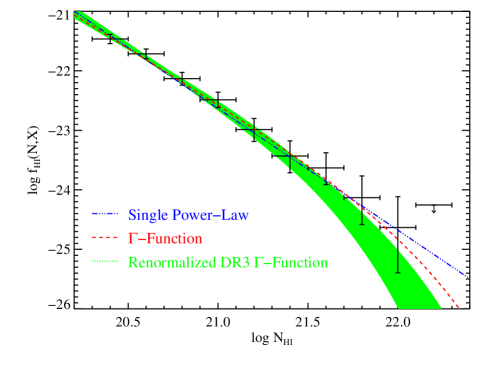
The figure suggests that the values of the PDLA sample are not drawn from the same parent population as intervening DLA systems. We find, however, that a two-sided Kolmogorov-Smirnov (KS) test gives a probability of 30 for the null hypothesis. This rather high probability may be misleading, however, because the standard KS-test focuses on the median of the two distributions which is dominated by the lower values. From the Figure, it is evident that the two distributions only differ in the high tail of the samples. Integrating the re-normalized -function for the intervening DLA from to infinity, we predict 2.1 absorbers compared against the 6 that are observed with . Even if we ignore the uncertainty in the predicted incidence, the Poisson error on six absorbers implies they differ at only significance (i.e. 95 c.l.). Therefore, we contend that the figure is suggestive but there is no conclusive evidence for a difference in the shape of for the proximate and intervening DLA systems. We also note that there is no statistically significant difference in if we compare two bins of PDLA systems split at (Table 4).
| () | ||||||
|---|---|---|---|---|---|---|
| 2.2,2.5] | 8 | 48.5 | 158.1 | |||
| 2.5,3.0] | 22 | 59.6 | 206.6 | |||
| 3.0,3.5] | 49 | 72.0 | 265.5 | |||
| 3.5,5.0] | 28 | 58.6 | 235.2 |
5.2 THE INCIDENCE OF PDLA SYSTEMS ()
The zeroth moment of the H I frequency distribution gives the incidence of absorbers along the sightline. Authors traditionally express this quantity per unit redshift, . Of greater interest to the nature of the DLA systems is the incidence per unit absorption distance, . We will consider both quantities. It is standard practice to discretely estimate with a calculation evaluated over a redshift interval ,
| (4) |
where is the number of DLA systems within the redshift interval.
For our evaluation of and we include a subtle but important modification. Although we have defined the search path of each quasar to be from to (Equations 1,3) for quasars with , we also include all of the absorbers with in our calculation of . That is, we increment by one for each damped Ly system with even though we have defined the search path to have . At first glance, it appears that we will overestimate . We have adopted this formalism, however, to account for the relatively large systematic uncertainties in the quasar redshifts ( 4). If these errors are roughly symmetric then we will have as many PDLA shifted outside the sample as shifted in at the boundary . Similarly, for any given quasar we will be searching a little more or less redshift path than 3000 km s-1 depending on the sense of the quasar redshift error, but the total search pathlength will be approximately correct. At the same time, however, we must include all PDLA systems with to accurately assess .
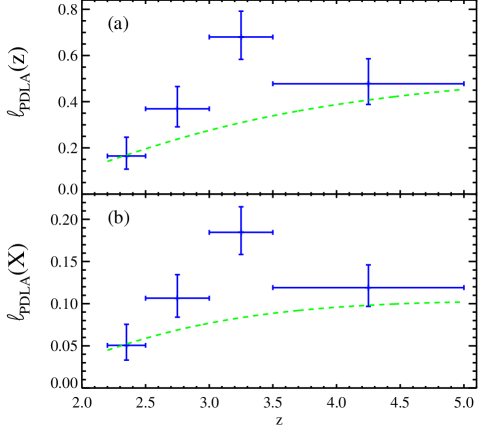
Figure 5 presents (a) and (b) as a function of redshift for the PDLA systems. The curves in each panel correspond to
| (5) |
which is a good representation444The function is not properly normalized at but one could add a small offset to achieve this. of for the intervening DLA systems at . In fact, a power-law representation of the form (e.g. Storrie-Lombardi & Wolfe, 2000) is no longer a good description of the observations at high .
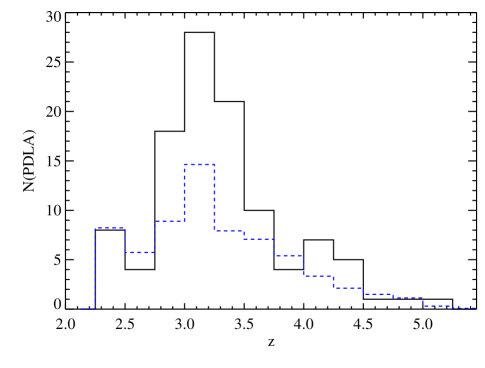
The two panels show similar results. One observes an enhancement in the incidence of PDLA systems for to 3.5 and that the incidence of PDLA is consistent with the intervening values at other redshifts. Because the representation of given by Figure 5 may be sensitive to the binning, we also compare the proximate and intervening DLA systems as a function of redshift in histogram form (Figure 6). Here, we have histogrammed the redshifts of the PDLA systems in the full sample and overplotted the predicted number calculated by convolving the redshift search path with the incidence of intervening DLAs (Equation 5).
If we assume Poisson statistics, we find that the 95 c.l. intervals of the and do not overlap for the PDLA and intervening systems. Similarly, we find that the c.l. intervals on for do not overlap. We conclude, therefore, that the PDLA systems exhibit a higher incidence than the intervening DLA in the redshift range but are otherwise consistent with the cosmic average. We will attempt to interpret this rather unusual signal in the following section.
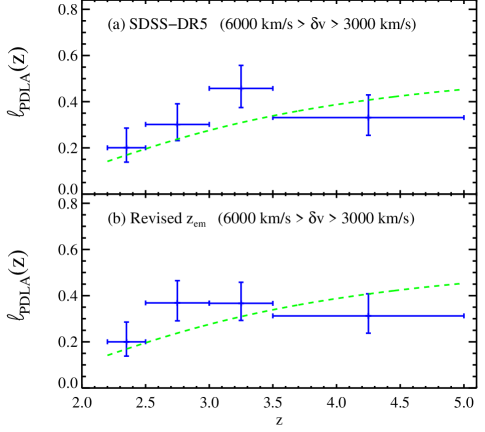
A puzzling result from REB06 was that the authors reported an enhancement in for DLA systems with , which even exceeded that for PDLAs with . Such an enhancement is very unlikely to be related to absorber clustering near quasars. At , corresponds to . Even for the strong high redshift quasar clustering measured by Shen et al. (2007) (e.g. with and at a relatively small enhancement is expected at such large distances from the quasar. In Figure 7 we present for adopting (a) the SDSS-DR5 quasar redshifts and (b) our revised values. Although the latter shows a mild enhancement in at , the effect is significantly smaller than REB06. Adopting the revised redshifts, furthermore, we derive values consistent with the cosmic average. We suspect, therefore, that the REB06 result for was predominantly the result of spurious redshifts, although they reached qualitatively similar conclusions as our own when restricting to .
REB06 also reported an enhancement in PDLA of a factor with significance at a mean redshift . Our results indicate a larger enhancement and much higher statistical significance at this redshift. Again, the differences are related to our larger sample size and errors in the values reported by the SDSS. We also note that our results more resemble those from Ellison et al. (2002) who had more precisely measured QSO redshifts given the lower median redshift of their sample.
5.3 THE H I MASS DENSITY WITHIN Mpc OF QUASARS ()
The first moment of the H I frequency distribution yields the mass density in H I atoms:
| (6) |
where is the mean particle mass per of the gas (taken to be 1.3), is Hubble’s constant, and is the critical mass density. Because the damped Ly systems dominate this integral (Prochaska & Herbert-Fort, 2004; O’Meara et al., 2007) and because they are predominantly neutral, an evaluation of Equation 6 from to infinity gives an accurate estimate of the mass density of neutral gas. For this analysis, we have focused on proximate DLA systems with roughly correspondingly to a comoving 30 Mpc . We will refer to this quantity as , the average mass density of neutral gas measured along an path toward quasars with a median -magnitude of 19.1 mag.
Following standard practice (e.g. PHW05), we estimate with a discrete evaluation:
| (7) |
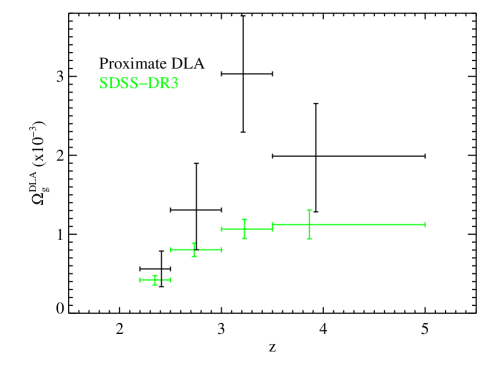
where the sum is performed over the measurements of the damped Ly systems in a given redshift interval with survey pathlength . The results are presented in Figure 8 and compared against the mass density for intervening damped Ly systems, , determined from the DR3 sample (PHW05). Similar to the zeroth moment of , we find that is consistent with at but exceeds at . Although the uncertainty in is large, the enhancement over is significant at greater than c.l. in the to 3.5 interval.
There are two additional points to emphasize with regards to our estimation of . First, we do not have a large enough sample of proximate DLAs to determine the inevitable break in the power-law for observed for . Therefore, our evaluation of is formally a lower limit at all redshifts. Second, as noted above, we are measuring along biased sightlines. If bright quasars photoionize significant quantities of neutral hydrogen gas and anisotropically, we will underestimate if magnitude-limited quasar surveys are biased to these viewing angles. We suspect that the first effect (sample size) is a less than factor of two effect while we will consider simple models of the latter effect in the following section.
We have performed the following, simple calcluation in an attempt to estimate a lower limit to the dark matter mass of halos hosting quasars. At , we have calculated the dark matter density within 30 Mpc of the most massive dark matter halos in a cosmological box 600 Mpc on a side. The mean value never exceeds 1.5 times the mean density at this epoch. We reach the obvious conclusion that the H I mass density must increase non-linearly (e.g. ) with dark matter overdensity. Therefore, a direct comparison with our observations will require a full hydronamical simulation that includes an extragalactic background radiation field and radiative transfer.
6 DISCUSSION
In this section we physically interpret the incidence of PDLA systems measured in § 5.2, by considering two complimentary measurements: the clustering of optically thick absorbers around quasars in the transverse direction, measured from close projected pairs of quasars (Hennawi & Prochaska, 2006), and the strength and evolution of the auto-correlation function of high-redshift quasars (Shen et al., 2007). Because PDLAs can be detected in absorption against bright background quasars out to their statistics probe the environments of quasars to much higher redshifts555This redshift limit is set by the small number of quasars with . than galaxy cross-correlation studies (Adelberger & Steidel, 2005; Coil et al., 2007). However, the large ionizing flux emitted by a quasar can ionize the neutral gas in nearby galaxies, thus reducing their absorption cross-section (Hennawi & Prochaska, 2006). The interpretation of PDLA incidence as a measure of quasar-galaxy clustering is thus complicated by ionization effects. Nevertheless, the physical problem of a quasar illuminating a self-shielding optically thick absorber is very rich and can teach us much about both quasars and high-redshift galaxies.
Following Hennawi & Prochaska (2006), we can describe the increase or decrease in the line density, , of proximate DLAs at a velocity separation from a quasar with the ‘line-of-sight’ (LOS) correlation function
| (8) |
where represents the cosmic average line density (PHW05) and indicates the width of the velocity interval searched. The LOS correlation function is given by an average of the quasar-absorber correlation function, , over a cylinder with cross-section equal to the DLA cross-section and extent along the line-of-sight direction. Here is the scale factor and is the Hubble constant at redshift . For velocity separations close to the quasar, depends on the size of the absorber cross-section, which is unknown. In what follows, we assume a plausible radius of . Increasing by a factor of two results in a factor of two decrease in (see Figure 2 of Hennawi & Prochaska, 2006).
Using projected pairs of quasars, Hennawi & Prochaska (2006) measured the cross-correlation between foreground quasars at and optically thick absorbers, detected in the background quasar spectra. Assuming a power law shape for the quasar-absorber cross-correlation function, they measured for , or for . This measurement of the transverse clustering of absorbers around quasars should be commensurate with the line-of-sight clustering probed by the incidence of PDLA systems, provided that the clustering pattern of absorbers around quasars is isotropic. However, Hennawi & Prochaska (2006) argued that the strength of the transverse clustering predicts that of all quasars should show a absorber within km s-1, which is not observed (O’Meara et al., 2007). Thus, the transverse clustering overpredicts the number of absorbers along the line-of-sight by a large factor, or equivalently the clustering pattern is highly anisotropic. The most plausible physical explanation is that the transverse direction is less likely to be illuminated by ionizing photons than the line-of-sight, either due to anisotropic emission, or variability of the quasar emission on timescales short compared to the transverse light crossing time (). We revisit this issue of anisotropic clustering with the statistics of PDLAs below.
Shen et al. (2007) recently quantified the clustering of high-redshift () quasars and measured a comoving auto-correlation length of for quasars in the redshift range , and an even stronger for quasars. High redshift quasars are thus much more strongly clustered than their counterparts, which have (see e.g. Porciani, Magliocchetti & Norberg, 2004; Croom et al., 2005; Porciani & Norberg, 2006), and the evolution of the quasar clustering strength with redshift is extremely rapid. Naively, we expect this to drive a rapid evolution in the cross-correlation of quasars with DLAs.
Our strategy for comparing the PDLA clustering to these complimentary measurements is to normalize the quasar-DLA cross-correlation strength to the transverse Hennawi & Prochaska (2006) result at , and assume that the clustering of DLAs does not evolve with redshift, but that the quasar clustering evolves as measured by Shen et al. (2007). Specifically, we use the relation
| (9) |
to determine the parameters of the and propagate errors according to those quoted by both measurements. Shen et al. (2007) measured the auto-correlation function of quasars in two redshift bins and , very similar to the two high redshift bins in this work. Quasar clustering has not yet been measured in the redshift range , so we linearly interpolate between the Shen et al. (2007) result and the redshift evolution measured by Porciani & Norberg (2006)666 A small correction is applied to account for the fact that Shen et al. used a different power law slope () than Porciani & Nordberg ()..
A few limitations to our approach should be noted. First, by assuming the DLA clustering does not evolve, we might overestimate (underestimate) the strength of the quasar-DLA cross-correlation function if DLA-galaxies are less (more) clustered at high redshift. However, Adelberger et al. (2005) found that the clustering of LBGs is very nearly constant in the range over the redshift range , and Ouchi et al. (2004) similarly measured the correlation lengths of LBGs and found a correlation length of which was nearly constant with redshift. In light of evidence that DLA-galaxies are drawn from a similar (but fainter) galaxy population as spectroscopically selected LBGs (Møller et al., 2002; Schaye, 2001), it is reasonable to assume that DLA clustering does not evolve significantly. Second, the Hennawi & Prochaska (2006) measurement was for all absorbers with , so by applying that measurement to the DLAs () we implicitly assume that the clustering of absorbers is independent of column density777This is a reasonable assumption if absorbers with arise from material at larger impact parameters from DLA systems (e.g. Maller et al., 2003).. Finally, it is conceivable that the (Hennawi & Prochaska, 2006) cross-correlation strength is over-estimated because of line-blending of systems near the column density threshold (), which results in a ‘Malmquist’-type bias because the line density of absorbers is a relatively steep function (O’Meara et al., 2007) of column density limit.
To address these issues we explore another avenue for estimating the autocorrelation of in eqn. 9. Namely, Cooke et al. (2006) used photometrically selected LBGs in the vicinity of DLAs to measure the cross-correlation between LBGs and DLAs at . Assuming they measured for the DLA-LBG cross-correlation, and for the LBG auto-correlation. From , we deduce the auto-correlation of DLAs to be (), which can then be used in eqn. 9, again assuming that that the DLA clustering does not evolve with redshift.
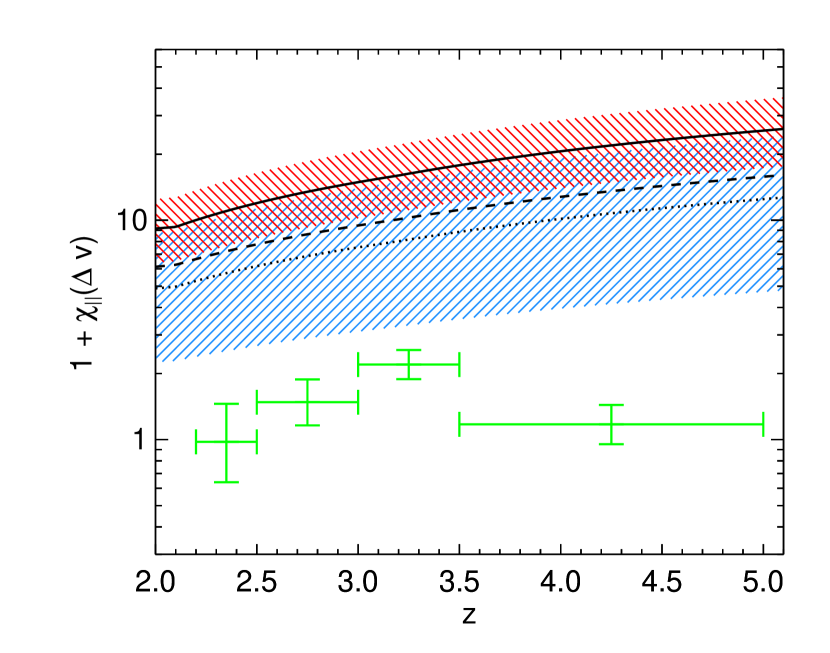
Our measurement of the evolution of the overdensity of PDLAs near quasars is compared to the implications of these other measurements in Figure 9. The (green) data points illustrate our measurement of the line-of-sight correlation function from the abundance of PDLAs (see eqn. 8). The solid curve shows the line-of-sight correlation function prediction when we combine the Shen et al. (2007) clustering results with the Hennawi & Prochaska (2006) quasar-absorber clustering measurement for . The upper (red) striped region illustrates the implied error from combining these results. The dashed curve shows the same quantity, but using the Hennawi & Prochaska (2006) measurement with a shallower slope of (the error region is comparable to the red striped region but not shown for clarity). The dotted curve and lower (blue) striped region are the line-of-sight correlation function and corresponding error when we combine the Shen et al. (2007) clustering results with DLA auto-correlation implied by the Cooke et al. (2006) measurements. The (red-blue) cross-hatching indicates the overlap of the error regions, and illustrates that the (Hennawi & Prochaska, 2006) results and Cooke et al. (2006) measurement are consistent within the errors.
A discrepancy is apparent between the predictions in Figure 9, which are driven by the strength of the quasar auto-correlation function and its rapid redshift evolution, and the relatively modest clustering of PDLAs around quasars and lack of evolution, measured here. This disagreement provides compelling evidence for the hypothesis that the ionizing flux from quasars photoevaporates H I in nearby DLA-galaxies, thus reducing their cross-section for DLA absorption. Hennawi & Prochaska (2006) used a simple photoevaporation model to show that optically thick absorbers with will be photoevaporated if they lie within of a luminous quasar, so our results are sensible on physical grounds.
The decrease in the number of optically thin Ly forest absorption lines in the vicinity of quasars, known as the proximity effect, has been detected and is well studied (Bajtlik, Duncan & Ostriker, 1988; Scott et al., 2000; Faucher-Giguere et al., 2007). The factor of discrepancy between the predicted clustering results and the data in Figure 9 provides compelling evidence that a similar proximity effect exists for optically thick absorption line systems. However, according to Hennawi & Prochaska (2006), there is no transverse proximity effect for optically thick absorbers, which gains further credibility in light of the null detections of the transverse effect in the (optically thin) Ly forest (Crotts, 1989; Dobrzycki & Bechtold, 1991; Fernandez-Soto et al., 1995; Liske & Williger, 2001; Schirber, Miralda-Escudé & McDonald, 2004; Croft, 2004, but see Worseck & Wisotzki (2006)), although these transverse studies are all based on only a handful of projected pairs. Both the optically thin results and our result for optically thick systems can be explained if the transverse direction is less likely to be illuminated by ionizing photons than the line-of-sight, either because the emission is anisotropic, or because the foreground quasar varies on timescales short compared to the transverse light crossing time () (see Hennawi & Prochaska, 2006, for a detailed discussion of both).
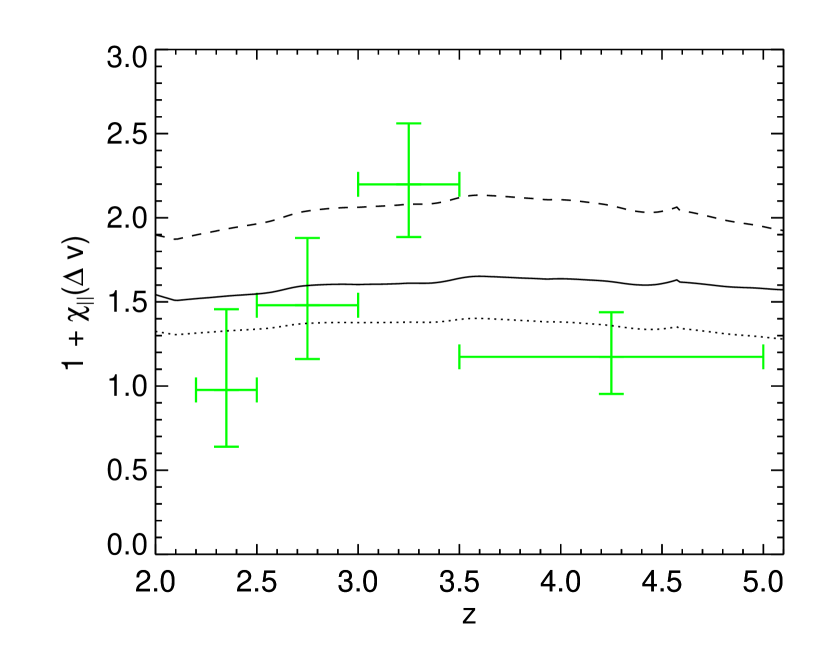
We use a toy model to illustrate how quasar-absorber clustering can be used to constrain the physical properties of DLAs following Hennawi & Prochaska (2006), who introduced a photoevaporation criterion for optically thick absorbers illuminated by quasars, motivated by the work of Bertoldi (1989). This criterion allows us to compute a minimum distance from the quasar, as a function of volume density, at which a DLA can self-shield against photoevaporation. In this context, the curves in Figure 9 represent predictions for the intrinsic clustering of DLAs around quasars in the absence of ionization effects. Because proximate absorbers lie along the line-of-sight, they must be exposed to the quasars ionizing flux, and we can calculate the reduction in the clustering strength because of photoevaporation (see Hennawi & Prochaska, 2006, for details). The solid, dashed, and dotted curves in Figure 10 represent predictions from the same measurements shown in Figure 9, but after taking photoevaporation into account using this simple approach. We used a volume density of hydrogen of and assumed the quasar had an average -band magnitude , which is the median of our PDLA sample. Although crude, this simple model illustrates how the density distribution in DLAs can be measured by comparing the abundance of PDLAs to the intrinsic quasar-DLA clustering, deduced either from the transverse quasar-DLA clustering or by combining independent measurements of quasar and DLA clustering.
7 SUMMARY
We surveyed the spectra of 5938 SDSS quasars in the redshift range for proximate DLAs within 3000 km s-1 of the quasar emission redshift, and presented the largest sample (111 systems) of PDLAs uncovered to date. Robust systemic redshifts of the quasars hosting these PDLAs were computed using a redshift estimator which which accounts for the relative shifts between quasar emission lines and the systemic frame, and which ignores the Ly emission line, which can be entirely absorbed for quasars with PDLAs. These improved redshifts allowed us to measure the abundance and distribution of PDLAs near quasars. The primary conclusions of this study are:
-
1.
There is suggestive evidence that the values of the PDLA population are not drawn from the same parent population as intervening DLA systems. Specifically, the PDLA sample does not show evidence for a break from a single power-law model. However, the statistical significance of the difference between the PDLA column density distribution and the underlying distribution of intervening DLAs is only at the level (i.e. 95 c.l.).
-
2.
PDLA systems exhibit a higher incidence than the intervening DLAs in the redshift range , but are consistent with the cosmic average at lower () and higher () redshifts.
-
3.
The average mass density meaured along an path toward the quasars we surveyed, , is consistent with the cosmic average, , at and . In the redshift interval an enhancement in is detected at greater than c.l. with central value 2̄ to 3 times .
-
4.
A comparison of the strength of the quasar auto-correlation function and its rapid redshift evolution, to the relatively modest clustering of PDLAs around quasars and a lack of significant evolution, provides compelling evidence for the hypothesis that the ionizing flux from quasars photoevaporates H I in nearby DLA-galaxies, thus reducing their cross-section for DLA absorption (Hennawi & Prochaska, 2006).
References
- Abazajian et al. (2005) Abazajian, K. et al. 2005, AJ, 129, 1755.
- Adelberger & Steidel (2005) Adelberger, K. L. and Steidel, C. C. 2005, ApJ, 627, L1.
- Adelberger et al. (2005) Adelberger, K. L. et al. 2005, ApJ, 619, 697.
- Adelberger et al. (2003) Adelberger, K. L. et al. 2003, ApJ, 584, 45.
- Adelman-McCarthy et al. (2006) Adelman-McCarthy, J. K. et al. 2006, ApJS, 666.
- Bahcall & Peebles (1969) Bahcall, J. N. and Peebles, P. J. E. 1969, ApJ, 156, L7+.
- Bahcall, Schmidt & Gunn (1969) Bahcall, J. N., Schmidt, M., and Gunn, J. E. 1969, ApJ, 157, L77+.
- Bahcall & Chokshi (1991) Bahcall, N. A. and Chokshi, A. 1991, ApJ, 380, L9.
- Bajtlik, Duncan & Ostriker (1988) Bajtlik, S., Duncan, R. C., and Ostriker, J. P. 1988, ApJ, 327, 570.
- Bertoldi (1989) Bertoldi, F. 1989, ApJ, 346, 735.
- Bouché & Lowenthal (2004) Bouché, N. and Lowenthal, J. D. 2004, ApJ, 609, 513.
- Brown, Boyle & Webster (2001) Brown, M. J. I., Boyle, B. J., and Webster, R. L. 2001, AJ, 122, 26.
- Coil et al. (2007) Coil, A. L. et al. 2007, ApJ, 654, 115.
- Cooke et al. (2006) Cooke, J. et al. 2006, ApJ, 652, 994.
- Croft (2004) Croft, R. A. C. 2004, ApJ, 610, 642.
- Croom et al. (2005) Croom, S. M. et al. 2005, MNRAS, 356, 415.
- Crotts (1989) Crotts, A. P. S. 1989, ApJ, 336, 550.
- Dobrzycki & Bechtold (1991) Dobrzycki, A. and Bechtold, J. 1991, ApJ, 377, L69.
- Ellison et al. (2002) Ellison, S. L. et al. 2002, A&A, 383, 91.
- Faucher-Giguere et al. (2007) Faucher-Giguere, C. . et al. 2007, ArXiv Astrophysics e-prints.
- Fernandez-Soto et al. (1995) Fernandez-Soto, A. et al. 1995, MNRAS, 277, 235.
- Gaskell (1982) Gaskell, C. M. 1982, ApJ, 263, 79.
- Gawiser et al. (2001) Gawiser, E. et al. 2001, ApJ, 562, 628.
- (24) Hennawi, J. F. et al. .
- Hennawi & Prochaska (2006) Hennawi, J. F. and Prochaska, J. X. 2006, ArXiv Astrophysics e-prints.
- Hennawi et al. (2006) Hennawi, J. F. et al. 2006, ArXiv Astrophysics e-prints.
- Lanzetta (1993) Lanzetta, K. M. 1993, in ASSL Vol. 188: The Environment and Evolution of Galaxies, ed. J. M. Shull and H. A. Thronson, 237.
- Liske & Williger (2001) Liske, J. and Williger, G. M. 2001, MNRAS, 328, 653.
- Maller et al. (2003) Maller, A. H. et al. 2003, MNRAS, 343, 268.
- Møller et al. (2002) Møller, P. et al. 2002, ApJ, 574, 51.
- O’Meara et al. (2007) O’Meara, J. M. et al. 2007, ApJ, 656, 666.
- Ouchi et al. (2004) Ouchi, M. et al. 2004, ApJ, 611, 685.
- Porciani, Magliocchetti & Norberg (2004) Porciani, C., Magliocchetti, M., and Norberg, P. 2004, MNRAS, 355, 1010.
- Porciani & Norberg (2006) Porciani, C. and Norberg, P. 2006, MNRAS, 371, 1824.
- Prochaska & Herbert-Fort (2004) Prochaska, J. X. and Herbert-Fort, S. 2004, PASP, 116, 622.
- Prochaska, Herbert-Fort & Wolfe (2005) Prochaska, J. X., Herbert-Fort, S., and Wolfe, A. M. 2005, ApJ, 635, 123.
- Reichard et al. (2003) Reichard, T. A. et al. 2003, AJ, 125, 1711.
- Richards et al. (2004) Richards, G. T. et al. 2004, ApJS, 155, 257.
- Richards et al. (2002) Richards, G. T. et al. 2002, AJ, 124, 1.
- Schaye (2001) Schaye, J. 2001, ApJ, 559, L1.
- Schirber, Miralda-Escudé & McDonald (2004) Schirber, M., Miralda-Escudé, J., and McDonald, P. 2004, ApJ, 610, 105.
- Scott et al. (2000) Scott, J. et al. 2000, ApJS, 130, 67.
- Serber et al. (2006) Serber, W. et al. 2006, ApJ, 643, 68.
- Shen et al. (2007) Shen, Y. et al. 2007, AJ, accepted.
- Smith, Boyle & Maddox (2000) Smith, R. J., Boyle, B. J., and Maddox, S. J. 2000, MNRAS, 313, 252.
- Storrie-Lombardi & Wolfe (2000) Storrie-Lombardi, L. J. and Wolfe, A. M. 2000, ApJ, 543, 552.
- Stoughton et al. (2002) Stoughton, C. et al. 2002, AJ, 123, 485.
- Tolea, Krolik & Tsvetanov (2002) Tolea, A., Krolik, J. H., and Tsvetanov, Z. 2002, ApJ, 578, L31.
- Trump et al. (2006) Trump, J. R. et al. 2006, ApJS, 165, 1.
- Tytler & Fan (1992) Tytler, D. and Fan, X.-M. 1992, ApJS, 79, 1.
- Vanden Berk et al. (2001) Vanden Berk, D. E. et al. 2001, AJ, 122, 549.
- Weymann et al. (1991) Weymann, R. J. et al. 1991, ApJ, 373, 23.
- Wolfe, Gawiser & Prochaska (2005) Wolfe, A. M., Gawiser, E., and Prochaska, J. X. 2005, ARA&A, 43, 861.
- Yee & Green (1984) Yee, H. K. C. and Green, R. F. 1984, ApJ, 280, 79.
- Yee & Green (1987) Yee, H. K. C. and Green, R. F. 1987, ApJ, 319, 28.