A New Detached K7 Dwarf Eclipsing Binary System
Abstract
We present an analysis of a new, detached, double-lined eclipsing binary system with K7 Ve components, discovered as part of the University of New South Wales Extrasolar Planet Search. The object is significant in that only 6 other binary systems are known with comparable or lower mass. Such systems offer important tests of mass–radius theoretical models. Follow-up photometry and spectroscopy were obtained with the 40-inch and 2.3m telescopes at SSO respectively. An estimate of the radial velocity amplitude from spectral absorption features, combined with the orbital inclination (83.5∘) estimated from lightcurve fitting, yielded a total mass of M M☉ and component masses of M M☉ and M M☉. The radial velocity amplitude estimated from absorption features (1673 km s-1) was found to be less than the estimate from the Hα emission lines (1751.5 km s-1). The lightcurve fit produced radii of R R☉ and R R☉, and a temperature ratio of T. The apparent magnitude of the binary was estimated to be . Combined with the spectral type, this gave the distance to the binary as pc. The timing of the secondary eclipse gave a lower limit on the eccentricity of the binary system of . This is the most statistically significant non-zero eccentricity found for such a system, possibly suggesting the presence of a third companion.
keywords:
binaries: spectroscopic – binaries: eclipsing – stars: low-mass – stars: late-type – stars: individual UNSW-TR-21 Introduction
Low-mass stars () make up more than 70% of the stellar population, but their intrinsic faintness means that relatively few have been studied in detail. In recent years, much work has been done on the theoretical modelling of such stars (see review by Chabrier & Baraffe 2000), but progress has been hindered by a lack of observed low-mass stars with sufficiently accurate parameters. In order to distinguish between the various models, uncertainties of less than 2–3% in the masses and radii are required (Ribas, 2005, 2003). This can most easily be achieved with detached, double-lined eclipsing binary stars, with best results coming from systems with similar components (Ribas, 2005). Currently, only six such systems with masses of 0.6 M☉ or below are known. A number of recent studies of these systems (López-Morales & Ribas, 2005; Torres & Ribas, 2002; Maceroni & Montalbán, 2004; Ribas, 2003) have revealed discrepancies between the observations and the latest theoretical models, which in particular appear to underestimate the radii by as much as 10–15%. This is possibly due to the enhanced magnetic activity produced by the high rotational velocities of stars in close binaries (Ribas, 2005). There is a clear need for more of these systems to be discovered and studied, so that the physics of low-mass stars may finally be understood.
In this paper we report the discovery and preliminary analysis of a new detached, double-lined eclipsing binary system with K7 Ve components. The system was detected in data obtained for the University of New South Wales (UNSW) Extrasolar Planet Search (Hidas et al., 2005). The eclipses are grazing, and their depth was diluted by light from a brighter, blended star. The resulting shallow eclipses led to this object’s selection as as a transiting planet candidate, its true nature only being revealed by follow-up observations.
2 Observations
2.1 Photometry
The data leading to the detection of UNSW-TR-2 ( = 18h 30′ 523, = ∘ 9′ 27′′) were obtained using the 0.5 m Automated Patrol Telescope (APT) at Siding Spring Observatory (SSO), NSW, Australia. The object was found in a field centred on the open cluster NGC 6633. During three seasons (2002–2004) we observed this field on 79 nights (about 3500 images). For most of the present analysis, we have used only the best quality data (highest cadence and lowest photometric noise), consisting of 997 images from 11 nights in July and August 2002. On these nights we observed through a Johnson filter at a cadence of about 16 per hour. The remaining data on this field have one quarter the cadence (we were observing three other fields in parallel) and are affected by significant systematic trends on many nights. For the period determination (sec. 3.1), we used the entire dataset. Lightcurves were extracted using a custom-built automated reduction pipeline. For more information about the telescope, the data and the reduction process, see Hidas et al. (2005).
Initial inspection of the lightcurve of UNSW-TR-2 revealed eclipses with a depth of 25 mmag, a duration of 2 hours, and a binary period of days. The out-of-eclipse magnitude is , but inspection of a Digitised Sky Survey (DSS)111The Digitised Sky Survey was produced at the Space Telescope Science Institute under U.S. Government grant NAG W-2166, based on photographic data obtained using the Oschin Schmidt and UK Schmidt telescopes. image revealed that the APT photometry aperture contains at least two blended stars of similar brightness. The APT has 9.4-arcsecond pixels, and in a crowded field such as this one (at galactic latitude +8∘), such blending is common. The photometry aperture is 3 pixels in radius.
In June 2004 we obtained images of UNSW-TR-2 at higher spatial resolution in and using the 40-inch telescope at SSO. The images were sampled by 06 pixels. We observed one complete eclipse (in ′′ seeing), with a depth of 0.14 mag. The eclipse has the same depth and shape (within the photometric errors) in the two colour bands, suggesting that the two stars are of similar temperature.
The binary system is in fact the second-brightest object in the APT photometry aperture. It is mag fainter than the brightest one, and separated from it by 10″. The Tycho-2 catalogue (Høg et al., 2000) gives a (Johnson) magnitude of for this bright neighbour. The combined apparent magnitude for the binary system is therefore .
| TR-2 | Neighbour | |
|---|---|---|
| 10.9 | 10.7 | |
| 10.2 | 10.2 | |
| 10.1 | 10.1 |
2.2 Spectroscopy
2.2.1 Spectra Obtained
Spectra were obtained using the Double-Beam Spectrograph (DBS) on the 2.3 m telescope at SSO. During our initial follow-up run in June 2004, we obtained two spectra of UNSW-TR-2 at the same epoch (Figure 1). These covered the range 5800–6600 Å with 60 km s-1 resolution (FWHM, as measured from the sky lines in the spectra).
Visual comparison of the flux-calibrated spectra with templates from the UVILIB spectral library (Pickles, 1998) suggested that both stars are of type K7 V. With additional spectra reaching further into the red, our estimate of the spectral type could be refined using the TiO absorption bands (e.g. Kenyon & Fernandez-Castro, 1987; Schild et al., 1992). One TiO band is present in our existing data, but the absorption is very weak.
All of the absorption lines have two components, the smaller of which has 60–80% of the depth of the larger component, pointing to two similar stars. Prominent Hα emission is also present, with the two components at a similar strength-ratio to the absorption-line pairs (Fig. 1).
The expected absolute magnitude of the two stars combined, based on their spectral type (K7 V), is (Cox, 2000). Combining this with our estimate of the system’s apparent magnitude (), and assuming 1 mag kpc-1 of extinction, puts the binary at a distance of pc. The template best matching the spectrum of the bright neighbouring star is that of a G8III giant, with . Assuming the same extinction gives a distance of pc. Therefore this neighbour is not physically associated with the binary system.

2.2.2 Radial Velocity Estimation
We fitted for the two stellar components simultaneously using VPFIT222http://www.ast.cam.ac.uk/rfc/vpfit.html. For both spectra, five absorption-line pairs with high signal-to-noise were individually fitted with blended Voigt profiles. When given the instrumental resolution, VPFIT fits for the central velocity, column density and Doppler broadening of each line and returns associated uncertainties based on the covariance matrix at the best-fit. Each absorption-line pair is surrounded in our spectra by weak absorption features, some of which are partially blended with the pair in question. To allow for this, we inserted extra absorption lines into VPFIT as appropriate, again allowing all line-parameters to vary. We found that in order to obtain reasonable fits it was also necessary to allow for the presence of a final weak subsidiary line internal to the main absorption-line pair. In all cases, this procedure produced a reasonable fit to the data ().
A small adaptation of VPFIT allows for the fitting of emission lines with blended Gaussian profiles. In this way we fitted the two Hα emission-line-pairs. No subsidiary lines were required to obtain a good fit.
Taking orbital phase into account, and assuming a circular orbit, the total velocity-amplitude is km s-1 when measured from the absorption features, and km s-1 when measured from the Hα emission lines, where is the orbital inclination of the system (subsequently determined by lightcurve fitting, as described in section 3.2). An apparent disagreement between velocities derived by these two methods has been noted in other systems (M. López-Morales, private communication). The absorption velocity is considered to be more reliable due to uncertainties as to the spatial distribution of the source of Hα emission relative to the photometric centre of each star. We therefore adopt the value of km s-1 for the velocity amplitude of our system. We were unable to improve upon this estimate using the two-dimensional cross-correlation software TODCOR (Mazeh & Zucker (1994)) with a variety of different template spectra. This is possibly due to the relatively low resolution of our spectra when compared to those of similar objects for which TODCOR has been successfully implemented (e.g. López-Morales & Ribas, 2005).
In March 2006 we obtained an additional spectrum with the same instrument and at the same resolution. This one was taken close to an eclipse, therefore the lines are completely blended and the separation of the absorption lines cannot be reliably measured. However, comparing the central wavelength of each blended line with the wavelengths of the separated components in the original spectra allows us to constrain the difference between the two masses. This was done for the five high-signal-to-noise absorption lines in both of the original spectra, leading to a constraint of .
3 Analysis
3.1 Period and Eccentricity
Phase-folding the entire APT lightcurve (with observed eclipses up to two years apart) allows a precise determination of the orbital period. The period giving the smallest scatter in the folded lightcurve is days.
The epoch of the primary eclipse minimum (t0) was determined from the 40-inch lightcurve. The secondary eclipse occurs at a phase of 0.50160.0003 (measured from the APT lightcurve), minutes later than expected for a perfectly circular orbit. Assuming that the major axis of the orbit lies in the plane of the sky gives a lower limit on the orbit’s eccentricity of . Zahn & Bouchet (1989) predict that a binary consisting of two 0.5 M☉ stars with a period of about 7 days and an initial eccentricity of 0.3 will have been circularised by tidal interactions to by an age of 106 years, and will have reached after 1010 years. However, the shorter period of our system should lead to increased circularisation and lower . Although our lower limit may be compatible with a simple, main sequence binary system, it suggests the possibility that our system either is very young, or more likely, has at least one other companion affecting the timing of the eclipses. This is the most significant evidence for non-zero eccentricity in a low-mass eclipsing binary system detected to date. However, we continue to assume for this work.
3.2 Lightcurve Fitting
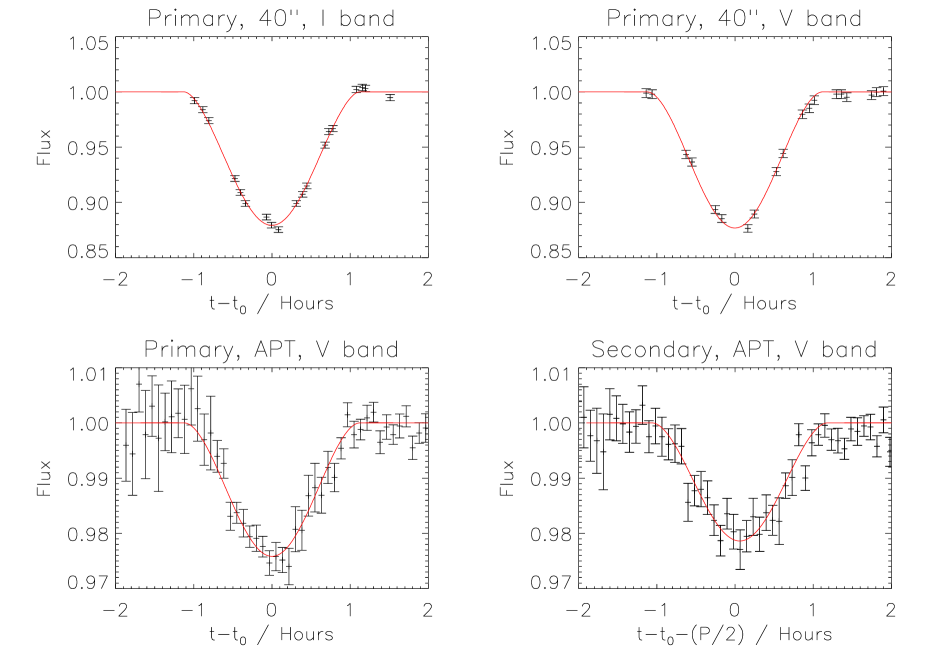
We fitted models (based on equations by Sackett (1999), modified to apply to binary stars) to the lightcurves using a chi-squared minimisation algorithm to estimate properties of the system. The APT lightcurve was folded and binned at 5-minute intervals. All the data (one high-resolution primary eclipse in each of -band and -band from the 40-inch, and both eclipses in from the APT) were fitted simultaneously. The accuracy of our results is limited by the lack of high-spatial-resolution observations of the secondary eclipse, and also by the presence of the nearby brighter star in the APT aperture. The epochs of the primary and secondary minima, the period, and the velocity amplitude were fixed at their previously measured values whilst allowing the orbital inclination (), the radii of both stars ( and ), and their temperature ratio () to vary. Also required is the fraction of the total flux in the APT aperture produced by our object, estimated as from the 40-inch images and allowed to vary within this error-range. Finally, we assume solar-metallicity limb-darkening coefficients of 0.9 and 0.7 in and respectively (Claret, 1998). The best-fit lightcurve is shown in Figure 2, and the parameters are summarised in Table 2.
3.3 Error Estimation
To estimate the uncertainties in our lightcurve fit we plotted vs. reduced-chi-squared contour plots for ranges of , and either-side of the best-fit parameters (Fig. 3). The contours on each vs. plot are ellipses, tightly constraining the sum of the radii but not their difference. Altering the other parameters from their best-fit values decreases the size of the contours whilst moving their centre. Increasing leads to a higher but lower , whilst increasing has the opposite effect: lower and higher . We found that the flux ratio is constrained relatively tightly and therefore contributes little to the uncertainties of the other parameters. Having scaled the errors such that the best-fit reduced-chi-squared has a value of one, the errors for the remaining four parameters were estimated by the range of the appropriate chi-squared contour over the full 4-dimensional error ellipsoid. Further (minor) contributions to these errors come from the uncertainties in the velocity amplitude and limb-darkening coefficients. Because the estimates of the two radii are not independent, we also used the contour plots to derive an estimate of .


| Period (days) | 2.11674 | 0.00002 |
| t0 (HJD) | 2453171.0371 | 0.0005 |
| Separation (AU) | 0.0327 | 0.0007 |
| Inclination (degrees) | 83.49 | 0.2 |
| Mtotal (M☉) | 1.041 | 0.06 |
| MA (M☉) | 0.529 | 0.035 |
| MB (M☉) | 0.512 | 0.035 |
| M (M☉) | 0.017 | 0.03 |
| RA (R☉) | 0.641 | 0.05 |
| RB (R☉) | 0.608 | 0.06 |
| R (R☉) | 0.033 | 0.06 |
| TB/TA | 0.980 | 0.015 |
4 Results and Discussion
The parameters we have derived for UNSW-TR-2 from both the lightcurve fitting and spectral analysis are shown in Table 2. The derived masses are consistent with our earlier estimate (based on spectral shape) of two K7 V stars. The star estimated to have a higher mass, radius and temperature corresponds to the component identified in section 2.2.1 as having stronger absorption and emission features.
In Figure 4 we plot the masses and radii of all the known components of detached, double-line eclipsing binaries with masses below 0.8 M☉, including UNSW-TR-2. We also plot a theoretical main-sequence isochrone derived by Baraffe et al. (1998). As noted by Ribas (2005) and references therein, stars with masses greater than 0.3 M☉ seem to fall systematically above the theoretical line, with their radii being underestimated by 10%. The two stars in UNSW-TR-2 appear to agree with this trend, although a more precise determination of their masses and radii is clearly required.
It is likely that one or both of our stars lies in the previously unpopulated region between 0.5 and 0.6 M☉, which increases their importance in constraining the mass-radius relation of low-mass stars. The apparent magnitude of our system () is similar to that of the 0.6 M☉ eclipsing binary GU Bootis (), for which López-Morales & Ribas (2005) derived the masses and radii to within the 2–3% accuracy required for a detailed comparison with theory. With echelle spectroscopy and further photometry, the properties of UNSW-TR-2 could therefore be similarly constrained.
4.1 UNSW-TR-2 as a target for a planet search
Eclipsing binary systems with dwarf components are interesting targets for photometric planet searches. One main advantage is that the orbits of planets in such a system are likely to be near-coplanar with the binary, making transits more likely. Additionally, non-transiting planets may also be detected via the variations they induce in the timing of the binary eclipse minima (e.g. Doyle & Deeg, 2004). These motivated an extensive search around the M-dwarf binary CM Dra (Doyle et al., 2000).
In the case of UNSW-TR-2, transits of a Jupiter-sized planet in front of one of the stars (when they are not eclipsing) would be 1.3% deep. A planet in a co-planar orbit about the binary (∘) would have to be within AU of the centre of mass to transit. This is only 2.5 times the binary’s semi-major axis, but according to simulations by Holman & Wiegert (1999), even such a small orbit may be stable around an equal-mass binary with a circular orbit. Planets with more favourable orbital inclinations (relative to the line of sight) may also transit. For example, ∘ gives AU, and ∘ gives AU.
The approximate range of eclipse-timing variations is , where is the planet-to-binary mass ratio, is the planet’s orbital radius, and is the speed of light (Doyle & Deeg, 2004). For a Jupiter-mass planet () in a 1 AU orbit, this gives sec. The detection of planets via this method would therefore require second-precision timing of eclipses over timescales of years.
5 Conclusions
We present a preliminary analysis of a new double-lined eclipsing binary system with K7 Ve components. The system was discovered as part of an ongoing transit search for extra-solar planets. The system is important in that it is only the seventh low-mass binary known, and because it allows precise determinations of the masses and radii of these low-mass stars. Using the initial photometric data, and follow-up photometry and spectroscopy, we derive the physical parameters of the system. Our results are consistent with previous work, confirming a departure in the mass-radius plane from the theoretical models of Baraffe et al. (1998). Enhanced magnetic activity — due to the high rotational velocities of stars in close binaries — may be responsible for this discrepancy (Ribas, 2005).
We find statistically significant evidence — in fact the most significant in any known low-mass eclipsing binary system — for a small but non-zero eccentricity in this new binary system, suggesting the possibility of an additional companion.
Acknowledgments
The authors wish to thank A. Phillips for continuous maintenance and upgrade work on the APT, H. Toyozumi and C. Blake for help with the follow-up observations, and M. Irwin for assistance with developing the APT data reduction pipeline. We are also grateful for valuable comments from M. López-Morales, B. Carter, C. Maceroni, T. Marsh and P. Maxted, and for telescope time from the Mount Stromlo and Siding Spring Observatories TAC. JLC is supported by an Australian Postgraduate Research Award. We thank Sun Microsystems for their generous donation of a workstation.
References
- Baraffe et al. (1998) Baraffe I., Chabrier G., Allard F., Hauschildt P. H., 1998, A&A, 337, 403
- Chabrier & Baraffe (2000) Chabrier G., Baraffe I., 2000, ARA&A, 38, 337
- Claret (1998) Claret A., 1998, VizieR Online Data Catalog, 333, 50647
- Cox (2000) Cox A. N., ed. 2000, Allen’s Astrophysical Quantities, fourth edn. Springer, New York
- Doyle & Deeg (2004) Doyle L. R., Deeg H., 2004, in Norris R., Stootman F., eds, Bioastronomy 2002: Life Among the Stars, IAU Symposium 213 p. 80
- Doyle et al. (2000) Doyle L. R., Deeg H. J., et al. 2000, ApJ, 535, 338
- Hidas et al. (2005) Hidas M. G., Ashley M. C. B., Webb J. K., Irwin M., Phillips A., Toyozumi H., Derekas A., Christiansen J. L., Nutto C., Crothers S., 2005, MNRAS, 360, 703
- Høg et al. (2000) Høg E., Fabricius C., Makarov V. V., Urban S., Corbin T., Wycoff G., Bastian U., Schwekendiek P., Wicenec A., 2000, A&A, 355, L27
- Holman & Wiegert (1999) Holman M. J., Wiegert P. A., 1999, AJ, 117, 621
- Kenyon & Fernandez-Castro (1987) Kenyon S. J., Fernandez-Castro T., 1987, AJ, 93, 938
- López-Morales & Ribas (2005) López-Morales M., Ribas I., 2005, ApJ, 631, 1120
- Maceroni & Montalbán (2004) Maceroni C., Montalbán J., 2004, A&A, 426, 577
- Mazeh & Zucker (1994) Mazeh T., Zucker S., 1994, Astrophysics and Space Science, 212, 349
- Pickles (1998) Pickles A. J., 1998, PASP, 110, 863
- Ribas (2003) Ribas I., 2003, A&A, 398, 239
- Ribas (2005) Ribas I., 2005, astro-ph/0511431
- Sackett (1999) Sackett P. D., 1999, in Mariotti J.-M., Alloin D., eds, NATO ASIC Proc. 532: Planets Outside the Solar System: Theory and Observations Searching for Unseen Planets via Occultation and Microlensing. pp 189–+
- Schild et al. (1992) Schild H., Boyle S. J., Schmid H. M., 1992, MNRAS, 258, 95
- Torres & Ribas (2002) Torres G., Ribas I., 2002, ApJ, 567, 1140
- Zahn & Bouchet (1989) Zahn J.-P., Bouchet L., 1989, A&A, 223, 112