Early afterglow detection in the Swift observations of GRB 050801
Abstract
We present results of Swift optical, UV and X-ray observations of the afterglow of GRB 050801. The source is visible over the full optical, UV and X-ray energy range of the Swift UVOT and XRT instruments. Both optical and X-ray lightcurves exhibit a broad plateau () during the first few hundred seconds after the -ray event. We investigate the multiwavelength spectral and timing properties of the afterglow, and we suggest that the behaviour at early times is compatible with an energy injection by a newly born magnetar with a period of a few tenths of a millisecond, which keeps the forward shock refreshed over this short interval by irradiation. Reverse shock emission is not observed. Its suppression might be due to GRB ejecta being permeated by high magnetic fields, as expected for outflows powered by a magnetar. Finally, the multiwavelength study allows a determination of the burst redshift, .
keywords:
Gamma-Ray Bursts.1 Introduction
The Swift mission represents a major breakthrough for the study of
Gamma-Ray Bursts (GRBs). New bursts are detected by the Burst Alert
Telescope (BAT, Barthelmy et al. 2005), a coded-mask imager with higher
sensitivity than that of the BATSE instrument onboard the Compton
Gamma-Ray Observatory. Swift can begin observing a GRB with the
X-ray telescope (XRT, Burrows et al. 2005) and Ultraviolet and Optical
Telescope (UVOT, Roming et al. 2005) within minute of the GRB
onset, because of Swift’s unprecedented capability of fast and
autonomous repointing. Swift has therefore enabled us to routinely
explore these sources from the end of the prompt emission and the
beginning of the afterglow, an epoch which was poorly known
before this mission. The observations with the XRT and UVOT
telescopes are addressing a series of key issues in GRB studies,
such as the link between the -ray and the afterglow
emission, the mechanisms which produce them, the duration and the
properties of the “central engine”, and the origin of the prompt
optical emission.
In this paper, we focus on GRB 050801. Among the bursts observed by
Swift, this GRB was the first to have an early afterglow
characterized by a peculiar phase of steady flux, both in the X-ray
and in the Optical/UV, lasting a few hundred seconds. We will show
that this distinguishing behaviour might be explained if we assume
that the burst ejecta receive an injection of energy from a
magnetar, born in the event that caused the GRB, with an initial
period of a fraction of milliseconds.
GRB 050801could thus be another example, in addition to
GRB 051221 (Fan & Xu 2006), of a GRB with a magnetar as central
engine.
2 Prompt emission
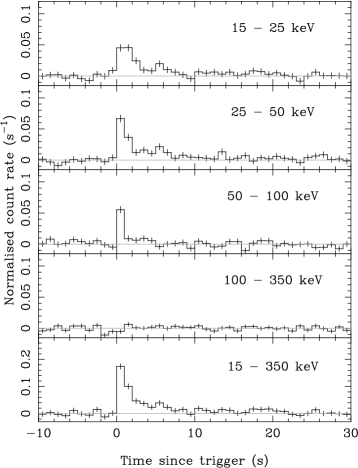
This burst was detected by the Swift satellite on August 1, 2005 at 18:28:16 UT. The -ray lightcurve registered by BAT (15-350 keV) shows two peaks, with a duration t s (see Fig. 1). Henceforth errors are at the 68% confidence level, unless otherwise stated. The spectral analysis was performed only in the 15-150 keV band, because this is the band in which BAT has the optimal sensitivity. We tried the Band, cut-off powerlaw and simple powerlaw models to fit the data. None of them gave a fit significantly better than the others. However, the parameters in the first two are poorly constrained. We have therefore adopted the results of the simple powerlaw model fit, which gives a spectral index with a reduced chi-squared of with 73 d.o.f.. The total fluence in the 15-150 keV band is erg cm-2, which allows us to classify this burst as moderately faint. Interestingly, the second peak is softer than the first one, being visible only at energies lower than keV. In the following, we present the X-ray, optical and UV observations performed with Swift and we discuss the multiwavelength properties of the GRB 050801’s afterglow.
3 Swift X-ray and optical observations of GRB 050801
Following the BAT trigger, GRB 050801 was observed by the XRT and UVOT instruments. A bright, unknown X-ray and optical source was found inside the BAT error circle, at coordinates RA=13:36:35.4, Dec=-21:55:42.3 (as measured with UVOT). This source subsequently faded, and it was therefore confirmed as the afterglow of this burst. Other prompt optical observations were successfully performed with ROTSE (Rykoff et al. 2006), and further observations were made by Fynbo et al. (2005a, b), 6 hours and 30 hours after the burst onset respectively. No radio afterglow was detected (Cameron et al. 2005).
The UVOT began observing the field of GRB 050801 52s after the BAT trigger. The first 9.4s exposure, taken while the spacecraft was settling on the target, was taken through the V filter in photon-counting (“event”) mode. Once the pointing had stabilised, a 100s V-band finding-chart exposure in combined image and event mode was taken. After this, the UVOT cycled through the colour filters, firstly with 10s exposures, then 100s and finally 900s. The later exposures were taken in Image Mode (IM) only.
A series of images were created from the settling and finding chart event lists. A single image was produced from the settling exposure, and the 100s finding-chart event list was used to produce 11 time-sliced images. The first 2 of these images have 5s exposure times, and the next 9 images are of 10s duration. Counts were extracted from the images in all filters using a 4″ radius aperture at the position of the afterglow. A 25″ radius region, offset from the source, was used to determine the background count rates. The source count rates were aperture-corrected to a 6″ radius to ensure compatibility with the photometry calibration (Poole 2005), and were corrected for detector dead-time and coincidence loss (i.e. lost counts due to multiple photons arriving in a single region of the detector within a single frame). The count rates were converted to magnitudes and fluxes using, respectively, the zero-points and counts-to-flux conversions available in the Swift CALDB. The complete log of UVOT observations is shown in Table 1.
Observations using the XRT began approximately 61s after the burst trigger. The first exposure, taken in the Image Mode (IM), did not show any source. Subsequently, the XRT observed in Windowed Timing (WT) mode for approximately 20s. This observational mode did not accumulate enough counts to produce any useful spectral information. The lightcurve was obtained from WT event data using Xselect with 53 arcsecond wide extraction slices for the source and background.
The rest of the XRT data were obtained in Photon Counting (PC) mode. The initial PC exposure lasted approximately 880s and was found to be piled up. Comparison of the observed point spread function of the source to the model XRT point spread function indicated that significant pile up is restricted to the inner 7″radius region. Therefore source spectra and lightcurves were extracted from an annulus with an inner radius of 7″and an outer radius of 71″. Later data did not suffer from pile up and the extraction region was a circle of radius 70.7″. The background extraction region was taken as a circle of radius 189″for both the piled up and the non-piled up data. An additional fainter source was found within the extraction region and this was excluded for both the source and the piled up extraction regions with a radius of 2.5″radius. For the PC mode data we included events of grade 0-12, in which the charge is spread over pixels on the detector. The total exposure integration time in PC mode was s. For the first day of observations a hot column in the XRT was close to the centre of the source, while at later times Swift was repointed to move the source away from this artefact. For spectral analysis we used the response matrix from the latest Swift calibration database, CALDB 20051201, and the tasks xrtexpomap and xrtmkarf were used to produce effective area files, corrected for the hot column. The pileup correction factor was also taken from the arf files. This correction factor was dependant upon the distance of the burst centre to the hot pixel columns.
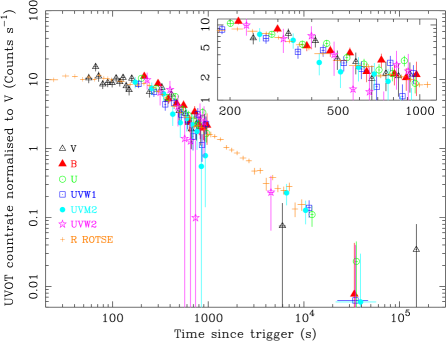
Figure 2 shows the X-ray lightcurve of GRB 050801 in the 0.2-10 keV energy band. The optical/UV lightcurve is shown in Fig. 3; the optical emission of GRB 050801 does not decline in the first s, after which it begins a systematic decay. This behaviour is very similar for the lightcurves in all filters, indicating no variation in the optical spectrum. We fitted the whole dataset of optical/UV datapoints, which have been normalized to the V band (Fig. 3), with a broken powerlaw. In the following we use the convention , where , and are the flux, the time since the BAT trigger and the photon energy respectively. The best fit values of the parameters are: an initial decay slope , a break time t s and a late decay slope . The X-ray flux also lacks a strong decline () in the first s, but decays after this with a rate similar to that of the optical lightcurve. By fitting this lightcurve with a broken powerlaw, we obtain an initial decay slope , a break time t s, and a late decay slope of : all these values are consistent with those obtained by fitting the optical lightcurve, within 2. In fact, we find that the optical-to-X-ray flux ratio remains remarkably constant throughout the whole observation (see Figure 4). In order to formally assess that, we deconvolved the intrinsic distribution of our data from the distribution of measurement errors. We followed the maximum likelihood method of Maccacaro et al. (1988) to obtain the best estimate of the intrinsic standard deviation of the optical-to-X ray flux ratio. We got , which is consistent, within 1.5 standard deviation, with 0. The upper limit on intrinsic standard deviation is 0.06.
We also note that the level of the optical flux found by ROTSE 22s after the trigger (Rykoff et al. 2006) is consistent with the plateau we find 70-230s after the trigger, indicating that the optical flux was roughly constant for s after the end of the prompt emission.
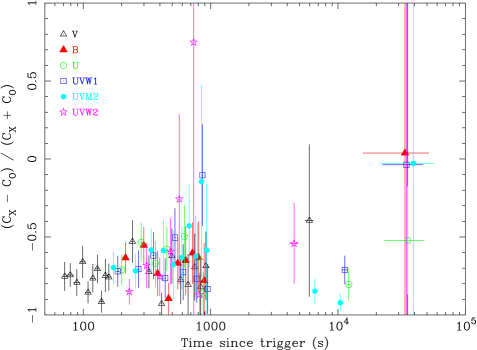
The 0.2-10 keV spectrum obtained with XRT is well fitted with an absorbed powerlaw model; results are listed in Table 2 and Fig. 5. There is no evidence for spectral evolution during the whole of the follow-up observation. This is confirmed by the fact that there is no change in the softness ratio, as shown in Fig. 6. By means of the maximum likelihood method of Maccacaro, we found that the best estimate of the intrinsic dispersion of softness ratio is , which is consistent with 0 at level.
The similar behaviour of the X-ray and optical lightcurves, as well as the absence of any change in the spectral properties, suggests that these two bands both lie in the same spectral segment. In order to test this hypothesis, and to understand the spectral properties of the burst in more detail, we reconstructed the Spectral Energy Distribution (SED) between these bands, spanning 4 decades in frequency.
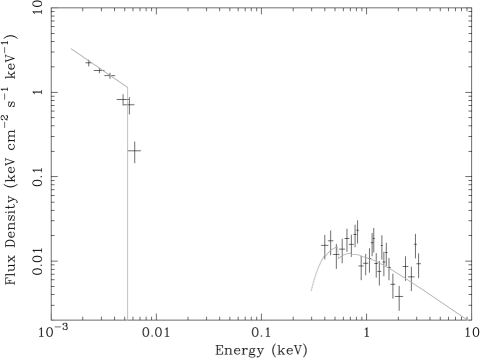
We performed a joint spectral fit of optical and X-ray data taken between 160 s and 970 s after the burst (i.e. where both X-ray and optical flux were highest). We fitted the spectra with a powerlaw model, which is widely assumed to be the spectral shape of GRB emission, and we have included the effects of photoelectric absorption using the phabs and zphabs models in XSPEC. In our fit, phabs is fixed at the Galactic value N cm-2 (Dickey & Lockman 1990), while zphabs is allowed to vary. The optical/UV datapoints were corrected for the Galactic dust extinction before reading into XSPEC, by using the Galactic extinction law reported in Seaton (1979). Such a multicomponent model gives a rough reproduction of the whole spectrum, with (see Fig. 7). The best fit value of the optical to X-ray spectral index is , which is consistent with the spectral slope in the X-ray band, supporting a scenario in which the X-ray and optical data lie on the same spectral segment.
Joint analysis of the optical and X-ray data has also allowed us to derive a photometric redshift for the burst; no spectroscopic redshift is available. Extragalactic hydrogen will cause a dropout in the emission blueward of nm, which can be detected by Swift UVOT if . In the case of GRB050801, there is a dramatic difference in flux between the UVM2 and UVW2 filters, (see figure 7), and from the fit described above, we formally obtain . We should, however, note that the spectral model we used includes the sharp cut-off at the Ly-limit, nm, but does not include the Ly- forest, or Ly- absorption from the host galaxy of the GRB. Together, these two sources of Ly- absorption will erode the spectrum between and nm, suggesting that the true redshift might be slightly below the value we determined and increasing the uncertainty on the redshift beyond the statistical errors on the model fit. At redshift , Ly- from intervening systems is expected to absorb less than 10 per cent of the broadband flux (Madau 2005), and will only influence the photometry in the UV filters of the UVOT. As this attenuation is smaller than the statistical uncertainty on the UV datapoints (15, 23 and 28 per cent for UVW1, UVM2 and UVW2 respectively), we consider a more realistic uncertainty for the redshift to be 0.10.
Despite these caveats, our photometric redshift should be close enough to the actual value to permit an adequate estimation of the energy emitted by GRB 050801 during its prompt emission phase. In calculating this energy we have taken the K-correction into account using the method of Bloom et al. (2001), extrapolating the flux to energies below the BAT threshold. Assuming that the energy index does not change for keV, we find the energy released over the 15-150 keV band (and in the GRB restframe) to be erg. This value puts GRB 050801 in the low energy tail of the GRB prompt energy distribution (O’Brien et al. 2006, Nousek et al. 2006). Assuming that the spectrum of the -ray emission does not change at higher energies, we calculate the total isotropic equivalent energy of this burst in the keV band to be erg.
| Filter | Tmid | Trange | Texp | Mag |
|---|---|---|---|---|
| V | 57 | 5261 | 9.4 | 14.91 0.07 |
| V | 67 | 6469 | 5.0 | 14.5 0.1 |
| V | 72 | 6974 | 5.0 | 14.8 0.1 |
| V | 79 | 7484 | 10.0 | 15.13 0.09 |
| V | 89 | 8494 | 10.0 | 15.07 0.08 |
| V | 99 | 94104 | 10.0 | 15.08 0.09 |
| V | 109 | 104114 | 10.0 | 14.91 0.08 |
| V | 119 | 114124 | 10.0 | 15.05 0.09 |
| V | 129 | 124134 | 10.0 | 14.89 0.08 |
| V | 139 | 134144 | 10.0 | 15.19 0.09 |
| V | 149 | 144154 | 10.0 | 15.34 0.09 |
| V | 159 | 154164 | 9.8 | 14.92 0.08 |
| V | 244 | 239248 | 9.8 | 15.4 0.1 |
| V | 328 | 323333 | 9.8 | 15.25 0.09 |
| V | 412 | 408417 | 9.8 | 15.5 0.1 |
| V | 497 | 492502 | 9.8 | 16.1 0.1 |
| V | 581 | 576586 | 9.8 | 16.2 0.1 |
| V | 666 | 661671 | 9.8 | 16.8 0.1 |
| V | 750 | 745755 | 9.8 | 16.6 0.1 |
| V | 835 | 830840 | 9.8 | 16.7 0.1 |
| V | 919 | 914924 | 9.8 | 16.6 0.1 |
| V | 5965 | 55156415 | 899.8 | |
| V | 35314 | 1758353044 | 2697.6 | |
| V | 149467 | 108434190500 | 4211.8 | |
| B | 215 | 210220 | 9.8 | 15.32 0.06 |
| B | 299 | 294304 | 9.8 | 15.57 0.06 |
| B | 383 | 379388 | 9.8 | 16.13 0.08 |
| B | 468 | 463473 | 9.8 | 16.29 0.08 |
| B | 553 | 548557 | 9.8 | 16.37 0.08 |
| B | 637 | 632642 | 9.8 | 16.99 0.09 |
| B | 721 | 717726 | 9.7 | 16.60 0.08 |
| B | 806 | 801811 | 9.8 | 17.06 0.09 |
| B | 890 | 885895 | 9.8 | 17.19 0.09 |
| B | 972 | 970973 | 3.3 | 17.1 0.2 |
| B | 33617 | 1576751466 | 3599.1 | |
| U | 201 | 196205 | 9.8 | 14.35 0.06 |
| U | 285 | 280290 | 9.8 | 14.71 0.07 |
| U | 369 | 365374 | 9.7 | 15.04 0.08 |
| U | 454 | 449459 | 9.8 | 15.02 0.08 |
| U | 538 | 533543 | 9.8 | 15.5 0.1 |
| U | 623 | 618628 | 9.8 | 15.7 0.1 |
| U | 707 | 702712 | 9.8 | 15.9 0.1 |
| U | 792 | 787797 | 9.8 | 16.0 0.1 |
| U | 876 | 871881 | 9.8 | 15.6 0.1 |
| U | 961 | 956965 | 9.8 | 16.3 0.1 |
| U | 12159 | 1177312545 | 771.3 | 19.30 0.02 |
| U | 35301 | 2334247259 | 2114.0 | 20.99 0.01 |
| Filter | Tmid | Trange | Texp | Mag |
|---|---|---|---|---|
| UVW1 | 187 | 182192 | 9.8 | 14.7 0.1 |
| UVW1 | 271 | 267276 | 9.8 | 15.0 0.1 |
| UVW1 | 356 | 351361 | 9.8 | 15.4 0.2 |
| UVW1 | 440 | 435445 | 9.8 | 15.4 0.2 |
| UVW1 | 525 | 520530 | 9.8 | 15.8 0.2 |
| UVW1 | 609 | 604614 | 9.8 | 16.0 0.2 |
| UVW1 | 694 | 689698 | 9.8 | 16.6 0.2 |
| UVW1 | 778 | 773783 | 9.8 | 15.8 0.2 |
| UVW1 | 862 | 858867 | 9.8 | 16.9 0.3 |
| UVW1 | 947 | 942952 | 9.8 | 16.14 0.2 |
| UVW1 | 11316 | 1086611766 | 899.8 | 19.18 0.04 |
| UVW1 | 34511 | 2243546587 | 2699.3 | |
| UVM2 | 173 | 168178 | 9.8 | 14.7 0.2 |
| UVM2 | 257 | 252262 | 9.8 | 14.9 0.2 |
| UVM2 | 342 | 337346 | 9.8 | 15.1 0.2 |
| UVM2 | 426 | 421431 | 9.8 | 15.9 0.3 |
| UVM2 | 511 | 506515 | 9.8 | 16.2 0.3 |
| UVM2 | 595 | 590600 | 9.8 | 16.0 0.3 |
| UVM2 | 679 | 674684 | 9.8 | 16.3 0.3 |
| UVM2 | 764 | 759769 | 9.8 | 16.5 0.4 |
| UVM2 | 848 | 843853 | 9.8 | 17.8 0.5 |
| UVM2 | 933 | 928938 | 9.8 | 17.4 0.5 |
| UVM2 | 6590 | 64226759 | 337.1 | 18.7 0.1 |
| UVM2 | 10415 | 996610864 | 897.3 | 19.4 0.07 |
| UVM2 | 39067 | 2152756607 | 2910.5 | |
| UVW2 | 230 | 225235 | 9.8 | 16.1 0.2 |
| UVW2 | 314 | 309319 | 9.8 | 16.6 0.3 |
| UVW2 | 399 | 394404 | 9.8 | 16.5 0.3 |
| UVW2 | 483 | 478488 | 9.8 | 17.1 0.3 |
| UVW2 | 568 | 563573 | 9.8 | 18.2 0.4 |
| UVW2 | 652 | 647657 | 9.8 | 18.3 0.5 |
| UVW2 | 737 | 732741 | 9.8 | 17.9 |
| UVW2 | 821 | 816826 | 9.8 | 17.4 0.4 |
| UVW2 | 906 | 901910 | 9.8 | 17.6 0.4 |
| UVW2 | 4524 | 41884859 | 670.6 | 20.2 0.05 |
| UVW2 | 34525 | 1667652374 | 3599.1 | 21.6 |
| Segment | Energy index | Ncm-2 | time interval (s) |
|---|---|---|---|
| Plateau (piled up data) | - | 90-300 | |
| Whole piled up PC data | 90-975 | ||
| Non-Piled up PC data | 4097-52950 |
.
4 Discussion
4.1 Onset of the afterglow
4.1.1 Constraints on the energy injection mechanism.
The main peculiarity of the afterglow of GRB 050801 is the broad plateau observed at all wavelengths from optical to X-ray during the early phase. As we can see from Figure 2, the X-ray emission is practically constant for s, with a ratio between duration and time which is nearly 1. There is no evidence for sharp decays or X-ray flares such as those observed in several Swift GRBs (Burrows et al. 2005, Nousek et al. 2006), which are usually associated with “internal shocks” between the ultra-relativistic shells emitted by the central engine.
Among the various scenarios that can explain the observed plateau there are models in which the energy distribution over the fireball surface is non-uniform; these include the “patchy jet” models (Kumar & Piran 2000) and the “two component” jet models (Zhang et al. 2004). In the first case, the assumption is that the burst emission is released in a jet with large fluctuations in angular direction, i.e. with a patchy distribution of Lorentz factor . Emission from different patches becomes observable at different times, according to their diverse values of , and this can produce features which are observed in all bands almost simultaneously (as in GRB 050801). It should however be noted that the presence of large fluctuations of energy across the ejecta is still speculative, and that in order to give rise to early ( s) bumps, a distribution over a very narrow angular scale () is required. Moreover, theoretical predictions show that in this scenario the “bump” should follow a broad peak (see Zhang et al. 2006a). There is no indication of this in the available data.
The “two component jet” model assumes the existence of two components in the ejecta: one ultra-relativistic component powering the GRB, and a second –moderately relativistic– cocoon component. The cocoon is decelerated later than the ultra-relativistic component because of its lower Lorentz factor (see Zhang & Mészáros 2004, Mészáros & Rees 2001, Ramirez-Ruiz et al. 2002). Its afterglow emission would therefore start later and may give rise to a “bump” in the afterglow lightcurve. However, in accordance with the theoretical models mentioned above, such a feature should only be visible later than s (Zhang et al. 2006a).
The possibility we favour is that the plateau seen in both the X-ray and optical flux corresponds to the early afterglow, i.e. to the phase that follows the creation of an “external shock” after the fireball runs into the circumburst medium. The standard afterglow model predicts that, as a shell of ejecta interacts with the circumburst medium, it gives rise to a “forward shock”, which propagates outward. In its simplest formulation, the model predicts the production of a broad and achromatic flare, rather than a plateau, both in the optical and X-ray bands. The non-decay of the afterglow emission of GRB 050801 before 250s after the trigger might then be explained by assuming that the central engine continues to inject radiative energy into the fireball for a few hundreds or even thousands of seconds after the initial explosion (late “central engine” activity, Zhang & Mészáros 2002). As the emission from the central engine stops, the afterglow decay rate steepens up to more typical values. Assuming that the luminosity of the central engine scales as , the predicted relation between the decay and spectral slope is (Zhang & Mészáros 2002):
| (1) |
provided that the energy band we are dealing with is between the synchrotron peak frequency and the cooling frequency .111Note that the signs of the indices have been reversed with respect to the original paper by Zhang & Mészáros (2002), in order to make them consistent with our convention (here both and are positive). As we will show later, this is indeed the case for both the optical and the X-ray observed frequencies. As for the decay index, we used the weighted average of and , which is . For the spectral slope, we used . From this choice we obtained .
This value of is consistent with 0 within 3 , and
interestingly such a flat luminosity distribution is expected in
models in which the gamma ray burst leads to the birth of a
millisecond pulsar with an ultra-strong magnetic field, i.e. a
so-called “magnetar” (see e.g. Zhang & Meszaros 2001, Dai & Lu
1998). If this is the case, several parameters of the newly-born
compact object can be determined. We will discuss this intriguing
scenario in more detail in § 4.1.2.
An observationally
indistinguishable possibility is that the central engine activity is
as brief as the prompt emission itself but, at the end of the prompt
phase, the ejecta are released with different Lorentz factors (see
Rees & Meszaros 1998, Sari & Meszaros 2000, Panaitescu et al. 2005). The
slowest shells would catch up with the fastest ones, once the latter
have been decelerated by interaction with the circumburst medium.
The additional energy produced when the shells shock with each other
would make the afterglow decay shallower than usual. In this case,
assuming that the mass of the ejecta follows the law , where is the shell’s Lorentz
factor, one can find an effective value that mimics the effects
of continuous energy injection with the luminosity law . Following Zhang et al. (2006a), this is:
| (2) |
and therefore the value inferred above is equivalent to , i.e. a very steep distribution. A steep distribution in the shells’ Lorentz factors is required in order to have significant energy injection into the blast wave, with more energy carried by slow shells. Furthermore, the shell injection must occur over a suitably extended time interval in order to produce a flat plateau instead of a flare.
As mentioned previously, both these interpretations hold if the band where observations are taken is positioned between and . This can be inferred by means of the “closure relationships”, which link the value of the spectral index in a given band with the decay index of the flux in the same band, according to the standard afterglow scenario (for a review, see Zhang & Mészáros 2004). These relationships are different depending upon the the frequency range of the observed band, the density profile of the circumburst medium (constant as in the interstellar medium, or radially decreasing outwards from the centre of the explosion as expected in the case of a wind from a massive GRB progenitor), and on whether the ejecta expand spherically or in the form of a jet.
After the end of the plateau phase, in which (according to our interpretation) the behaviour of the afterglow is altered by late-time energy injection, one of these relationships should be satisfied if we assume that the afterglow behaves as theoretically predicted. In the case of the optical and X-ray afterglow of GRB 050801, we find that the only closure relationship which is satisfied is –which corresponds to the case of a spherical expansion of the ejecta into a constant density medium– and observing frequency satisfying . This also allows us to obtain a value for , the power-law index of the energy distribution of the radiating electrons. On theoretical grounds, and for this spectral segment, it is which gives .
4.1.2 Birth of a Magnetar?
According to Zhang & Meszaros (2001), when the core of the stellar progenitor collapses into a pulsar, the luminosity emitted in the form of Poynting flux, , is given by
| (3) |
where we use the convention . In the above expression, , , , and are, respectively, the neutron star’s moment of inertia, initial angular velocity, initial period, radius and initial magnetic field. The quantity represents the time scale over which the emitted luminosity is roughly constant at the level ; following again the same authors, it is given by
| (4) |
After the time , the model predicts a sharp cut off of luminosity , which decreases as , i.e. . From Zhang & Meszaros 2002, the afterglow dynamics can be affected only if . Therefore, after the , we have no further modification of afterglow lightcurve due to energy injection.
By multiplying Eq. 3 with 4, we can estimate the amount of energy that is produced by the newly-born neutron star and subsequently injected into the ejecta via dipolar spin-down. We get
| (5) |
Our data also allow us to estimate the change in kinetic energy, , during the “plateau” phase. In the case where the observing frequency is between the peak frequency and the cooling frequency, the kinetic energy released as a function of the time is given by (Zhang et al., 2006b)
where F(Hz) is the flux density at Hz, is the luminosity distance, the time in the observer’s frame, is a function of the index of the powerlaw energy distribution of radiating electrons, is the fraction of the energy that is contained in magnetic fields, is the fraction of the energy associated with radiating electrons, is the particle density in the surrounding medium and is the frequency at which we are observing. Again, subindices indicate normalized quantities (), while is in units of days.
For a GRB at z=1.56, assuming the cosmological parameters , and , we find cm. For the following parameters we take fiducial values of (Freedman & Waxmann 2001), , (Berger et al. 2003), Hz, and (the function is plotted in Zhang et al. 2006b). Inserting the time duration of the plateau [ s d] into Eq. 4.1.2, and using the keV flux, erg cm-2s-1, we can infer the increase in kinetic energy during this phase. This gives erg. Finally, under the simple assumption that all the electromagnetic energy emitted by the pulsar has been completely converted into the kinetic energy of the ejecta (we discuss more realistic scenarios below), we have and Eq. 5 gives the neutron star period, s.
We can now use the value of the spin period to estimate the emitted
luminosity and the pulsar’s magnetic field strength. In the cosmological rest
frame of the GRB, the plateau duration is s, which gives a good approximation for the
quantity . From Eq. 5 we therefore obtain a
luminosity erg sec-1 and, from
Eq. 3, a stellar magnetic field of G (using a neutron star radius of 10 km). This
value is in the range expected for ultramagnetized neutron stars
(“magnetars”).
The existence of a plateau in the lightcurve also requires the pulsar to have a significant effect on the energetics of the afterglow. This means that the energy injected by the pulsar before the beginning of the afterglow, which we set at a certain time , must be a sizeable fraction of the total kinetic energy that is left for the ejecta after the prompt emission phase, :
| (7) |
To test whether this condition is met, let us consider the energy radiated in -rays during the prompt emission. The radiative efficiency of a GRB, defined by the relation , gives a measure of how efficiently the GRB dissipates the total energy into radiation during the -ray emission phase. On theoretical grounds (Guetta et al. 2001) this efficiency is not expected to be very high, with typical values of which are in agreement with pre-Swift results (De Pasquale et al. 2006). More recent analysis indicates much higher efficiencies, up to , although these values are hard to accommodate within the standard “internal shock” emission mechanism of GRB prompt emission. Assuming a conservative value of , and taking erg for GRB 050801 (see § 3), we obtain erg. This means that the condition is met for s.
Unfortunately, a precise estimate of , the time of the beginning of the afterglow, is not possible. Based on our data, we can only state that must be less than s, when Swift began its follow-up observations. Comparing with the BAT lightcurve, we suggest that the afterglow beginning might be identified as the time of the second peak in the prompt emission, which is s after the first peak. As mentioned above, this peak is broad and clearly softer than the first peak, which is to be expected if the first peak were due to internal shocks and the second to afterglow emission. Such behaviour has already been observed in the prompt emission of several GRBs, such as GRB 970228 (for a review see Frontera et al. 2000). It is worth noting that, if the afterglow begins about s after the trigger, the optical emission detected by ROTSE can be associated with the afterglow and connected with the flat optical lightcurve recorded by UVOT later on (as observed). This comes with the caveat, though, that since we do not know the behaviour of the GRB in X-rays in the interval 20-70s after the trigger, we cannot be sure that the emission in this period is actually due to the forward shock.
We can, however, discuss the possibility that the energy injection, which shapes the early afterglow curve, begins at the time of first ROTSE observation, i.e. 20s after the trigger. In such a case, we obtain, from Eq. 5, that the energy injected is 1.26 higher than previously calculated. This in turn decreases the required initial period by a factor of 1.12, i.e. we obtain ms. From Eq. 3, we can infer that the magnetic field would lower by a factor 1.26, so we have G. As we can see, there is not a big change in the values of the parameters derived.
Finally, we shall briefly discuss the consequences of a slightly incorrect estimate of the redshift, as previously presented. If the true redshift is slightly above the value we used, the value of and estimated previously should be increased and diminished respectively. For small corrections of , the product of these two parameters (see Eq. 5) does not vary largely. In addition, has a weak dependence on this product. Therefore, we do not expect a large variation of . For example, if the true redshift were 10% lower than the value we reported, the value of should increase only by . Conversely, if the true redshift were higher than that we found, should be lower. Similarly, we do not predict a noticeable variation of the magnetic field. From Eq. 3, we can infer that the value of would change by for a variation of the redshift. In the same way, the condition expressed by Eq. 7 is still satisfied in our model, for small changes in without any considerable change of .
4.1.3 Critical issues
The discussion presented in § 4.1.2 is based on a number of assumptions regarding the parameters which describe the physical properties of the GRB. We note, however, that the dependence of the kinetic energy of the ejecta on , , and is not very strong, and so different values are not expected to significantly affect our conclusions. On the other hand, the assumption that all of the EM energy radiated by the pulsar is converted into the kinetic energy of the ejecta is more questionable. In a more realistic scenario, we would expect that only a fraction of this EM energy is converted in this way; in order for our scenario to be consistent, the efficiency cannot be lower than . We certainly do not expect the conversion efficiency to be too low, however, since the relatively low-energy emission from the magnetar is unable to penetrate the shockwave. The Poynting flux energy of the pulsar can therefore only propagate outwards by conversion into the kinetic energy of the ejecta. The constraints regarding the conversion of the EM energy may be somewhat further eased if we assume that the ejecta outflow is moderately beamed. While such a condition would not be in contradiction with the observations or theory, it would further reduce the energy contribution required from the pulsar.
Other uncertainties relate to the way in which the pulsar energy injection is estimated. We assume that the magnetic field is constant during the phase in which energy injection is associated with the rapid pulsar spin down, while in a more realistic scenario the coupling between rotational and magnetic evolution should be accounted for. Moreover, the emitted EM energy is calculated under the simple assumption of dipolar emission in vacuum, which is obviously a crude approximation during the first phases of neutron star formation and evolution. Dynamo effects, the presence of magnetospheric currents or multipolar components of the magnetic field may complicate this simple picture.
Our overall conclusion is that, to a first order approximation, EM energy injection from a rapidly spinning magnetar (a neutron star rotating with a period of a few tenths of a millisecond and possessing an ultra-strong magnetic field of order G) can plausibly explain the observed plateau in the X-ray and optical lightcurves of GRB 050801. Although we have not directly derived estimates of the burst’s physical parameters (, density of surrounding medium), the assumption of canonical values for these quantities is an adequate approximation for the purposes of our calculations.
It is instructive to compare GRB 050801 with the short GRB 051221 Fan & Xu (2006). In this latter event, a flattening occurred in the X-ray lightcurve between s and s after the trigger. Optical data on this burst are rather sparse, and so cannot help constrain the afterglow physics. In the context of short GRBs, which are thought to arise from the coalescence of a binary system composed of two compact objects (such as two neutron stars or a neutron star and a black hole), it is difficult to imagine that the fall-back accretion of part of the material onto the central compact remnant can, hours after the coalescence, pump the emitted energy up to erg. Another scenario was therefore put forward in which two neutron stars coalesce and form a magnetar. In this hypothesis, the flattening of the lightcurve was interpreted as the signature of the underlying magnetar, whose energy injection can only significantly influence the afterglow lightcurve after several kiloseconds post-trigger. According to these authors, a magnetar with an initial period of s and magnetic field of G can explain the observed behaviour. In the case of GRB 050801, we infer values for the period and magnetic field which are, respectively, shorter and higher. This is because, for this burst, the magnetar energy injection must occur over a shorter time interval, whilst the luminosity must be higher. It should be noted, nevertheless, that the differences in these parameters between the two GRBs are within order of magnitude.
4.2 Absence of a reverse shock?
In the standard afterglow model, it is expected that the formation of a forward shock is accompanied by that of a less energetic “reverse shock”, which moves inward through the ejecta (Mészáros & Rees 1997). While the emission of the forward wave is predicted to peak in the X-ray band (at least at the early stages of the afterglow that we are considering here), the emission of the reverse shock should peak in the IR-optical because of the higher density of the ejecta that it crosses.
In the case of GRB 050801, we do not observe any optical flares, and the optical emission always follows the X-ray emission, with the ratio of optical to X-ray flux remarkably constant (see Fig. 3). This suggests that the reverse shock emission is suppressed. A possible reason may be a very high magnetic field in the ejecta, in which case most of the energy is carried by the field itself and it is not converted into radiation in the shells. According to Zhang & Kobayashi (2005), for bursts with short duration (i.e. s), suppression of the reverse shock takes place if the parameter , defined as
| (8) |
where and are the magnetic field and the density of the ejecta respectively, and is the proton mass, is larger than 100. The parameter can be interpreted as the ratio between the energy contained in the magnetic field and that in the baryonic outflow. Since the value of is strongly dependent on the assumptions made about the position of the shock radius and the local particle density, it cannot be robustly determined. If internal shocks occur at small radii, even a relatively low magnetic field may prevent the reverse shock from forming. We can, however, give an order-of-magnitude estimate of assuming an ejecta mass of , a shock radius at the onset of the afterglow of cm and a spherical shell of depth with s. This gives a particle density of cm-3 in the shell, which in turn implies a magnetic field of G. Another observational consequence of a strongly magnetized reverse shock is the broadening of its emission profile (Zhang & Kobayashi 2005). This phenomenon, together with the suppression of the peak emission, would make the reverse shock emission even less evident. It should be noted that the hypothesis of a high magnetic field in the ejecta may be consistent with the powering of the wind by a magnetar. Thus, the non-detection of a reverse shock component in the emission of this burst may be in agreement with the identification of the central engine of GRB 050801 as a magnetar.
Other scenarios are, however, also plausible. For example, we cannot exclude the possibility that, for unusually high density ejecta, the reverse shock emission would have peaked in the far-IR rather than in the IR or optical. In such a case, it would have made a negligible contribution to the emission detected by UVOT, which is consistent with our observations.
5 Conclusions
Swift GRB 050801 shows remarkable spectral and temporal features, in both the X-ray and optical/UV bands. Instead of rapidly decaying flux within 100-200s after the trigger, as seen in the majority of bursts, the GRB 050801 emission in the X-ray and in the optical has a plateau from s up to s after the BAT trigger, followed by a more normal decay slope. It is possible that the plateau actually extends back to s after the trigger, which could explain why the first prompt optical measurement, performed by ROTSE-III at this epoch, is consistent with the UVOT data.
We find that the relatively flat X-ray lightcurve might be caused by a late energy injection by the “central engine” to the expanding shell, in the form of either Poynting flux or the shock dissipation that occurs when late shells catch up with earlier ones. In the case of energy injection due to Poynting flux, we have shown that dipolar spinning down emission from a newly born magnetar of initial period s and magnetic field G can account for the X-ray flux observed during the plateau phase and for its duration. Other models, which involve uneven energy distribution in the ejecta or internal shock emission are likely to be ruled out by the fact that the plateau appears at early time and its emission is remarkably smooth.
The energy injection model requires that the afterglow has already started by the time of the Swift measurements. This hypothesis is supported by the fact that the optical-to-X-ray flux ratio during the plateau is consistent with that observed at late times, when the afterglow has certainly begun. We suggest that the afterglow onset might actually be associated with the second peak detected by BAT. This peak is very soft, as expected if it is connected with the afterglow emission, and it occurred only s after the trigger.
Theory predicts that the forward shock in the circumburst medium, responsible for the afterglow emission, should be accompanied by a reverse shock that moves inwards through the ejecta. The reverse shock emission should be brief and peaked in the optical. On the other hand, the constancy of the optical to X-ray flux ratio observed during this event suggests that no reverse shock emission has taken place, at least during the Swift observations. The suppression of the reverse shock emission might suggest the presence of highly magnetized ejecta, in which most of the energy is carried by the magnetic field rather than the shock.
Finally, a joint fit of the X-ray and optical data has allowed us to confirm that data in both bands lay on the same spectral segment, between the synchrotron peak and the cooling frequency, and to determine the spectral index with high precision. Analysis of the late-time ( s) afterglow emission, based on the application of closure relations, suggests that the GRB fireball had a spherical expansion in a constant density environment. More importantly, we have been able to determine the redshift of the burst as .
6 Acknowledgements
The authors wish to thank J. Osborne, P. Boyd, P. Schady and S. Kobayashi for the valuable comments that helped to improve the manuscript. SZ thanks PPARC for its support through a PPARC Advanced Fellowship.
References
- Barthelmy et al. (2005) Barthelmy S.D. et al., 2005, ApJ, 559, 710
- Berger et al. (2003) Berger E., Kulkarni S.R. & Frail D.A., 2003, ApJ, 590, 379
- Bloom et al. (2001) Bloom J.S., Frail D.A & Sari R., 2001, AJ, 121, 2879
- Burrows et al. (2005) Burrows D.N. et al., 2005, Space Science Review, 120, 165.
- Cameron et al. (2005) Cameron P.B. et al., 2005, GCN 3762
- Dai & Lu (1998) Dai Z.G. & Lu T., A&A, 1998, 333, L87
- Dickey & Lockman (1990) Dickey J.M. & Lockman, F.J., 1990, ARA&A, 28, 215D
- De Pasquale et al. (2006) De Pasquale M., Piro L., Gendre B. et al., 2006, A&A, 455, 813
- Fan & Xu (2006) Fan Y. & Xu D., 2006, submitted to MNRAS, astro-ph/0605445
- Frail et al. (2001) Frail D.A., Kulkarni S.R., Sari R. et al., 2001, ApJ, 562, L55
- Freedman & Waxmann (2001) Freedman D. & Waxman E., 2001, ApJ, 547, 922
- Frontera et al. (2000) Frontera F., Amati L., Costa E. et al., 2000, ApJ Suppl., 127, 59
- Fynbo et al. (2005a) Fynbo J. et al., 2005a, GCN 3736
- Fynbo et al. (2005b) Fynbo J. et al., 2005b, GCN 3743
- Guetta et al. (2001) Guetta D., Spada M. & Waxman E., 2001, ApJ, 557, 399.
- Jacobsson et al. (2006) Jakobsson P., Levan A., Fynbo J.P.U. et al., 2006, A&A, 447, 897
- Kumar & Piran (2000) Kumar P. & Piran A., 2000, ApJ, 532, 286
- (18) Maccacaro T, Gioia I., Wolter A. et al. 1988 ApJ, 326, 680
- Madau (1995) Madau P., 1995, ApJ, 441, 18
- Mészáros & Rees (1997) Mészáros P. & Rees M.J., 1997, ApJ, 476, 232
- Mészáros & Rees (2001) Mészáros P. & Rees M.J., 2001, ApJ, 556, L37
- Nousek et al. (2006) Nousek J. et al. 2006, ApJaccepted (astro-ph/0508332)
- O’Brien et al. (2006) O’Brien P. et al., 2006, ApJ submitted (astro-ph/0601125)
- Panaitescu et al. (2005) Panaitescu A. et al., 2005, MNRAS submitted (astro-ph/0508340)
- Poole (2005) Poole T.S., 2005, Swift CALDB release note, http://swift.gsfc.nasa.gov/docs/heasarc/caldb/swift/docs/uvot/ uvot_caldb_zeropoints_01a.pdf, http://swift.gsfc.nasa.gov/docs/heasarc/caldb/swift/docs/uvot/ uvot_calb_counttofluxratio_01a.pdf
- Ramirez-Ruiz et al. (2002) Ramirez-Ruiz et al., 2002, MNRAS, 337, 1349
- Roming et al. (2005) Roming P. et al., 2005, Space Science Reviews, 120, 95.
- Rees & Mészáros (1998) Rees M & Mészáros P, 1998, ApJ, 496, L1
- Rykoff et al. (2006) Rykoff E.S. et al., 2006, ApJ, 638, L5
- Sari & Mészáros (2000) Sari R. & Mészáros P., 2000, ApJ, 535, L33.
- Seaton M.J. (1979) Seaton M.J., 1979, MNRAS, 187, 73.
- Zhang & Mészáros (2001) Zhang B. & Meszaros P., 2001, ApJ, 552, L35
- Zhang & Mészáros (2002) Zhang B. & Meszaros P., 2002, ApJ, 566, 712
- Zhang et al. (2004) Zhang W., Woosley S.E. & Heger A., 2004, ApJ, 608, 365.
- Zhang & Mészáros (2004) Zhang B. & Meszaros P., 2004, IJMPA, 19, 2385 (astro-ph 03111321)
- Zhang & Kobayashi (2005) Zhang B., Kobayashi S., 2005, ApJ, 628, 315
- Zhang et al. (2006a) Zhang B., Fan Y.Z., Dyks J. et al., 2006a, ApJ, 642, 354
- Zhang et al. (2006b) Zhang B., et al., 2006b, ApJ, submitted. (astro-ph 0610177)