Determination of Black Hole Mass in Cyg X-1 by Scaling of Spectral Index-QPO Frequency Correlation
Abstract
It is well established that timing and spectral properties of Galactic Black Hole (BH) X-ray binaries (XRB) are strongly correlated. In particular, it has been shown that low frequency Quasi-Periodic Oscillation (QPO) - photon index correlation curves have a specific pattern. In a number of sources the shape of the index-low frequency QPO correlations are self-similar with a position offset in the plane. Titarchuk & Fiorito presented strong theoretical and observational arguments that the QPO frequency values in this correlation should be inversely proportional to . A simple translation of the correlation for a given source along the frequency axis leads to the observed correlation for another source. As a result of this translation one can obtain a scaling factor which is simply a BH mass ratio for these particular sources. This property of the correlations offers a fundamentally new method for BH mass determination in XRBs. Here we use the observed QPO-index correlations observed in three BH sources: GRO J1655-40, GRS 1915+105 and Cyg X-1. The BH mass of M⊙ in GRO J1655-40 is obtained using optical observations. RXTE observations during the recent 2005 outburst yielded sufficient data to establish the correlation pattern during both rise and decay of the event. We use GRO J1655-40 as a standard reference source to measure the BH mass in Cyg X-1. We also revisit the GRS 1915+105 data as a further test of our scaling method. We infer the value of BH mass of in this source which is consistent with the previous BH mass estimate in GRS 1915 of . We obtain the BH mass in Cyg X-1 in the range .
1 Introduction
In Galactic Black Hole (GBH) sources transitions between spectral states are accompanied by a characteristic evolution of timing properties (see McClintock & Remillard, 2006, for the review of BH spectral states). In particular, low frequency quasi-periodic oscillations (LF QPO) observed during low-hard and intermediate states are very closely correlated with the photon index of the power law spectral component (e.g. Vignarca et al., 2003). Recently, the same type of correlation have been firmly established for Cyg X-1 [Shaposhnikov & Titarchuk (2006), hereafter ST06] and GRO J1655-40 [Shaposhnikov et al. (2007), hereafter S07]. In this Paper we use these correlations to constrain the mass of BH in Cygnus X-1 based on the theoretically motivated dependence of QPO-index pattern on the mass of the central BH.
Some progress has been made in understanding how variability scales with BH mass between GBHs and AGNs (see Done, & Gierlinski,, 2003, and references therein). However, in most studies authors concentrate on the observational aspects giving less attention to the physical reasoning behind the scaling method. The ubiquitous nature of the correlation of index with QPO frequency suggests that the underlying physical process which gives rise to the LF QPO is closely tied to the corona; and, furthermore, that this process varies in a well defined manner as a source progresses from one spectral state to another. Moreover, the fact that the same correlations are seen in so many sources, which vary widely in both luminosity (presumably with mass accretion rate) and state, suggests that the physical conditions controlling the index and the low frequency QPOs are characteristics of these sources, and that by virtue of the low-high-frequency correlations [see Psaltis, Belloni & van der Klis (1999) and Belloni, Psaltis & van der Klis 2002), they may be a universal property of all accreting compact systems. The observational evidence presented above motivated the development of a detailed physical model of the corona surrounding a BH which directly predicts the behavior of the spectral index with fundamental properties of the corona [see Titarchuk, Lapidus & Muslimov (1998), hereafter TLM98; Laurent & Titarchuk (1999); Titarchuk & Osherovich (1999) and Titarchuk & Fiorito (2004), hereafter TF04). This model incorporates the fundamental principles of fluid mechanics, radiative transfer theory and oscillatory processes. It identifies the LF QPOs as normal mode oscillation frequency of a compact coronal region near the BH and shows how the photon index of this corona changes as a function of mass accretion rate. It is important to emphasize that the variable QPO frequency scaling as is a generic feature of the TLM98 model. In fact, the QPO frequency scales as a ratio of plasma (magneto-acoustic) velocity and the size of the oscillating region, which is measured in the Schwarzchild radius units.
TF04 illustrate how the mass of one BH source can be used to determine that of another using the RXTE data from GRS 1915+105 and XTE J1550-564, which exhibit remarkably similar QPO frequencyindex correlation curves. The scaling factor between the LF QPOs of two X-ray BH sources with similar power-law (PL) photon indices can be used to determine the ratio of their BH masses. The mass determination using the QPO frequencyindex correlation is consistent with X-ray spectroscopic and dynamical mass determinations for these sources (see references in Shrader & Titarchuk 2003). The scaling was successfully applied for ultra-luminous sources using QPO frequencies (Fiorito & Titarchuk, 2004; Strohmayer et al., 2007). Fiorito & Titarchuk (2004) and Dewangan, Titarchuk & Griffiths (2006) applied this new method of BH mass determination to estimate the black hole mass of the ultraluminous X-ray sources M82 X-1. Using scaling arguments and the correlation derived from the consideration of Galactic black holes, they conclude that M82 X-1 is an intermediate black hole with a mass in the range of (250-1000) M⊙. Recently this technique led Strohmayer et al. (2007) to estimation of BH mass of in ULX source NGC 5408 X-1.
In this Paper we demonstrate how the TF04 scaling method can be applied to the determination of the Cyg X-1 BH mass . We obtain when we scale the index-QPO correlation of GRO J1655-40 vs that of Cyg X-1 along frequency axis. We test this scaling method using BH masses of GRS 1915+105 and GRO J1655-40 previously inferred from optical and IR observations.
2 Sources and Observations
2.1 GRO J1655-40
The X-ray binary GRO J1655–40 (GRO J1655 hereafter) is a well-known example of a BH X-ray transient that underwent several major outbursts within the last 12 years. It was discovered by the BATSE instrument onboard the Compton Gamma-Ray Observatory in mid 1994 (Zhang et al., 1994). The secondary star being relatively bright, the binary parameters are exceptionally well determined among LMXBs. The most recent optical photometry of Green, Bailyn & Orosz (2001) led to a BH mass estimate of . During RXTE era GRO J1655 had two major outburst in 1996/97 and in 2005. However, during the first event pointed RXTE observations started when the source was already in the high-soft state and the state transition was not covered. The 2005 outburst was recognized at a very early stage and observers at different wavelengths were relatively prepared and successful at responding relatively quickly (see S07, for extended report on multiwavelength campaign during 2005 outburst). Almost daily RXTE coverage allowed to observe timing and spectral evolution of the source in detail. We distinguish the data during the outburst rise and decay because the correlation patterns are slightly offset presumably due to different plasma temperatures in the corona (see below for explanation). The data during the outburst rise were collected between MJD 53420 and 53440, while the decay data were collected between MJD 53627 and 53640. We refer a reader to S07 for the details of spectral and timing data analysis of the outburst rise data. The decay data were analyzed in the same manner.
2.2 Cyg X-1
Cyg X-1 is one of the brightest high-energy sources in the sky, with an average 1-200 keV energy flux of ergs cm-2s-1. Its optical companion is an O9.7 Iab supergiant HDE 226868. Estimates of the mass of the X-ray star, [e.g., Herrero et al. (1995)] strongly suggest the presence of a black hole. Observed spectral and temporal X-ray characteristics are extensively studied by ST06, based on the large amount of data collected in the RXTE archive (see §2 in ST06 for the data description). They presented the analysis which includes 2.2 Ms of RXTE archival data from Cygnus X-1. The main findings of the ST06 study are following: The photon index steadily increases from 1.5 in the low/hard state to values exceeding 2.1 in the high-soft state. The low frequency is detected throughout the low-hard and intermediate state, while it disappears when the source undergoes transition to the soft (thermal dominated) state. Like in other BH sources, there is an indication of saturation of the index in the high-soft state for Cyg X-1 (see ST06, Fig. 8) This saturation effect, which is presumably due to photon trapping in the converging flow, can be considered to be a BH signature.
2.3 GRS 1915+105
GRS 1915+105 (GRS 1915 hereafter) is another prominent Galactic BH binary. The source is very bright and exhibits very diverse temporal properties. In attempt to classify the variability in GRS 1915 Belloni et al. (2000) identified at least 12 different classes. Morgan, Remillard & Greiner (1997) reported three different types of QPO: a QPO with constant centroid frequency of 67 Hz, a dynamic low-frequency ( Hz) QPO with a large variety of amplitudes and widths, and high-amplitude “sputters” at frequencies of Hz. Authors also mention that it is difficult to describe the source properties in term of conventional BH states. A BH mass estimation for GRS 1915+105 of is available from IR observations [Greiner et al. (2001)] and X-ray observations [Borozdin et al. (1999) and Shrader & Titarchuk (2003)].
Despite the complicated nature of the GRS 1915 spectral and timing properties we were able to construct the QPO-photon index correlations. We use the data from six RXTE observations, namely: 10408-01-27-00, 20402-01-50-00, 20402-01-50-01, 20402-01-51-00, 20402-01-52-000, 40702-01-02-00. All the data, except for the last observation, are collected in the hard state. During this state power density spectrum (PDS) of the source is very close in shape to the PDS of the classical hard state ( Belloni’s variability class), i.e. the band-limited noise plus one or two low frequency QPOs. Data from these observations yield the lower part of QPO-index correlation curve (see Fig. 1). During the observation 40702-01-02-00 the source exhibited irregular variability with flaring episodes ( class). This observation yields the upper part of the correlations with a saturation. For each observation we calculated energy and Fourier spectra for consecutive intervals of 128 seconds. Following the approach of Vignarca et al. (2003) we fit the data with a sum of multicolor disk and power law models. We fit PDS continuum with broken power law shape to model band-limited noise and we modeled QPOs with Lorentzians.
3 QPO-spectral index correlation model
In most BH sources, the correlation of the spectral indexQPO frequency follows a remarkably similar pattern. Namely, at lower QPO frequencies the dependence starts at the index of (e.g. low-hard state) and follows linear correlation with positive slope until some QPO frequency value where it levels off. This saturation of index versus QPO frequency approximately corresponds to the intermediate state. Then, upon the QPO turn off, the source enters the soft state.
According to our scenario (see TLM98 and TF04 for details) the LF QPO features are observational appearances of a Compton cloud (CC) undergoing normal mode volume oscillations. The radius of the CC outer boundary is the radius where adjustment of disk Keplerian rotation to sub-Keplerian CC rotation occurs. It should be determined in Schwarzchild radius () units, namely . Thus the CC size should be proportional to and QPO frequency (as a ratio of the magneto-acoustic velocity and size) should be reciprocal to the characteristic size of the system and consequently to . The spectral index, on the other hand, is a measure of CC upscattering efficiency.
Note that direct connection of variability in the low-hard and intermediate states with power law spectral component has been identified and well established in many studies (see van der Klis, 1995, and references therein). In the hard state the mass accretion rate is low, the size of the corona is large and the index is determined by thermal Comptonization in an optically thin geometrically thick configuration. When accretion rate starts to increase a cold disk becomes stronger and CC cooling by disk photons becomes more efficient. Ultimately the CC plasma temperature goes down. In the high-soft state the CC temperature is of the order of the disk temperature (about 1 keV). As the mass accretion rate increases the adjustment radius decreases and consequently the CC cloud contracts (see TLM98, TO99). QPO frequency increases with the CC contraction, while decreasing CC temperature leads to the lower efficiency of Comptonization (lower Comptonization parameter ), and thus to higher photon indices . Bradshaw, Titarchuk & Kuznetsov (2007) derived a simple relation which shows that anti-correlates with , namely they show that .
The presented picture explains a positive correlation between spectral index and QPO frequency. The index saturation for higher QPO values can be accounted for by the bulk motion inflow (dynamical) Comptonization which becomes dominant for the final stage of state transition when the corona is cooled down by the disk photons. The saturation level of index can vary for the same source for different transition episodes. This index saturation value is determined by the plasma temperature of the converging flow (CF) [see Laurent & Titarchuk (1999)] during a transition. On the other hand (see above) the CF plasma temperature strongly depends on the CF illumination by the disk photon. For higher photon flux from the disk, the CF plasma temperature is lower. The level of the index saturation decreases when the CF plasma temperature increases.
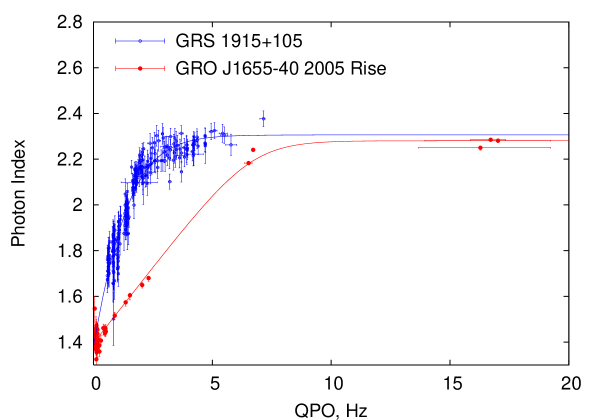
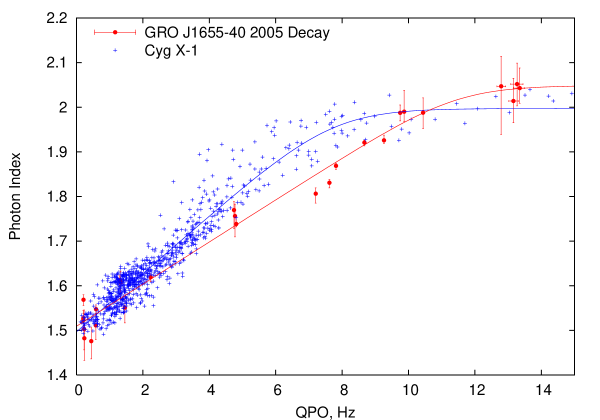
Thus the index saturation levels can be different from source to source depending on the strength of the disk in these sources. Even for the same source the index saturation can be variable. In Figures 1 and 2 for GRO J1655-40 one can see the different index saturation levels , and during 2005 outburst rise and decay stages respectively. More details of this physical scenario theory can be found in Titarchuk, & Fiorito (2004) (and references therein).
We must stress that the main property of index-QPO relation which we use for scaling method does not depend on a specific physical mechanism of photon and power density spectral formation. The only assumption we use is that for a given index QPO frequency is inversely proportional to a BH mass (see TLM98, TF04). Important advantage of the technique is its independence of the system geometry and a distance to a source.
The disadvantage of the method is that the mass of one BH exhibiting clear index-QPO pattern has to be well known. Fortunately, such a system is available, i.e. GRO J1655-40. Another restriction of the method is that it is not applicable to the data sets with different index saturation levels. The main requirement of the scaling method is the QPO-index correlations should be self-similar for two given sources. In the sense that the scaling one correlation versus another along log-frequency axis leads to the same shape for these sources. The scaling method does not work properly for the data sets with different index saturation levels.
4 Data analysis. Application of scaling method
In principle, it is possible to construct index-QPO relation on the basis of the physical theory presented in TF04. However, the exact relation between optical depth and Reynolds number (which is the inverse of -parameter in the disk) requires the knowledge of the disk equation of state. The direct implementation of the theory has to include some assumption about the functional form of because of uncertainties of the disk equation of state and the plasma viscosity in the disk. It is worth noting that any disk model does not specify an exact value of parameter [see e.g. Shakura & Sunyaev (1973); Narayan & Yi (1994); Chakrabarti & Titarchuk (1995)].
The fact that the scaling method follows from the first principles allows us to avoid the full implementation of the accretion theory to construct QPO-index relation for each particular source. All we need is a simple function which correctly represens the data and gives us means to calculate a scaling coefficient between two correlation curves. The correlations between QPO frequency and photon index for three sources considered in this Paper are shown in Figures 1 and 2. It is clear that QPO-index correlations follow a simple pattern. Namely, the dependence is linear with particular slope for lower frequencies, while near some frequency (which we call ) the function smoothly levels off to become a constant. This behavior is well reproduced by the following analytical function:
| (1) |
The two asymptotes of this function are for and for . Thus, is a value of the index saturation level, is a slope of the low frequency part of the data, is the frequency at which index-QPO dependence levels off . Parameter controls how fast the transition occurs. It is important to point out that the slope of the asymptote for in Eq. (1) is proportional to the BH mass. Using the above model function we fit the observed index-QPO correlations and apply the scaling method for mass BH determination.
4.1 Scaling from GRO J1655-40 correlation to GRS 1915+105 correlation
For scaling with GRS 1915 we choose the data from the rise of the 2005 GRO J1655 outburst because in both cases the photon index saturation level is approximately . We first fit the GRO J1655 points. We found the following best fit parameters: , Hz-1 and Hz. The was fixed at 1.0 Hz. The best-fit curve is shown by a red solid line in Figure 1. The best fit values found for GRS 1915+105 are: , Hz-1 and Hz. For a scaling factor we have . We obtain a BH mass in GRS 1915 as
using the scaling method and the value of BH mass in GRO J1655 of . The inferred uncertainties (error bars) of are mostly affected by scattering and error bars of index-QPO points in the GRS 1915 correlation (see Fig. 1). The value of BH mass of is consistent with the previous BH mass estimate in GRS 1915 of . This result of QPO-index correlation scaling demonstrates a potential power of our method of a BH mass determination.
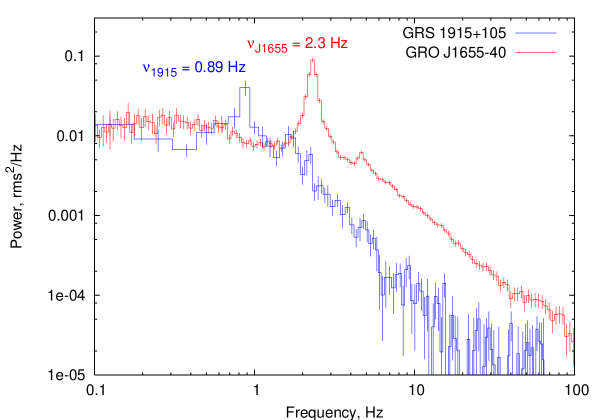
In Figure 3 we illustrate the idea of the scaling method using individual PDSs related to the same spectral state (index). The PDSs presented for GRO J1655 and GRS 1915 have the same flat-top noise levels and similar slopes after the break. However, QPOs for GRO 1655-40 are shifted by approximately a factor of .
5 Scaling from GRO 1655 to Cyg X-1 correlations. BH Mass in Cyg X-1.
Now we proceed with the main result of this Paper, namely, with the mass determination of BH in Cyg X-1 using QPO-index scaling. We apply exactly the same procedure (described in the previous section) for the RXTE mission-long data of Cyg X-1 and the GRO J1655 data from decay stage of its 2005 outburst. We perform the initial fit to Cyg X-1 data to obtain: , Hz-1 and Hz. Fit for GRO J1655 decay data gives: and Hz-1 and Hz. For both fits we freeze at 1.0. For the mass of BH in Cyg X-1 we have:
Here we again use as a value of BH mass in GRO J1655. This inferred value of Cyg X-1 BH mass is slightly lower than 10 given by Herrero et al. (1995) (with no error bars quoted) and it is within the mass range found by Gies & Bolton (1986).
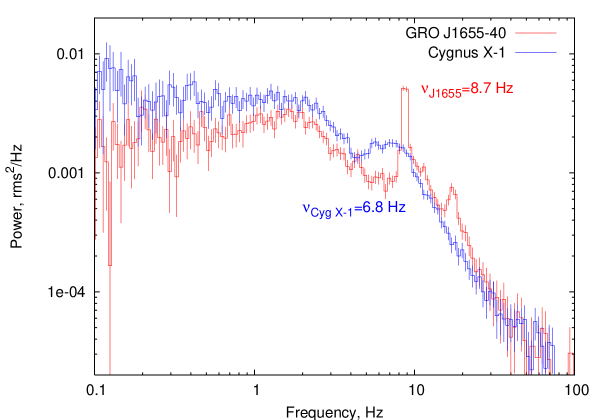
In Figure 4 we present the individual PDS of Cyg X-1 and GRO J1655 related to the same spectral state (index). One can see that the corresponding values of QPO frequencies are very close. However QPO in Cyg X-1 is less coherent than that in GRO 1655 which is presumably a result of photon scattering in the strong ambient wind of Cyg X-1 (see ST06 for details).
6 Conclusions
Our results for the QPO-index correlation scaling from the GRO J1655 to GRS 1915 and from the GRO J1655 to Cyg X-1 data points demonstrates a potential power of the new method of a BH mass determination.
We have tested this scaling method using the known (from optical and IR observations) BH masses in GRO J1655 and GRS 1915. We were able to reproduce and confirm the previous estimate of BH mass of GRS 1915 . We obtain that .
Our scaling method along with the observed index-QPO correlation give for the BH mass in Cyg X-1 , which is the most close constrains on the BH mass for this prominent source obtained up to date in literature. Low Cyg X-1 mass function is an obstacle for dynamical mass measurement from optical data, which is also affected by the uncertainty in the source distance. Our alternative method does not suffer from these restrictions, which allows such a precise measurement of the BH mass.
We acknowledge the referee’s constructive suggestions for the improvement of the paper presentation.
References
- Belloni et al. (2000) Belloni, T., Klein-Wolt1, M., Mendez, M., van der Klis, M., & van Paradijs 2000, A&A, 355, 271
- Borozdin et al. (1999) Borozdin, K., Revnivtsev, M., Trudolyubov, S., Shrader, C. & Titarchuk, L. 1999, ApJ, 517, 367
- Bradshaw, Titarchuk & Kuznetsov (2007) Bradshaw, C. F., Titarchuk, L. & Kuznetsov, S.I. 2007, ApJ, in press
- Chakrabarti & Titarchuk (1995) Chakrabarti, S.K. & Titarchuk, L. 1995, ApJ, 455, 623
- Done, & Gierlinski, (2003) Done, C, & Gierlinski, M. 2003, MNRAS, 342, 1041
- Dewangan, Titarchuk & Griffiths (2006) Dewangan, G. C., Titarchuk, L., Griffiths, R. E. 2006, ApJ, 637, 1, L21
- Gies & Bolton (1986) Gies, D. R., Bolton, C. T. 1986, ApJ, 304, 371
- Green, Bailyn & Orosz (2001) Greene, J., Bailyn, C. D., & Orosz, J. A. 2001, ApJ, 554, 2, 1290
- Greiner et al. (2001) Greiner, J., Cuby, J.G., & McCaughrean, M.G. 2001, Nature, 414, 522
- Herrero et al. (1995) Herrero, J., et al. 1995, A&A, 297, 556
- Fiorito & Titarchuk (2004) Fiorito, R., Titarchuk, L. 2004, ApJ, 614, 2, L113
- van der Klis (1995) van der Klis, M. 1995, in X-ray binaries, ed. W.H.G. Lewin, J.,van Paradijs, & E.P.J. van der Heuvel (Cambridge Univ. Press, Cambridge), p. 252
- Laurent & Titarchuk (1999) Laurent, P. & Titarchuk, L. 1999, ApJ, 511, 289 (LT99)
- McClintock & Remillard (2006) McClintock, J. & Remillard, R. 2006, to appear in Compact Stellar X-ray Sources, eds. W. H. G. Lewin & M. van der Klis (Cambridge: Cambridge Univ. press), astro-ph/0306213
- Morgan, Remillard & Greiner (1997) Morgan, E. H.; Remillard, R. A.; Greiner, J. 1997, ApJ, 482, 993
- Narayan & Yi (1994) Narayan, R., & Yi, I. 1994, ApJ, 428, L13
- Orosz & Bailyn (1997) Orosz, J. A., Bailyn, C. D. 1997, ApJ, 482, 1086
- Shakura & Sunyaev (1973) Shakura, N.I., & Sunyaev, R.A. 1973, A&A, 24, 337
- Shaposhnikov & Titarchuk (2006) Shaposhnikov, N., & Titarchuk, L. 2006, ApJ, 643, 1098 (ST06)
- Shaposhnikov et al. (2007) Shaposhnikov, N., Swank, J. H., Shrader, C.R., Rupen, M., Beckmann, V., Markwardt, C.B., Smith, D.A. 2007, ApJ, 655, 1, in press (S07)
- Shrader & Titarchuk (2003) Shrader, C., & Titarchuk, L.G. 2003, ApJ, 598, 168
- Strohmayer et al. (2007) Strohmayer, T. E., Mushotzky, R, Winter, L., Soria, R., Uttley, P., Cropper, accepted for publication in ApJ, astro-ph/0701390
- Titarchuk, & Fiorito (2004) Titarchuk, L.G. & Fiorito, R. 2004, ApJ, 612, 988 (TF04)
- Titarchuk, Lapidus & Muslimov (1998) Titarchuk, L., Lapidus, I.I., & Muslimov, A. 1998, ApJ, 499, 315 (TLM98)
- Titarchuk, Mastichiadis & Kylafis (1997) Titarchuk, L., Mastichiadis, A., & Kylafis, N. D., 1997, ApJ, 487, 834
- Vignarca et al. (2003) Vignarca, F., Migliari, S., Belloni, T., Psaltis, D., & van der Klis, M. 2003, A&A, 397, 729 (V03)
- Zhang et al. (1994) Zhang, S. N., Harmon, B. A., Paciesas, W. S., Wilson, C. A., Fishman, G. J. 1994, IAUC 6106