Bursting and Quenching in Massive Galaxies
without Major Mergers or AGNs
Abstract
We simulate the buildup of galaxies by spherical gas accretion through dark-matter haloes, subject to the development of virial shocks. We find that a uniform cosmological accretion rate turns into a rapidly varying disc buildup rate. The generic sequence of events (Shocked-Accretion Massive Burst & Shutdown: SAMBA) consists of four distinct phases: (a) continuous cold accretion while the halo is below a threshold mass , (b) tentative quenching of gas supply for , starting abruptly once the halo is and growing a rapidly expanding shock, (c) a massive burst due to the big crunch of gas in , when the accumulated heated gas cools and joins new infalling gas, and (d) a long-term shutdown, enhanced by a temporary shock instability in late SAMBAs, those that quench at , burst at and end up quenched in haloes today. The quenching and bursting occur at all redshifts in galaxies of baryonic mass and involve a substantial fraction of this mass. They arise from rather smooth accretion, or minor mergers, which, unlike major mergers, may leave the disc intact while being built in a rapid pace. The early bursts match observed maximum starbursting discs at , predicted to reside in haloes. The late bursts resemble discy LIRGs at . On the other hand, the tentative quenching gives rise to a substantial population of galaxies with a strongly suppressed star-formation rate at -. The predicted long-term shutdown leads to red & dead galaxies in groups. A complete shutdown in more massive clusters requires an additional quenching mechanism, as may be provided by clumpy accretion. Alternatively, the SAMBA bursts may trigger the AGN activity that couples to the hot gas above and helps the required quenching. The SAMBA phenomenon is yet to be investigated using cosmological simulations.
keywords:
shock waves — accretion — galaxies: evolution — galaxies: formation — galaxies: haloes — dark matter1 Introduction
Observations reveal a puzzling phenomenon of “maximum starbursting” in massive galaxies at high redshift in cases where major mergers are ruled out. Examples include LIRGs at (Hammer et al., 2005) and maximum bursters at (Genzel et al., 2006; Förster Schreiber et al., 2006). In these cases, galaxies of stellar masses seem to be forming a large fraction of their stars at a star-formation rate SFR- within . This is much shorter than the age of the universe then, indicating coherent star formation from of gas in the latest stages of its collapse/assembly rather than in its earlier smaller progenitors. Furthermore, the burst duration is significantly shorter than the time implied by the typical cosmological accretion rate onto haloes of at the relevant epochs, and is as short as the time for streaming at the virial velocity from the virial radius to the center. Gaseous major mergers, which could have provided such rapid bursts, are unlikely in many of these cases, where the galaxies are detected to be relatively smooth, rotating, thick discs that could not have survived a major merger and show no trace of such an event. At the low end of the SFR distribution, most galaxies of stellar mass tend to be quenched red & dead galaxies, and a substantial fraction of such galaxies show strongly suppressed star-formation rates (SFR) already at high redshifts, (Kriek et al., 2006; Noeske et al., 2007). We seek an explanation for these phenomena at the two extreme regimes of SFR.
We report here on new insight gained from spherical modeling of gas accretion onto massive galaxies, which could be the basis for understanding the above phenomena and other central issues in galaxy formation.
Following the classic work on the interplay between cooling and dynamical times in galaxy formation (Rees & Ostriker, 1977; Silk, 1977; Binney, 1977; White & Rees, 1978; Blumenthal et al., 1984), we used analytic calculations and hydrodynamical simulations to study the evolution of a virial shock in a spherical configuration (Birnboim & Dekel, 2003; Dekel & Birnboim, 2006). We predicted the existence of a threshold halo mass for the presence of a virial shock, at , roughly independent of redshift. Less massive haloes do not permit a stable shock, as rapid radiative cooling prevents the hypothetical post-shock gas pressure from supporting the shock against global gravitational collapse into the halo center. The gas accreting through the virial radius of such haloes flows cold (K) into the inner halo, where it may eventually shock, feed a disc and efficiently form stars. Once the halo grows above , a stable shock emerges from the inner halo and rapidly propagates toward the virial radius, halting the infalling gas and creating a hot medium in quasi-static equilibrium at the halo virial temperature. We found that the transition to stability occurs when the standard radiative cooling time at the assumed metallicity equals the time for compression behind the shock, , where is the gas density behind the shock, is the shock radius and is the infall velocity into the shock.
Based on these findings, it has been proposed that the presence of hot, dilute gas allows the suppression of gas supply to the disc, possibly assisting AGN feedback, and thus leads to quenching of star formation (Binney, 2004; Dekel & Birnboim, 2006). This mass threshold has proven to be the key for understanding the robust division of galaxies into blue, star-forming discs versus red & dead spheroids and their basic properties (Dekel & Birnboim, 2006; Cattaneo et al., 2006; Croton et al., 2006).
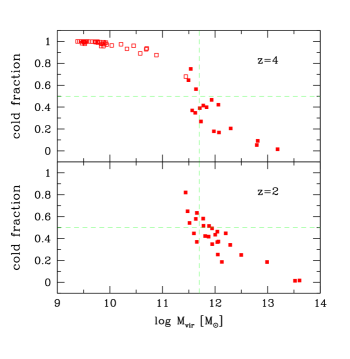
The success of the spherical model in predicting the threshold mass as seen in cosmological hydrodynamical simulations (Kereš et al., 2005; Dekel & Birnboim, 2006) is demonstrated in Fig. 1, which summarizes the results of Birnboim et al. (2007). It shows as a function of halo mass the fraction of cold gas within the virial radius and outside the disc in dark-matter haloes from cosmological simulations by A. Kravtsov (described in Kravtsov, 2003; Kravtsov & Gnedin, 2005, where they were used for other purposes). At all redshifts, there is a transition from cold-dominated haloes to hot-dominated haloes near . This is compatible with the threshold mass predicted by Dekel & Birnboim (2006) for realistic halo metallicities that gradually grow to solar today.
This success of the spherical model motivates our present, more detailed and daring investigation of the spherical configuration. We study how the development of the virial shock converts an otherwise uniform accretion through the virial radius into a rapidly varying accretion rate onto the inner disc. The resultant disc buildup, and the induced SFR, evolve through a generic sequence of events involving two quenching episodes and a massive burst, which always starts at the crossing of the halo threshold mass, namely in galaxies of at any redshift. We term this phenomenon SAMBA, for Shocked-Accretion Massive Burst and Shutdown.
In §2 we describe the simulation method. In §3 we present the four phases of the SAMBA phenomenon. In §4 we dare a tentative comparison to observations. In §5 we describe SAMBA recipes for semi-analytic modeling. In §6 we discuss our results. In §A, related to §2, we provide an EPS estimate of the average virial accretion rate onto dark haloes. In §B, related to §5, we specify the SAMBA recipes for SAMs.
2 Method of Simulations
2.1 The Spherical hydrodynamical code
Our accurate 1-D Lagrangian hydrodynamical code (based on the code described in Birnboim & Dekel, 2003) simulates a spherical gravitating system consisting of dark matter and a fraction of gas with a constant metallicity . The initial smooth density-perturbation profile is constructed such that it produces the desired average accretion rate at the virial radius, §2.2. The dissipationless dark-matter shells detach from the cosmological expansion, collapse and oscillate into virial equilibrium such that they deepen the potential well attracting the dissipating gas shells. The gas is cooling radiatively based on the atomic cooling function computed by Sutherland & Dopita (1993), and contracts dissipatively into the inner halo. The collapse of each gas shell is stopped at of the virial radius by an artificial centrifugal force which mimics the formation of a central disc.
The main improvements to the original code described in Birnboim & Dekel (2003) are as follows. The numerical scheme for time evolution now computes the pressure and energy of the gas shells within the forth-order Runge Kutta solution rather than externally. A force corresponding to the cosmological constant has been added to the force equations, making the calculation fully consistent with the CDM cosmology, though with only minor effects on the evolution inside the haloes. The simulations described here consist of gas shells and dark-matter shells, corresponding to a spatial resolution of in the inner halo growing to near the virial radius. The energy conservation level, set by the timesteps and spatial resolution, is better than over today’s Hubble’s time. Convergence tests of some of the runs with twice the spatial resolution yielded very similar results. The baryonic fraction is assumed to be throughout the simulations presented here, crudely taking into account certain gas mass loss due to feedback effects. Simulations with and yield consistent results.
2.2 Cosmological accretion rate
The average fractional accretion rate onto haloes of mass at time is estimated in §A using the EPS formalism, following Neistein et al. (2006). Eq. (13) reads
| (1) |
| (2) |
Here is the rms linear density fluctuation on the scale corresponding to mass , linearly extrapolated to using the linear growth function normalized to unity at . The constants are from the spherical collapse model, and reflecting an intrinsic uncertainty in the EPS formalism. The accretion time is shown later on in Fig. 8 for haloes of in the CDM cosmology. A practical approximation for haloes of in CDM is
| (3) |
The mass growth history of the main progenitor of a halo that ends up with mass at time is given by eq. (17):
| (4) |
where is the inverse function of
| (5) |
We specify in §A the details of this calculation in CDM.
The initial conditions of the simulation specify the mean density profile of the spherical perturbation , referring to spheres of mass at an initial time in the linear regime. In order to end up with a halo mass at , and have the proper average virial accretion rate throughout the halo history, we invert from eq. (4) to a collapse time for mass , , and then derive the initial profile from
| (6) |
3 Four Phases of Accretion
3.1 Generic SAMBA
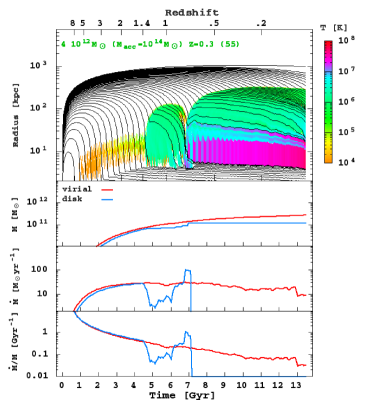
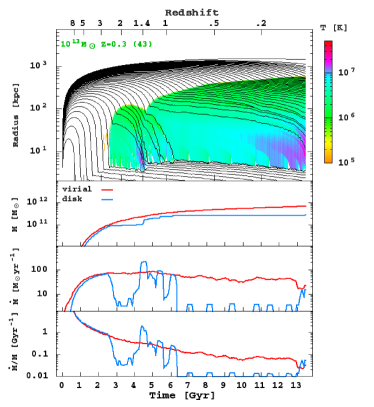
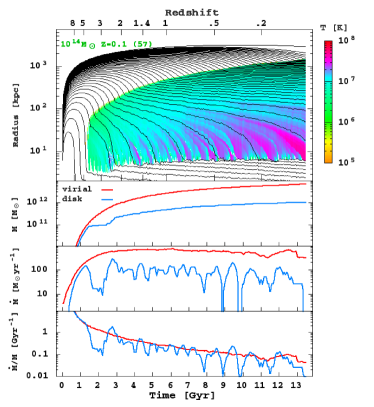
Figures 2, 3 and 4 present the SAMBA phenomenon in three simulations, spanning a range of final halo masses. They display the radii of gas shells as they fall through the virial radius and eventually accrete onto the inner disc. One may tentatively and very crudely identify the disc buildup rate with maximum SFR. We see that every SAMBA consists of four distinct phases, as follows:
1. Cold accretion. As long as the halo mass is below there is no stable shock in the halo. The gas flows cold and unperturbed toward the disc following the cosmological accretion rate at the virial radius, which is constructed here to be rather uniform. The resultant disc accretion rate is growing gradually with time, while the specific is declining. For example, in the late SAMBA shown in Fig. 2, the cold accretion phase lasts till , with the temperature map showing no heating and the disc accretion rate rather uniform.
2. Tentative quenching. A shock forms near the disc upon crossing , and it propagates outward very rapidly. The gas that falls through the shock during its rapid expansion is heated and halted to a stop (sometimes even pulled back) before it cools and rains down. A first phase of suppressed disc accretion lasts for 1-2 Gyr, e.g. between and in Fig. 3.
3. Massive burst. The gas that was slowed down in the previous quenching phase now joins new accreting gas in a big crunch onto the disc. The accumulation of shells in a massive crunch results from the longer delay suffered by gas that falls in through the shock earlier, when the shock expands faster. The crunch is enhanced further when the shock develops a temporary instability causing it to contract back to sub-virial radii. Thus, of gas enter the disc during -, producing a burst of , or , typically twice the specific virial accretion rate.
4. Post-burst slowdown or shutdown. The halo mass is safely above the threshold, with the cooling rate significantly slower than the compression rate, allowing the shock to join the gradual expansion of the virial radius. Bursts that occur prior to are followed by a long period of gradually declining specific accretion rate, which is comparable to the specific virial accretion rate. Bursts that occur after are followed by an effective long-term shutdown from and on, lasting for several Gyr. The infall is halted effectively while crossing the shock during its second expansion phase.
The timing of the SAMBA events scales with the onset time, . A relevant characteristic time scale at that epoch is the virial crossing time, the time it takes to stream at the virial velocity from the halo virial radius to the center. Based on the spherical collapse model, it is independent of mass and given by111 For a proper virial radius, should be replaced by . In a flat universe , with , given in §A and .
| (7) |
In the EdS phase of cosmological evolution (valid to a good approximation prior to ), .
We define the efficiency of disc accretion by the ratio of specific accretion rate into the disc and into the virial radius,
| (8) |
A smoothed version of this quantity over a virial crossing time, , which can be read as the ratio of the two curves shown at the bottom panels of Figs. 2-4, serves us for an automatic identification of the four phases. This quantity is about unity during the cold-flow phase. We mark by the time when starts its first drop below unity due to the shock onset. Then and mark the subsequent crossings of unity upward and downward, which we define as the beginning and the end of the burst. Finally, we identify the following upward crossing of unity, at , as the end of the long-term quenching phase, when such a phase exists.
There are several robust SAMBA characteristics that only weakly depend on the redshift of the event. The onset of the SAMBA is always at the crossing of the threshold halo mass, , thus involving a stellar mass . The burst peaks about half a Hubble time () later, and involves of rapidly accreting gas in about a virial crossing time (-). The average burst efficiency is , with a peak value of .
3.2 Systematic redshift dependence
By simulating the accretion histories of haloes that end up with different masses today, we obtain a sequence of SAMBAs with a range of starting times, , given that the SAMBA onset is determined by the crossing of a fixed halo mass threshold. Our fiducial case assumes the average virial accretion history onto haloes and a constant metallicity solar; we obtain somewhat earlier (later) onset times by lowering (raising) or by raising (lowering) the virial accretion rate at the relevant epoch. It turns out that our current fiducial choice of at all times does not follow the gradual cosmological growth of metallicity with time as estimated in Dekel & Birnboim (2006). This results in an artificial overestimate of at high , by a factor , which we should scale out when considering the cosmological redshift dependence of the SAMBAs.
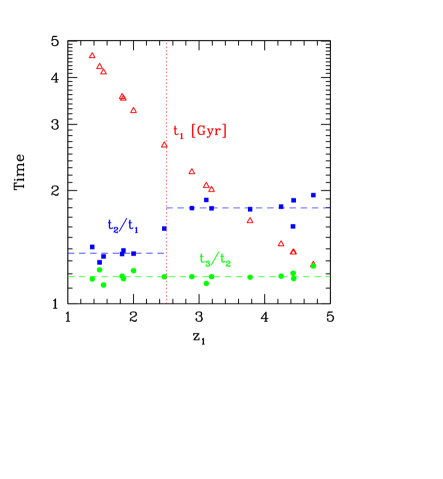
The characteristic times of 15 simulated SAMBAs are shown in Fig. 5. These times naturally scale with the Hubble time. The burst duration is always . The duration of the tentative quenching is for and for . The systematic variations with the onset time are primarily driven by the gradual decline with time of the specific virial accretion rate, which induces a drastic change between SAMBAs that start prior to and those that start later. This is a distinction between the central galaxies of today’s clusters of haloes and the more isolated galaxies in today’s groups of haloes. The former burst before , when , while the latter burst later, when . In the late SAMBAs, the rapidly expanding shock overshoots to outside the virial radius, where the low accretion rate fails to provide enough post-shock compression for support against contraction. The resultant temporary instability makes the shock drop to sub-virial radii before the pressure behind it can push it back to the virial radius. Apparently, this instability appears once the specific virial accretion rate drops below .
The effect of the virial accretion rate on the tentative shock instability is clearly demonstrated in Figs. 2-4. The strength of the instability as measured by the tentative shrinkage of the shock to sub-virial radii, as seen in the top panels, is correlated with the specific virial accretion rate at shock onset, which could be read from the red curve at the bottom panels or from the inverse of the accretion time shown in Fig. 8. This trend is valid for the whole suite of simulated SAMBAs.
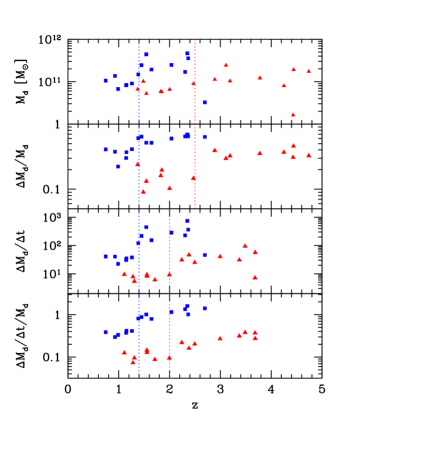
Other quantities characterizing the tentative quenching and the subsequent burst are summarized in Figs. 6 and 7. Most of the burst characteristics vary gradually with the burst time , and show a bimodality to early and late bursts separated at , associated with the shock instability. While in the late bursts the disc mass is , it is typically twice as large in the early burst, where the specific accretion rate is higher and the preceding quenching is less efficient. The fraction of disc mass involved in the burst between and , , varies from in the early bursts to - in the late ones. The mean specific accretion rate, , varies from - to . This corresponds to a drop of the average accretion rate across the burst from - in the early bursts to - in the late bursts. The average burst efficiency over the burst is always , while the peak efficiency changes from in the early bursts to - in the late bursts.
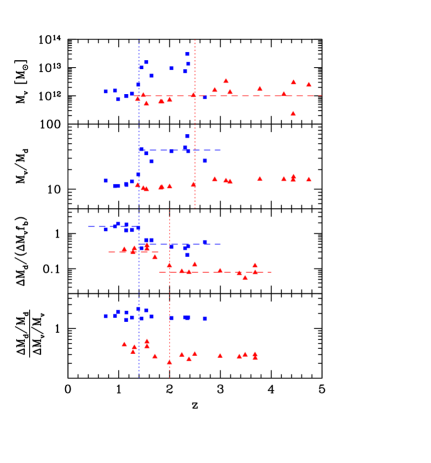
The ratio of virial to disc mass at the end of the burst is bi-modal: It is high for the early bursts, -, and low for the late bursts, -. The high values in the early bursts is because the high virial accretion rate there leads to a rapid halo growth during the quenching phase combined with the failure of the subsequent burst to consume most of the accumulated hot gas. In the late SAMBAs, on the other hand, the halo growth is slow and the burst consumes all the available gas, leading to a low . The early bursts are thus predicted to reside in very massive haloes, of , while the late bursts are to be found in haloes.
The characteristics of the tentative quenching phase also vary gradually with . At the onset of all SAMBAs, and , and we should scale out the apparent slight decline with time of these masses, which is largely an artifact of the assumed constancy of metallicity with time. The typical quenching efficiency is for the early SAMBAs and for the late ones. The ratio of disc to virial gas accretion rate, varies from to in the early and late SAMBAs respectively, separated at onset redshift . The tentative quenching can make the galaxy appear red for before bursting.
The most pronounced effect of the shock instability occurring in the late SAMBAs is a drastic shutdown of disc accretion for several after the burst, starting at or later. The infalling gas is halted and pushed back after crossing the shock during its second rapid expansion phase, and the fact that the halo is already well above makes the cooling and infall time long. These galaxies, in haloes today, will appear red & dead at , without the help of any additional feedback effect. On the other hand, the post-burst phase of the early SAMBAs is characterized by a disc specific accretion rate that fluctuates about the virial rate, . For these central cluster galaxies today to become red & dead one should appeal to another quenching mechanism that could provide long-term maintenance.
4 Comparison with Observations
4.1 Maximum Bursting Disks
Two relevant examples of observed “maximum bursters” stand out. First, rest-frame UV/optically-selected star forming galaxies at (termed BX and BzK). A high-resolution adaptive-optics IR study of BzK-15504 at (Genzel et al., 2006) reveals plus forming stars at -. The stellar population has a typical age of only , less than 20% of the Hubble time at that epoch. The morphology and kinematics fit an exponential disc of scale radius rotating at , and a recent major merger is ruled out. The velocity dispersion of indicates a rapid accretion onto the disc, again of . Several galaxies with similar properties were detected in a lower resolution study (Förster Schreiber et al., 2006).
Other examples are found among the LIRGs at -. Hammer et al. (2005) have detected at least six galaxies of forming stars at while their morphologies and kinematics resemble spiral galaxies with no trace of major mergers. More than half of their IR-luminous galaxies are spirals. The compilation of SFR at by Noeske et al. (2007) reveals some massive galaxies that form stars at , while only of the galaxies show evidence for ongoing major mergers (Lotz et al., 2006), and this fraction is not higher for the galaxies with the highest SFR (private communication).
In summary, the observed maximum bursters show the following robust features: (a) the baryonic mass is on the order of , (b) a substantial fraction of the baryonic mass is bursting, (c) the burst is short compared to the Hubble time and the cosmological mean accretion time, and is comparable to the virial crossing time, (d) the star formation occurs in an extended configuration of a few kpc, and (e) in many cases there are morphological and kinematical indications for a thick rotating disc with no trace of major mergers.
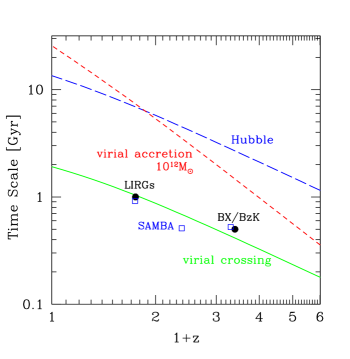
A distinct feature of the maximum bursts is that most of the stars of the galaxies have formed over a short period of time just prior to the observed epoch, at and at . This is compared in Fig. 8 to several relevant characteristic timescales. The burst duration is shorter than the age of the universe at that time by a factor . This implies that most of the stars have formed in a coherent starburst of the whole of gas in its late stages of collapse or assembly rather than in the smaller progenitors during the preceding period of hierarchical buildup. The implied suppression of SFR in small haloes and its possible origin will be discussed in §6.
The burst duration is also shorter than the characteristic time for cosmological accretion onto dark haloes of , the likely hosts of the maximum bursters, as given by the inverse of the average in eq. (1). At , one has , much longer than the indicated observed duration of . At , one has , which is about 3 times the observed , though if the relevant haloes are more massive, , the accretion time is shorter. As seen in Fig. 8, the burst durations are rather comparable to the shortest characteristic time of the system, .
Gas-rich major mergers, which could in principle produce such rapid, massive bursts, fail to match the robust features (a), (d) and (e). In particular, major mergers are expected to destroy the discs and be associated with perturbed clumpy morphology and kinematics rather than a smooth rotating disc. This is because the dynamical disturbance, involving tidal effects and violent relaxation, is expected to be pushed to an extreme during the of the close passages. Furthermore, the induced star formation is expected to be concentrated in a central cusp rather than an extended disc. It is worth noting that the mergers are only weakly associated with a characteristic mass, the nonlinear clustering scale , which varies rapidly with time — they are not associated with galaxies of any specific fixed mass.
The SAMBA bursts, as described by our naive spherical model above, have the potential of reproducing the observed features one by one in a straightforward way. In particular, they have the potential of keeping the disc intact while doubling its mass and puffing up its thickness. This is because the disc buildup, even if it involves filamentary and clumpy cold flows, could be rather uniformly stretched over the - duration of the burst, and therefore involve only moderate perturbative effects on the dynamics. In addition, the SAMBA bursts are predicted to be specifically associated with one characteristic baryonic mass of at all redshifts.
The early SAMBA bursts, which may be associated with the observed maximum bursters at , are predicted to be in discs embedded in rather massive haloes of . The comoving number density of haloes of at is , consistent with the number density of observed maximum bursters (Genzel et al., 2006)222This estimate is for the WMAP3 parameters of the CDM cosmology, , , , and (Spergel et al., 2006). A similar number density is obtained for haloes twice as massive if one adopts instead , , , and . The predicted halo virial velocity is and the virial radius is . The low concentration expected for such haloes at , (Bullock et al., 2001), implies that the circular velocity at should be , compatible with the observed bursters. The large virial radius for that epoch, with an assumed typical spin parameter, implies an exponential disc radius of (Bullock et al., 2001), which explains the observed extended discs.
Thus, the burst properties predicted by the idealized spherical model do surprisingly well in matching the observed bursts.
4.2 Suppressed Star Formation Rate
Despite the apparent vigor of the burst event, the most robust feature of the SAMBAs is the quenching. We note that during the SAMBA sequence of events, from the onset of the shock till the end of the burst about a Hubble time later, each galaxy spends more time in a phase of suppressed accretion rate rather than in a rapid accretion mode. Figure 9 shows a crude estimate of the predicted distribution of disc accretion rate for galaxies in the stellar mass bin - near . This crude estimate is based on the fraction of time spent at each accretion rate in the simulated SAMBA shown in Fig. 3, assuming that it is a representative SAMBA at that epoch. While a fraction of the galaxies are expected to show a high accretion rate into the disc at about twice the average virial level, more than half the galaxies are predicted to present a strongly suppressed disc accretion rate, an order of magnitude below the virial accretion rate or less. The associated distribution of SFR may be qualitatively similar.
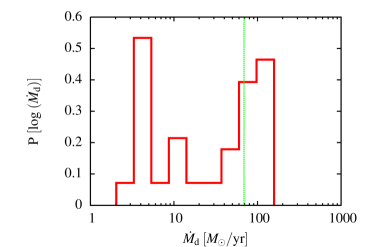
Preliminary indications for a substantial population of galaxies with strongly suppressed SFR already exist. A bimodality in the SFR distribution is apparent at in Noeske et al. (2007, Fig. 1), where the typical SFR is while about half the galaxies have an upper limit of SFR. At -, Kriek et al. (2006) report that a significant fraction of the galaxies have surprisingly low upper limits for the specific SFR at , while the typical is .
The SAMBAs predict that the SFR histories of galaxies should show two peaks of SFR separated by a couple of Gyr, but this might be hard to detect observationally.
4.3 Downsizing
The SAMBA phenomenon provides a simple explanation for the observed “downsizing” of elliptical galaxies. An “archaeological” analysis of stellar ages reveals that today’s more massive ellipticals have formed their stars earlier and over a shorter time span (Thomas et al., 2005). From their SFR histories as a function of look-back time one learns that elliptical galaxies of present-day stellar mass have formed most of their stars at - in a maximum burst over - with (or - in lower density environments). The progenitors of today’s ellipticals, prior to their subsequent growth via dry mergers, seem to be consistent with the maximum bursters seen at high redshift, and with the SAMBA predictions.
The constancy of with redshift, which implies that all galaxies burst when they are and quench immediately after automatically implies downsizing in both the peak of SFR and the subsequent quenching. Galaxies of larger stellar mass today are likely to be embedded in more massive haloes, which in turn have crossed the threshold mass for the onset of SAMBA at an earlier time. They bursted earlier, for a shorter duration, and shut down earlier accordingly. This is demonstrated in a cosmological semi-analytic simulation by Cattaneo et al. (2007).
The SAMBAs predict yet another kind of downsizing phenomenon, concerning halo mass at burst: the early bursts at are predicted to reside in massive haloes only slightly smaller than , while the late bursts are to be found in smaller haloes, .
5 Recipes for Semi-Analytic Models
In order to study the potential observable implications of the SAMBA phenomenon in more detail, one can translate the predictions from the spherical model into a recipe for gas cooling and accretion rate onto the disc. This recipe is to be incorporated in Semi-Analytic Models (SAM), which follow the baryonic physics in given dark-halo merger trees. The SAMBA recipe should replace the standard recipe adopted in SAMs (White & Frenk, 1991), which assumes that the halo gas interior to a “cooling radius” is accreted onto the disc. The cooling radius within a (spherical) halo of a given mass at a given time is traditionally determined by the position where the cooling time equals a certain dynamical time, e.g., the Hubble time. The SAMBA phenomenon suggests a deterministic modification of the disc accretion rate, based on our spherical modeling, with no free parameters. However, an optimal match to observations may suggest a certain fine-tuning of the model parameters, compensating for deviations from spherical symmetry and uniform accretion.
5.1 Following Halo Evolution in SAM
The proposed SAMBA recipe for the accretion rate onto the disc is specified in §B.1. In summary, given the mass growth of each halo in the merger tree, , and its derivative , the SAMBA onset time (redshift ) is identified by , and the SAMBA is classified as “early type” or “late type” according to whether or respectively. Then the times and , the beginning and the end of the burst, are computed using the fits shown in Fig. 5. The algorithm then specifies the growth rates of cold and hot gas mass during each of the four SAMBA phases defined by the above times. The numerical factors used for the tentative quenching and for the burst are read from straightforward fits to in Fig. 7.
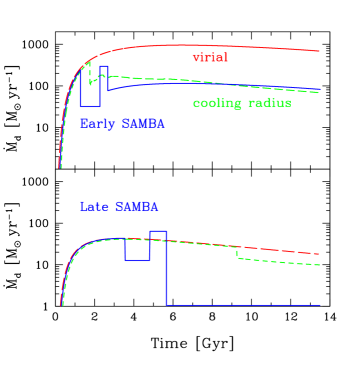
The disc mass growth according to the proposed SAMBA recipe for SAM is shown in Fig. 10 for typical early and late SAMBAs. It is compared to the standard disc growth rate following the evolution of a “cooling radius”. The latter has a characteristic drop when the cooling radius first becomes smaller than the virial radius. The cooling-radius recipe can be somewhat improved once the Hubble time used in its definition is replaced by . Yet, it fails to capture the depth of the tentative quenching, the burst, and the long-term quenching of late SAMBAs.
Recall that the early SAMBAs, ending up in haloes today, should be quenched after by another mechanism, such as clumpy accretion or AGN feedback. If such a process is not explicitly included in the SAM, one can simply set in the post-burst phase for all haloes (as in Cattaneo et al., 2006).
5.2 SFR as a function of Halo Mass: FHM
An alternative, quick and crude way to learn about the implications of SAMBAs is by providing a recipe for the SFR as a function of halo mass and redshift, to be incorporated in a given halo population in a partial SAM while bypassing the detailed baryonic processes of cooling, star formation, and feedback (Formation History Modeling, FHM, Croton & Dekel, 2007). The fact that the SAMBA phenomenon is driven by halo mass allows us to provide a concrete recipe of this sort, specified in §B.2.
In summary, one starts with at , and computes the other SAMBA characteristic halo masses and , corresponding to the characteristic times and , using fits to our simulation results. Given the virial accretion rate in the provided merger tree, , the disc accretion rate, which could be interpreted as an upper limit for the SFR, is given in each of the mass ranges, corresponding to the four SAMBA phases. The numerical values are read from crude fits to the simulation results for , as shown in Fig. 7. When implementing the recipe, one can either use the actual mass growth rate of the haloes drawn from merger-tree realizations, or the average virial accretion rate as provided in eq. (3).
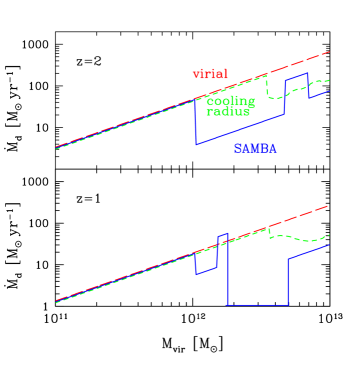
The SAMBA recipe for disc accretion rate is shown in Fig. 11, compared to the standard rate based on a “cooling radius”. Again, the cooling-radius recipe can be somewhat improved once the Hubble time is replaced by , but it would still fail to recover the burst and the deep quenching features of the SAMBAs.
The main feature of the SAMBA FHM is the quenching of SFR above a threshold halo mass, , as already implemented in SAM simulations (Cattaneo et al., 2006; Croton et al., 2006). The interesting new feature predicted by the model is the high SFR in a second range of masses above . At low redshifts, this is a slight increase of the effective threshold mass for quenching to . At , the high SFR is predicted to extend to haloes as large as . This should allow the appearance of massive blue galaxies at high redshifts. In the special range , the high SFR is expected over an especially broad range of masses, - (not shown in Fig. 11). Given that is the typical mass for haloes that form at this redshift range, this should lead to a peak in the history of cosmological SFR density (the “Madau” plot).
6 Discussion and Conclusion
A straightforward spherical model of uniform gas accretion onto haloes predicts a robust, rich sequence of events in the accretion onto the central discs, SAMBA, which could be the major driver of star-formation history in galaxies. An initial cold accretion phase ends abruptly upon the birth of a shock in the inner regions of a halo once its mass exceeds a threshold mass of and the disc contains . The infall of gas through the expanding shock creates a period of tentative quenching, where the accretion onto the disc is suppressed for a couple of Gyr. The accumulating hot gas joins new incoming gas in a big crunch, leading to a massive, rapid, burst involving of gas in a few hundred Myr. The subsequent expansion of the shock to the virial radius results in a long-term shutdown, which is especially efficient if the burst occurs after , corresponding to today’s haloes of . The predicted SAMBA bursts seem to match the observed maximum bursters of at and at , as well as the indicated population of galaxies with suppressed SFR. This rich phenomenon is a generic consequence of uniform accretion, before including the effects of major mergers or AGN feedback.
The implications of the SAMBA phenomenon should be taken with a grain of salt because the relevance of the spherical uniform accretion model to the actual SFR history in real galaxies is yet to be demonstrated. This is an immediate challenge for cosmological simulations. The actual accretion could be rather filamentary and clumpy to begin with, and one should verify the extent to which the SAMBA behavior remains valid under such conditions. One could be encouraged though by the success of the spherical model in predicting the threshold mass for virial shock heating (Kereš et al., 2005; Dekel & Birnboim, 2006; Birnboim et al., 2007). First clues for natural long-term quenching of the sort predicted here in a halo may be seen in high-resolution simulations of galaxies with quiet histories (Naab et al., 2007; Libeskind & Dekel, 2007). The following discussion of possible implications is pursued under the tentative assumption that other robust SAMBA features will also be reproduced in cosmological simulations of the formation of such galaxies. The apparent match of the spherical predictions with several different observations makes this discussion worthwhile.
Using the fact that the accretion onto the disc is a straightforward function of halo mass, we propose a simple accretion recipe for SAMs, to replace the standard recipe based on a “cooling radius”. A realistic study of the SFR that is associated with this galaxy buildup, both in the case of smooth accretion of minor mergers and under major mergers and feedback effects, is necessary for a reliable comparison with observations. Still, the naive interpretation of the disc accretion rate as the maximum possible SFR provides a preliminary indication for a surprisingly good match to observations.
An obvious necessary condition for SAMBAs (which is actually automatically implied by the observed maximum bursts independent of any model) is that a substantial fraction of the accreting material onto haloes of is gaseous rather than stellar. Star formation could have been suppressed in haloes smaller than a certain threshold due to different processes, such as stellar feedback or a density threshold for star formation. Given such a threshold mass, we can estimate the gas fraction in the accretion by evaluating the mass in all accreting haloes below that threshold compared to the total accreting mass (Neistein & Dekel, 2007). We find using the EPS formalism specified in §A that about one half of the accreting mass onto a halo of is in haloes smaller than (or “smooth” accretion), independent of time. This should therefore be the minimum halo mass for star formation in order to have a gas-dominated accretion. If the suppression is due to supernova feedback, the minimum mass for star formation corresponds to haloes of virial velocity (Dekel & Silk, 1986; Dekel & Birnboim, 2006, Fig. 2), for which the accretion is almost all gaseous at , it is about 90% at , and about 67% at . This hints that supernova feedback could be the suppression mechanism allowing the accretion onto haloes to be predominantly gaseous at all relevant redshifts.
The dramatic variations in the disc accretion rate imply that each galaxy is likely to evolve through several subsequent phases of very high and very low SFR. This means that the expected overall trend of evolution from the blue cloud to the red sequence of galaxies is not a one-way track. In particular, some of the red & dead galaxies observed at high redshift may actually become blue again at later redshifts. The lesson is that the interpretation of the observed evolution of the blue and red luminosity functions may involve non-trivial book-keeping.
The late SAMBAs offer a very efficient post-burst shutdown that lasts for 6-7 Gyr. This can naturally give rise to red & dead galaxies in today’s small-group haloes of , perhaps S0 or elliptical galaxies (as simulated by Naab et al., 2007; Libeskind & Dekel, 2007).
In the early SAMBAs, the accretion rate into the disc is suppressed compared to the virial rate even during the burst phase, but the post-burst accretion rate is not negligible. For these central galaxies in today’s cluster haloes of to end up as large red & dead ellipticals one needs a quenching mechanism beyond the one provided by spherical accretion. We show elsewhere (Birnboim & Dekel, 2007) that this could be provided by clumpy accretion, in which gas clumps of transfer their gravitational energy via drag and local shocks into heating and puffing up of the inner-halo gas of haloes.
Alternatively, a fashionable scenario suggests that the required quenching is provided by AGN feedback (Croton et al., 2006; Cattaneo et al., 2006). It has been noticed that the shock heating of the gas in haloes enables the required coupling of the AGN energy with the halo gas (Dekel & Birnboim, 2006), but we now realize that the SAMBA burst may be the actual trigger for AGN activity just above this critical mass. The SAMBAs may thus be responsible for both, the energy source and the coupling mechanism.
If the SAMBAs are responsible for triggering AGN activity, recall that they do so only in galaxies of , a couple of Gyr after their haloes became larger than . This may explain the otherwise surprising result that the bright quasars (near of their Schechter luminosity function) seem to reside at all redshifts in haloes of (Croom et al., 2005). A straightforward calculation using the Press-Schechter formalism shows that the evolution of number density of quasars at can be reproduced by assuming quasar onset in every halo when it first becomes and allowing a fixed short lifetime for each quasar.
The SAMBA events offer a complementary alternative to wet major mergers in producing rapid, massive bursts, with the important difference that it can leave the disc intact. The associated shutdown leads to red & dead galaxies in haloes above the threshold mass. However, while major mergers also automatically produce spheroids, what could be the mechanism responsible for spheroid formation in association with the old, gas-poor stellar population according the halo shutdown scenario? First, the SAMBA burst provides the gas necessary for bar instability in the disc, which then transfers angular momentum to the outer disc and halo and produces a bulge. Second, the SAMBA quenching makes any subsequent mergers dryer, so they could lead to the large, boxy, non-rotating ellipticals, which cannot be reproduced by wet major mergers (Novak & et al.,, 2007). Third, the minor mergers associated with the continuous smooth accretion of SAMBA could themselves lead to the formation of a spheroid (Naab et al., 2007; Bourneaud & et al.,, 2007; Libeskind & Dekel, 2007).
We argued in Dekel & Birnboim (2006) that discs could be built and form stars by cold streams, which could persist as narrow filaments even within the shock heated medium slightly above , especially at high redshifts. Streaming at the virial velocity, these flows could indeed give rise to rapid starbursts, on a time scale comparable to the virial crossing time, but it is not clear that these flows could bring in mass in a rate that is much more efficient than the cosmological accretion rate. The SAMBAs provide such more efficient bursts in a natural way.
All the above is yet to be confirmed in cosmological simulations. It would be interesting to learn how the SAMBA phenomenon manifests itself when the spherical accretion of minor mergers is accompanied by filamentary streams and major mergers.
Acknowledgments
We acknowledge stimulating discussions with S.M. Faber, R. Genzel, F. Hammer & J.P. Ostriker. This research has been supported by ISF 213/02 and GIF I-895-207.7/2005.
References
- Bardeen et al. (1986) Bardeen J. M., Bond J. R., Kaiser N., Szalay A. S., 1986, ApJ, 304, 15
- Binney (1977) Binney J., 1977, ApJ, 215, 483
- Binney (2004) Binney J., 2004, MNRAS, 347, 1093
- Birnboim & Dekel (2003) Birnboim Y., Dekel A., 2003, MNRAS, 345, 349
- Birnboim & Dekel (2007) Birnboim Y., Dekel A., 2007, in preparation
- Birnboim et al. (2007) Birnboim Y., Dekel A., Kravtsov A., Zinger E., 2007, in preparation
- Blumenthal et al. (1984) Blumenthal G. R., Faber S. M., Primack J. R., Rees M. J., 1984, Nature, 311, 517
- Bourneaud & et al., (2007) Bourneaud F., et al., 2007, PhD thesis, IAP, Paris
- Bullock et al. (2001) Bullock J. S., Dekel A., Kolatt T. S., Kravtsov A. V., Klypin A. A., Porciani C., Primack J. R., 2001, ApJ, 555, 240
- Bullock et al. (2001) Bullock J. S., Kolatt T. S., Sigad Y., Somerville R. S., Kravtsov A. V., Klypin A. A., Primack J. R., Dekel A., 2001, MNRAS, 321, 559
- Cattaneo et al. (2006) Cattaneo A., Dekel A., Devriendt J., Guiderdoni B., Blaizot J., 2006, MNRAS, 370, 1651
- Cattaneo et al. (2007) Cattaneo A., Dekel A., Faber S. M., 2007, astro-ph/07xxxxx
- Croom et al. (2005) Croom S. M., Boyle B. J., Shanks T., Smith R. J., Miller L., Outram P. J., Loaring N. S., Hoyle F., da Ângela J., 2005, MNRAS, 356, 415
- Croton & Dekel (2007) Croton D. J., Dekel A., 2007, astro-ph/07xxxxx
- Croton et al. (2006) Croton D. J., Springel V., White S. D. M., De Lucia G., Frenk C. S., Gao L., Jenkins A., Kauffmann G., Navarro J. F., Yoshida N., 2006, MNRAS, 365, 11
- Dekel & Birnboim (2006) Dekel A., Birnboim Y., 2006, MNRAS, 368, 2
- Dekel & Silk (1986) Dekel A., Silk J., 1986, ApJ, 303, 39
- Förster Schreiber et al. (2006) Förster Schreiber N. M., Genzel R., Lehnert M. D., Bouché N., Verma A., Erb D. K., Shapley A. E., et al., 2006, ApJ, 645, 1062
- Genzel et al. (2006) Genzel R., Tacconi L. J., Eisenhauer F., Förster Schreiber N. M., Cimatti A., Daddi E., Bouché N., et al., 2006, Nature, 442, 786
- Hammer et al. (2005) Hammer F., Flores H., Elbaz D., Zheng X. Z., Liang Y. C., Cesarsky C., 2005, A&A, 430, 115
- Kereš et al. (2005) Kereš D., Katz N., Weinberg D. H., Davé R., 2005, MNRAS, 363, 2
- Kravtsov (2003) Kravtsov A. V., 2003, ApJ, 590, L1
- Kravtsov & Gnedin (2005) Kravtsov A. V., Gnedin O. Y., 2005, ApJ, 623, 650
- Kriek et al. (2006) Kriek M., van Dokkum P. G., Franx M., Quadri R., Gawiser E., Herrera D., Illingworth G. D., et al., 2006, ApJ, 649, L71
- Lacey & Cole (1993) Lacey C., Cole S., 1993, MNRAS, 262, 627
- Libeskind & Dekel (2007) Libeskind N., Dekel A., 2007, in preparation
- Lotz et al. (2006) Lotz J. M., Davis M., Faber S. M., Guhathakurta P., Gwyn S., Huang J., Koo D. C., et al., 2006, astro-ph/0602088
- Mo & White (2002) Mo H. J., White S. D. M., 2002, MNRAS, 336, 112
- Naab et al. (2007) Naab T., Johansson P. H., Efstathiou G., Ostriker J. P., 2007, astro-ph/0512235
- Neistein & Dekel (2007) Neistein E., Dekel A., 2007, in preparation
- Neistein et al. (2006) Neistein E., van den Bosch F. C., Dekel A., 2006, MNRAS, 372, 933
- Noeske et al. (2007) Noeske K. G., Weiner B. J., Faber S. M., Papovich C., Koo D. C., Somerville R. S., Bundy K., Conselice C. J., et al., 2007, astro-ph/0701924
- Novak & et al., (2007) Novak G., et al., 2007, in preparation
- Rees & Ostriker (1977) Rees M. J., Ostriker J. P., 1977, MNRAS, 179, 541
- Silk (1977) Silk J., 1977, ApJ, 211, 638
- Spergel et al. (2006) Spergel D. N., Bean R., Doré O., Nolta M., Bennett C. L., Hinshaw G., Jarosik N., et al., 2006, astro-ph/0603449
- Sugiyama (1995) Sugiyama N., 1995, ApJS, 100, 281
- Sutherland & Dopita (1993) Sutherland R. S., Dopita M. A., 1993, ApJS, 88, 253
- Thomas et al. (2005) Thomas D., Maraston C., Bender R., de Oliveira C. M., 2005, ApJ, 621, 673
- van den Bosch (2002) van den Bosch F. C., 2002, MNRAS, 331, 98
- Wechsler et al. (2002) Wechsler R. H., Bullock J. S., Primack J. R., Kravtsov A. V., Dekel A., 2002, ApJ, 568, 52
- White & Frenk (1991) White S. D. M., Frenk C. S., 1991, ApJ, 379, 52
- White & Rees (1978) White S. D. M., Rees M. J., 1978, MNRAS, 183, 341
Appendix A Main Progenitor History
Following Neistein et al. (2006), we use the EPS formalism(Lacey & Cole, 1993) to derive an analytic estimate for the main progenitor history. We track time backwards via the variable , where is the cosmological growth factor of linear density fluctuations normalized to (see below), and (ignoring small variations due to the actual cosmology used). Mass enters via the monotonically decreasing function , the standard deviation of the initial density fluctuations, as derived from their power spectrum, smoothed on a scale that corresponds to mass and linearly extrapolated to (see below). According to EPS, a halo of mass at has the following average number of progenitors of mass in the range at the earlier time :
| (9) |
where and .
A.1 Accretion Rate onto at : a Small Time Step
We wish to compute the main progenitor history, i.e., the conditional average . The main progenitor is guaranteed to also be the most massive progenitor when is small enough, and this allows us to compute by evaluating for small .
For , the probability density is the same as the total progenitor distribution given by equation 9. For , however, the only condition is , and it is not sufficient to constrain . As a first approximation we assume that the main progenitor always has a mass . Then, the average mass of the main progenitor is
| (10) | |||
where with , and . The rate of change is then
Using the limit when we get
| (12) |
Thus, the mean specific accretion rate onto haloes of mass at is
| (13) |
with
| (14) |
| (15) |
When is not negligibly small, the probability for is not negligible, as it grows in proportion to . Neistein et al. (2006) showed that this effect is rather small and can be bounded by well defined limits on , though the exact value of is not fully specified by the EPS formalism. They showed that eq. (13) is still a valid approximation, but with slightly larger than 2, and limited to the range 2-2.3 for a flat CDM cosmology with and . We adopt for all practical purposes.
As a sanity check, note that the obtained specific accretion rate at a fixed mass is self-similar in time, consistent with the fact that the only relevant mass scale at any given time is the non-linear clustering mass of the Press-Schechter formalism, , defined by . This is because the time dependence in eq. (13) is via . Once is divided by the universal growth rate , the time dependence enters only through . Any viable approximation for the cosmological accretion rate must obey a self-similarity of this sort.
We also note in eq. (2) that at a fixed , when , but recall that haloes of are rare, such that most of the accreted mass is not onto arbitrarily massive haloes.
A.2 Mass Growth History of at
The mass growth history of the main progenitor of a halo of mass at is obtained by integrating eq. (12) over and over in the two sides of the equation:
| (16) |
The desired average mass of the main progenitor at can be extracted from the above equation,
| (17) |
where is the inverse function of , to be evaluated either explicitly or via numerical interpolation.
A.3 A Power-Law Power Spectrum
A simple, fully self-similar example is provided by a power-law power spectrum, , for which
| (18) |
Here is a normalization constant, and is measured in units of , the average mass originally contained in a top-hat sphere of comoving radius (e.g. for ). In this case, the average accretion rate is given by eq. (13) with
| (19) |
Then,
| (20) |
and the explicit solution for the average main-progenitor mass is
| (21) |
(with , in units of , and ).
Eq. (13) with from eq. (19) approximates the accretion rate for a general power spectrum once is the local slope . For , appropriate for in the CDM cosmology, we have . This is indeed similar to the power index of the mass dependence from N-body simulations (Wechsler et al., 2002, Fig. 12).
The time dependence can be approximated in standard CDM by eq. (37). Using a crude power-law approximation for the growth of the Press-Schechter mass out to , , we end up with a practical approximation for the accretion rate into haloes in the vicinity of ,
| (22) |
which is accurate to better than 10% over the range .
A.4 CDM Power Spectrum
For the standard CDM power spectrum we adopt with the transfer function (Bardeen et al., 1986)
Here , with the wave number in units of , and with the shape parameter (Sugiyama, 1995)
| (24) |
This power spectrum can be used to derive and the corresponding with in eq. (2). This can then be substituted in eq. (13) for an explicit estimate of the average accretion rate onto haloes of mass at . It can then be used in eq. (16) for computing , evaluating its inverse function numerically, and using it in eq. (4) to obtain the average history of the main progenitor, .
Alternatively, following van den Bosch (2002), the rms fluctuation corresponding the CDM power spectrum is approximated (to better 1% in the range ) by
| (25) |
| (26) |
and with the fitting function
Substituting this analytic approximation in eq. (16), numerically inverting , and using it in eq. (4), Neistein et al. (2006) derived the following approximation for the average main progenitor history:
| (28) |
with and the fitting function
This fitting function is accurate to better than 1% over the range for the standard CDM cosmology.
A.5 In Cosmological N-body Simulations
Wechsler et al. (2002) analyzed an N-body simulation of CDM for the average mass-growth history of the main progenitor of a halo of mass at . They found a good fit with
| (30) |
| (31) |
This function is a good practical approximation to the EPS estimate specified above, as long as is the present time, .
A.6 Useful Relations for Linear Fluctuations
FollowingMo & White (2002), in a flat universe
| (32) |
| (33) |
with a negligible error on the order of in . Thus
| (34) |
Here
| (35) |
| (36) |
For CDM with and , a practical approximation is
| (37) |
which is accurate to better than 1% at and better than 10% at .
The fluctuation variance is derived in the general case by integrating the power spectrum,
| (38) |
with , and with the Fourier transform of the real-space top-hat window function or radius
| (39) |
Appendix B Recipes for SAMs
B.1 Following Halo Evolution in SAM
Given the mass growth of each halo in the merger tree, , the SAMBA onset time (redshift ) is identified by . The SAMBA is classified as “early type” or “late type” according to whether or respectively. Then the beginning and the end of the burst, as read from Fig. 5, are
| (40) |
This defines the four phases of gas cooling.
The growth rates of cold and hot gas mass during each phase can be approximated as follows:
1. Cold-flow phase, ,
| (41) |
2. Tentative-quenching phase, ,
| (42) |
| (43) |
where and . The numerical factors for early and late SAMBAs, both for the tentative quenching and for the burst below, are read from straightforward fits to in Fig. 7.
3. Burst phase, ,
| (44) |
| (45) |
where is the accumulated hot gas mass by , . The cold accretion is more efficient in the late bursts because of the tentative shock instability due to the lower virial accretion rate at late times.
4. Post-burst phase, ,
| (46) |
| (47) |
The numerical factor for early SAMBAs is read from the fit at to the results shown in Fig. 7, combined with the fact, seen in Fig. 4, that during the post-burst phase and . Recall that the early SAMBAs, ending up in haloes today, should be quenched after by another mechanism, such as clumpy accretion or AGN feedback. If such a process is not explicitly included in the SAM, one can simply set in the post-burst phase for all haloes (as in Cattaneo et al., 2006).
The disc mass growth according to the proposed SAMBA recipe for SAM is shown in Fig. 10, in comparison with the standard disc growth following the evolution of a “cooling radius”.
B.2 SFR as a function of Halo Mass: FHM
An alternative, quick and crude way to learn about the implications of SAMBAs is by providing a recipe for the SFR as a function of halo mass and redshift, to be incorporated in a given halo population in a SAM while bypassing the detailed baryonic processes of cooling, star formation, and feedback (Formation History Modeling, FHM, Croton & Dekel, 2007). The fact that the SAMBA phenomenon is driven by halo mass allows us to provide a concrete recipe of this sort.
The SAMBA characteristic halo masses , and , corresponding to the characteristic times , and , can be approximated based on our simulations by
| (48) |
| (49) |
| (50) |
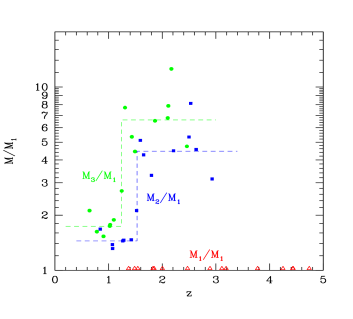
The constant value of is as predicted by Dekel & Birnboim (2006) for a realistic gradual increase of metallicity with time. Then and are obtained from the fits shown in Fig. 12. Notice the interesting prediction that in the range is much larger than , giving rise to a broad range of massive haloes with high SFR.
Given the virial accretion rate in the provided merger tree, , the disc accretion rate, which could be interpreted as an upper limit for the SFR, is approximated in the different mass ranges by:
1. Cold-flow range, ,
| (51) |
2. Tentative-quenching range, ,
| (52) |
3. Burst range, ,
| (53) |
The numerical values are read from crude fits to the simulation results for , as shown in Fig. 7.
4. Post-burst range, ,
| (54) |
| (55) |
The upper-limit for effective quenching, , is the mass of the intermediate SAMBA separating late from early SAMBAs, which eventually ends up as today. The above estimate is based on the fit to simulations, eq. (30). Note that once , , so in this redshift range automatically implies .
The numerical values in the quenching and burst phases are read from the crude fits to the simulation results shown in Fig. 7, in most of which the virial mass grows according to the average cosmological rate. When implementing the above recipe, one can either use the actual mass growth rate of the haloes drawn from merger-tree realizations, or the average virial accretion rate as provided in eq. (3).
The main feature of the model is the quenching of SFR above a threshold halo mass, , as already implemented in SAM simulations (Cattaneo et al., 2006; Croton et al., 2006). The interesting new feature predicted by the model is the high SFR in a second range of masses above . At low redshifts, this is a slight effective increase of the threshold mass to . At , the high SFR is predicted to extend to haloes as large as . This should allow the appearance of massive blue galaxies at high redshifts. In the special range , the high SFR is expected over an especially broad range of masses. Given that is the typical mass for haloes that form at this redshift range, this should lead to a peak in the history of cosmological SFR density (the “Madau” plot).
B.3 Fine-tuning of the SAMBA Recipes
While the above recipes are our best guess based on the spherical model, with no free parameters, a better match to observations may require modest fine-tuning of model parameters, e.g., allowing for certain uncertainties in the assumptions made in the computations, as well as compensating for deviations from spherical symmetry and uniform accretion.
The uncertainty in the value of the critical mass for shock heating, , can easily accommodate a factor of two and some redshift dependence. As computed in Dekel & Birnboim (2006), it is a function of certain physical parameters, in particular redshift and the average metallicity and gas fraction in the inner halo, which also vary with . The estimates of as a function of are shown in their figure 2. A practical approximation based on their equation 34 is
| (56) |
where and . In this formula, following Dekel & Birnboim (2006), the variation of mean metallicity with redshift can be crudely approximated by
| (57) |
Following Bullock et al. (2001), the average halo concentration near is evolving as
| (58) |
With this choice, the critical mass is and is only a weak function of redshift. It becomes even weaker if gets slightly higher at high . One can see that a factor of 4 change in the unknown results in a factor of in .
Another uncertainty, which is explicit in the FHM recipe, is in the actual SFR that is associated with the maximum possible rate provided by the disc accretion rate. This can be modeled as a free ratio, smaller than unity, between the two.