The Birthrate of Magnetars
Abstract
Magnetars, neutron stars with ultra strong magnetic fields (G), manifest their exotic nature in the form of soft gamma-ray repeaters and anomalous X-ray pulsars. This study estimates the birthrate of magnetars to be 0.22 per century with a galactic population comprising of 17 objects. A population synthesis was carried out based on the five anomalous X-ray pulsars detected in the ROSAT All-Sky Survey by comparing their number to that of massive OB stars in a well defined volume. Additionally, the group of seven X-ray dim isolated neutron stars detected in the same survey were found to have a birthrate of 2 per century with a galactic population of 22,000 objects.
keywords:
pulsar: general — stars: neutron — stars: statistics — stars: magnetic fields — supernovae: general1 Introduction
The end products of massive stars with initial masses in the range , neutron stars (NSs) constitute of the total stellar population of the Milky Way in the form of active pulsars (Lyne & Graham-Smith, 2006). It is now understood that not all NSs turn out to exhibit radio pulsations. This missing link manifests itself in a highly energetic class of NSs called magnetars (Zhang, 2003). Duncan & Thompson (1992) proposed the existence of magnetars with ultra strong magnetic fields 100 times stronger than that observed for normal radio pulsars ( G; see Ziolkowski, 2002). Magnetar formation, they argued, is caused by a vigorous helical dynamo action during the initial stages of birth for NSs with initial periods ms. Furthermore, the magnetar model predicts the occurrence of gamma-ray or X-ray bursts from these powerful sources due to starquakes caused by strong magnetic field activity (Duncan & Thompson, 1992; Thompson & Duncan, 1996).
Such bursting behavior has been observed for both soft gamma-ray repeaters (SGRs) and anomalous X-ray pulsars (AXPs; see Kaspi et al., 2003; Gavriil et al., 2002). On March 5, 1979, a high intensity burst (similar to a short gamma-ray burst) and subsequent smaller bursts from the same patch of sky recorded by several orbiting spacecrafts unveiled the existence of soft gamma-ray repeaters in our galaxy (Mazets et al., 1979). Interestingly, the burst from this source only lasted s, but was followed by a decaying less energetic periodic pulse of period s (Terrell et al., 1980). Later this source was recognized as SGR 0525-66 in the supernova remnant (SNR) N49, outside our galaxy in the Large Magellanic Cloud. Following this discovery, the rest of the known SGRs (SGR 1806-20, SGR 1900+14, SGR 1627-41) were discovered in our galaxy over a period of 25 years. Subsequent observations of SGR 1806-20 confirmed that SGRs are indeed magnetars characterized by high quiescent X-ray luminosities and strong magnetic fields (Kouveliotou et al., 1998).
The AXPs are another class of very energetic and young NSs now believed to be associated to SGRs, and are also considered magnetars (see Mereghetti et al., 2002). As of yet only 7 confirmed AXPs have been discovered, namely 1E 2259+586, 4U 0142+61, 1E 1048.1-5937, 1RXS J170849.0-400910, 1E 1841-045, CXOU J010043.1-721134, and XTE J1810-197111http://www.physics.mcgill.ca/pulsar/magnetar/main.html. Both SGRs (in quiescence) and AXPs share many similarities and are generally characterized by steady X-ray luminosities (), long spin periods ( s), secular spin down rates with large period derivatives (), strong magnetic fields ( G), and an apparent lack of a binary companion (Woods & Thompson, 2006). Nevertheless, some spectral differences exist between the two. Although pulsed radio emission has been detected from only one of the magnetars (AXP J1810-197; Camilo et al., 2006), the rest are found to be radio quiet.
In addition, two new groups of NSs, namely the X-ray dim isolated NSs (XDINSs) and the rotating radio transients (RRATs), have recently been discovered. The XDINSs are a group of seven radio-quiet NSs (often referred to as the ‘magnificent seven’) associated to a nearby OB star complex comprising the Gould belt (Popov et al., 2003). These objects have spin periods between 3 - 11 s, with relatively low X-ray luminosities () and magnetic fields ( G) compared to the SGRs/AXPs (see Haberl, 2004, 2005; Treves et al., 2000). Here the reader is cautioned not to generalize the magnetic field estimate to the whole XDINS family as it is solely derived from the spin period and period derivative measurements of just two of its members (RX J0720.4-3125, RBS 1223; Kaplan & van Kerkwijk, 2005a, b). For the remaining XDINSs no period derivatives have been obtained so far. As the name suggests, RRATs are transient radio sources that exhibit sporadic radio bursts of duration between 2 - 30 ms (McLaughlin et al., 2006). These radio bursts have a maximum flux density of Jy with burst time intervals between 4 min - 3 hr. What makes RRATs worthy of consideration is that their spin periods ( s) and magnetic fields ( G) are just in the right range to allow suspicion of some association between these and the XDINSs (Popov, 2006). So far 11 such sources have been discovered.
To make the scene even more congested, yet another class of NSs begs its introduction. Characterized by long periods ( 0.2 - 7 s), high magnetic fields ( G), and spindown ages yrs, high B-field radio pulsars (HBRPs) are strong candidates, among the above said objects, in having any connection with the magnetar population (Gonzalez et al., 2007; Vranevsevic et al., 2007). Many members of this class have been detected in the X-rays while others have displayed exceedingly dim X-ray emission.
Due to the paucity of sources, no population synthesis of magnetars has been performed. As a result, it is still unclear how magnetars fit into the grand scheme. Basically, the questions that we are asking in this study are:
-
1.
What is the birthrate of magnetars?
-
2.
How these objects are associated to other classes of NSs?
Kouveliotou et al. (1998) argued that roughly 10% of all NSs become magnetars and that their birthrate is high per century. Estimates of the same magnitude have been proposed based on the spin down histories of AXPs or derived solely from the age of the SNR to which few magnetars are associated (van Paradijs et al., 1995). In other instances it has also been noted that spindown ages of magnetars may not strictly correspond to the age of the SNRs due to decaying fields (Colpi et al., 2000). This renders any birthrate calculations to be unsatisfactory since these assume constant magnetic fields. Moreover, Woods & Thompson (2006) conjecture that birthrate estimates are dependent on the efficiency of finding these magnetars which is limited by the sensitivity of the detector. Therefore, it is necessary to conduct a population synthesis in order to obtain a reasonable (possibly a lower limit because of transients) estimate of the birthrate of magnetars. Here the authors deem necessary to stress the point that this study only looks at the persistent AXPs and no transient sources are included in the source sample, thus, only a lower limit to the magnetar birthrate can be obtained.
The rest of the paper is organized as follows: Section 2 outlines the method employed for this study with a brief discussion of the ROSAT All-Sky Survey. The results and the corresponding discussion are presented in Section 3. Finally, we end with a brief note of recommendation in Section 4 and the conclusion of this study in Section 5.
2 Method
To provide an overview of the analysis, the whole scheme of calculation has been divided into three main tasks. First, the detector count rate at a fiducial distance of 1 kpc is calculated as a function of the column density , for each object in the sample. The sample comprises of the five AXPs and the seven XDINSs, all detected in the ROSAT All-Sky Survey (RASS) with a high S/N ratio. The SGRs were not detected in the statistically well-defined RASS so they are not included in the sample. Rather we have simply assumed that the existing cadre of instruments could have detected any active SGR in the Galaxy. Second, the maximum distance to which a source registered a count rate of (a) 0.05 cts and (b) (the ROSAT count rate with the lowest acceptable S/N ratio) in the RASS, is computed. The maximum distance is expected to vary with position on the sky due to the difference in the integrated column densities; peering into the galactic disk is much harder in comparison to the galactic poles. Third, this maximum distance is then transformed into a limiting volume within which the number of massive OB stars, that are the most likely progenitors of neutron stars, is sought. An exercise of this sort requires the use of a smoothly varying luminosity function as well as the number density of stars in a given volume. Comparison of the number of massive OB stars found in the surveyed volume to that of their total population yields the scaling factor. The scaled populations of AXPs and XDINSs complemented by the knowledge of their spindown ages, finally, provide their birthrates in the Galaxy.
The ROSAT All-Sky Survey (RASS)
ROSAT, short for ROentgen SATellite, was an X-ray space observatory launched on June 1, 1990. Equipped with a position-sensitive proportional counter (PSPC), a field of view, ROSAT produced an unprecedented all sky survey in a period of 6 months. It surveyed the whole sky in the keV () energy range at a typical limiting count rate of 0.015 cts (Hünsch et al., 1999). ROSAT had an orbital period of 96 min with 40 min nighttime per orbit and it scanned the whole sky in great circles perpendicular to the line connecting the Earth and the Sun. Consequently, regions on the sky falling at the ecliptic registered much less exposure time (typically 400 s) than that at the ecliptic poles ( 40,000 s). Besides this artifact, introduced by the geometry of the survey, each RASS field suffered from inconsistent exposure time variations. This is illustrated in Fig 1 where the pixels of each field registered a wide range of exposure times between 200 s and a little over 650 s.
2.1 Count Rate Vs HI Column Density
To simulate ROSAT observations of the AXPs in the 0.1 - 2.4 keV energy range, a two component model (Powerlaw + Blackbody) modulated by interstellar absorption is used. Since the XDINSs only exhibit thermal spectra with eV (Popov, 2006), only the blackbody component is implemented for these objects.
| (1) |
In the above, is the powerlaw normalization with units of photons, is the blackbody normalization with units of luminosity per square distance (; with the luminosity in units of and the distance in units of 10 kpc). With all the spectral parameters known the model has to be properly normalized for each object. Model normalizations for AXPs 4U 0142+61, 1E 1048.1-5937, and 1RXS J170849.0-400910 are obtained from Perna et al. (2001). Normalizations are not available for AXPs 1E 2259+586 and 1E 1841-045, so we use the percentage fluxes of both model components contributing to the total unabsorbed flux of the source (Patel et al., 2001; Morii et al., 2003). We then normalize the simulated absorbed fluxes to that recieved at the telescope to obtain the right count rate at the source specific . Since XSPEC only provides flux estimates, an ftools subprogram PIMMS is used to convert flux into ROSAT count rate. Figure 2 displays the log of the simulated count rate as a function of at a fiducial distance of 1 kpc for AXP 4U 0142+615 (actual distance of source is 3 kpc). In the figure, the exponential attenuation of the count rate with increasing column density is very much apparent. A sudden change in the slope at low column densities is due to the absorption of softer photons.
2.2 Maximum Probed Distance
The sensitivity limit of a telescope and the duration for which it was exposed to the sky determines how dim, or how far, an object could be detected. What is sought here is the distance to which a source with known luminosity could be detected by ROSAT before its flux drops below the detector sensitivity threshold. In this study, two detection criteria have been selected. First, a limiting count rate of 0.05 cts (criterion A) is chosen, for it conforms to the standards of the RASS bright source catalog (Voges et al., 1996). All five AXPs appear in the RASS-BSC and, thus, are well above the standardized detection threshold of a limiting count rate of , a detection likelihood222Detection likelihood is defined as where is the probability of source existence. of at least 15, and an accumulation of at least 15 source photons. Second, an exposure-time dependent minimum count rate (criterion B) is chosen since exposure time variation across each RASS field alters the detector threshold in the following way
| (2) |
with
| (3) |
In the above, is the signal to noise ratio, is the background count rate in the source detection cell, is the area of the detection cell which, in this study, was assumed to be the same as the source extraction area (typically ), is the area of the field of view of the telescope, is the fraction of source counts in the detection cell, is the minimum number of photons required to make a detection, and is the integrated exposure time. The value for is obtained from the all sky background count rate map in the 0.4 - 2.4 keV energy range.
Neutral Hydrogen Model
The amount of HI integrated along the line of sight limits the distance to which a source could be observed. Generally, the HI distribution takes the form of an exponentially decaying disk, both radially and vertically, away from the galactic center. In principle, it should be modified with a warp and an additive spiral arm component (Binney & Merrifield, 1998). For the purpose of this study, a simple exponentially varying distribution, of the form given below, is adopted from Foster & Routledge (2003).
| (4) |
with
| (5) | |||||
| (6) |
where , , , and . Notice in (6), the vertical scale height is a linear function of the galactocentric radius . Foster & Routledge (2003) argue that for lines of sight probing the very midplane of the galaxy, it is proper to adopt such a dependence as observations confirm a thickening of HI layer beyond the solar circle. In order to have a manageable resolution and to keep simulation times shorter, the whole sky is divided into 1440720 points over Right Ascension (RA) and Declination (DEC) spanning and , respectively, with intervals. Assuming a reasonable value for , the local number density of HI, and integrating (4) to a heliocentric distance , for a given galactic position (), yields the HI column density.
| (7) |
The inferred from (7) corresponds to a ROSAT count rate from the analysis in the previous section, illustrated by Fig 2. Until the count rate fails to satisfy the detection criteria, the integral in (7) is iterated with an increasing heliocentric distance. Finally, a maximum distance to which a given source, in a given direction, could be detected by ROSAT is obtained. This exercise is repeated for all twelve sources in the sample as well as for both count rate criteria.
2.3 Starcounts
In a magnitude limited sample, containing stars brighter than a given absolute magnitude , star counts are usually calculated by assuming some stellar luminosity function , and a model of stellar distribution in the galaxy. Consider a sample of stars with absolute magnitudes between and , lying in a specific direction (), in a given solid angle , within some distance . Then their total number is simply given by the following expression (Binney & Merrifield, 1998).
| (8) |
We adopt for the brightest stars and for the dimmest stars that yield neutron stars. This particular choice only affects the normalization of the star counts but not the derived birth rates which depend on the assumed value of . For , where and , and from the previous exercise, the integral in (8) yields the number of progenitor stars in the surveyed volume, towards a given direction.
Well tested models for the stellar luminosity function and the stellar number density are provided in a study done by Bahcall & Soneira (1980) (B&S, hereafter). Proposed by the authors, their model compares satisfactorily to observations made in seventeen different regions on the sky. Thus, this study adopts the B&S model with all the underlying assumptions. The B&S stellar luminosity function is based on starcounts from a subsample of stars with known distances and apparent magnitudes. It is derived as a fit to observations in the well studied apparent magnitude range of . For
| (9) |
For the number density, the B&S model assumes an exponential distribution of stars with all the quantities derived from observations in the solar neighborhood. Since stars are born out of hydrogen gas, the distribution of massive stars is found to very well trace HI in the galaxy, but with different scale heights.
| (10) |
In the above, represents the local stellar number density. B&S propose a radial scale length for the disk kpc based on a typical HI model, however, this study adopts the same scale length prescribed for HI distribution with kpc. For the vertical scale height, B&S rely on the estimates given by Schmidt (1959) which are compounded of many investigations, undertaken by various authors (see references therein), performed roughly by the middle of the century. Considering the availability of new and better data in the past couple of decades, it is wise to seek new estimates of the scale heights. Such a study was carried out by Reed (2000) where he finds a vertical scale height of pc for massive OB stars in the solar neighborhood.
The Gould Belt Enrichment
A local distribution of massive stars forms a ring like structure called the Gould Belt, after B. A. Gould who studied its orientation to the galactic disk in 1874. As mentioned previously, the seven XDINS which are relatively close by pc are associated with the Gould Belt. Grenier (2004), in her study of the Gould Belt structure, reports that the Sun happens to be crossing the belt which is inclined to the galactic midplane at an angle of with its center 104 pc away from the Sun towards the galactic longitude of . Furthermore, the disk extends to a distance from its center of pc and appears to be devoid of any massive stars within the inner pc.
Since the number density of massive stars belonging to the Gould belt is roughly twice that of the disk, this enriched component must be taken into account while conducting starcounts (Torra et al., 2000). Also, it should be noted that the Gould belt enrichment is important only for the nearby XDINS and does not significantly affect the starcounts in the case of the AXPs. This study assumes a constant surface density model for the Gould belt with a Gaussian form for the distribution above and below the disk.
| (11) |
Integrating (11) from to yields a relation for the scale height
| (12) |
With the assumption that most stars lie in the disk rather than away from it, the surface density can be expressed such that where is the thickness of the disk. There isn’t much consensus on what the thickness of the Gould Belt is, we adopt a value of pc (Grenier, 2004). Then, from (12) the scale height pc. The radial distance from the center of the Gould disk can be expressed as follows.
| (13) |
Following the observation by Torra et al. (2000) that , the Gould belt can be incorporated into (10) as such,
| (14) |
for .
2.4 Birthrate
To deduce the total number of AXPs or XDINSs in the Galaxy, the number of sample sources must be scaled accordingly. This scaling factor is the ratio of the total number of massive stars in the Galaxy to that found in the surveyed volume. The former is calculated for a heliocentric distance of kpc to reach the very edge of the Milky Way. Then, the number of massive stars found for each AXP/XDINS are averaged and then scaled.
| (15) |
where is the observed population of AXPs. and represent the number of massive stars in the probed volume for each source and the total number of massive stars in the whole Galaxy, respectively. Assuming that the populations of AXPs and XDINSs are in a steady state, then their birthrate is calculated using their spindown ages .
| (16) | |||||
| (17) |
3 Results and Discussion
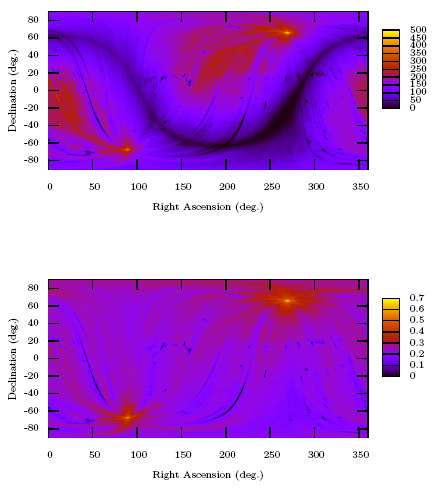
Maximum distance plots for AXP 4U 0142+61 and XDINS RBS 1223 are provided below. Fig 3 illustrates the maximum distances to which an object with the spectral characteristics similar to AXP 0142+61 and XDINS RBS 1223 could be detected for criterion B. Strikingly, the curve represents the disk of the Galaxy where the gas and dust limits the ability of the telescope to peer deep into the midplane. It is not surprising to note that the radiation from bright X-ray sources is primarily absorbed in the plane of the disk, whereas the light travels unimpeded immediately above and below it.
The knowledge of the maximum surveyed distance at each point on the sky enabled us to calculate the number of massive, OB stars in the probed volume. For example, starcounts for AXP 4U 0142+61 yielded 267,575 and 229,967 progenitor stars for limiting count rate A and B, respectively. Similarly, we found 175 progenitor stars for both A and B limiting count rates in the case of the XDINSs. Furthermore, integrating the models to the outer regions of the Galaxy, we found 523,196 massive OB stars without the Gould belt enrichment. Upon its addition, the total number increased to 523,694. The final results of this exercise are provided in Table 1 with estimates of the population, and birthrates, for both classes of NSs. Also listed in the table are the population and birthrate statistics of SGRs calculated using (15) and (17) with the assumption of ; however, with so few objects, this value provides only an order-of-magnitude estimate.
| A | B | |
| (per century) | 0.20 | 0.22 |
| 12 | 14 | |
| (per century) | 2.1 | 2.1 |
| 22,932 | 22,932 | |
| (per century) | ||
| 3 |
Previously, many workers have tried to answer the question asked in this study, and a possible lower limit of 0.1 magnetars per century has been suggested (Kouveliotou et al., 1998; van Paradijs et al., 1995). This study finds the birthrate of magnetars to be 0.22 per century, an estimate that is in good agreement with the proposed lower limit. Essentially, this is the birthrate of active magnetars, in this case of active AXPs. If magnetars spend a large fraction of the time in quiescence and, consequently, evaded detection in the RASS, then the birthrate will be correspondingly larger. However, since the birthrate is only a factor of eight smaller than the galactic supernova rate (Reed, 2005), the duty fraction of these objects cannot be too small. In addition, from table 1 one will immediately be struck by the relatively small difference in birthrates between the AXPs and the SGRs. From this we infer like others (Zhang, 2003; Woods & Thompson, 2006) that it is possible that the AXPs represent a later evolutionary stage of the SGRs. Furthermore, the birthrate found in this study cannot be assumed as the upper limit with utmost certainty due to some of the factors described below.
Firstly, it can be argued that the model assumed for the distribution of HI in the galaxy may be too simplistic. It is very well known that our galaxy, being spiral in its morphology, has substantial density enhancements along the spiral arms. The existence of such a structure can’t be ignored, yet the model, for this study, has been kept deviod of it. Addition of the spiral structure in the HI model would act to increase the average sum as the volume will now be less than previously calculated, effectively, reducing the number of massive stars in the probed volume. Consequently, the birthrate estimate will be augmented. Nevertheless, it should be noted that the addition of the spiral arms must also increase the number of massive stars as these density enhancements are their likely birthplace. After weighing both arguments, one can probably conclude that the result won’t be affected considerably. As an example, a simple error analysis for the AXP birthrate, based on the counting error of the sample and a naive estimate of the error in the spindown ages , amounts to an uncertainty of per century. Similarly, we estimate an uncertainty of per century for the XDINSs’ birthrate.
Secondly, the form adopted for the distribution of massive stars in the Galaxy is similar to that of HI distribution with a radial scale height of 0.35. However, the vertical scale height was adopted from Reed’s (2000) model. In his estimate of the number of massive O3-B2 stars inside the solar radius, Reed gives a number of 200,000 stars (Reed, 2005). Scaling this number out to the radius of the Galaxy with 15 pc by , since most of these stars belong to a thin disk, yields a result of 700,000 massive stars. Comparing this number to what was obtained for the simple model assumed for this study, a conservative estimate of 523,196 falls short of Reed’s estimate. This discrepancy may cause a further reduction in the calculated birthrate.
Thirdly, Colpi et al. (2000) argue that the characteristic spindown ages of magnetars inferred from (16) may be larger than their true ages. The basis of their argument rests on the hypothesis that the magnetic fields, usually assumed to be constant, are decaying over time. If it is so, then a smaller characteristic age would give a larger birthrate. Analysis conducted upon fixing for this proposed discrepancy yields an AXP birthrate of 2 per century. Until the issue of the underlying mechanism for magnetar production is resolved, it wouldn’t be unwise to assume the characteristic spindown ages as the true ages of the pulsars.
This study finds the birthrate of XDINSs to be 2 per century. Unfortunately, this result was obtained while generalizing the characteristic age ( 1.7 Myr) of just two sources (RX J0720.4-3125 and RBS 1223; Kaplan & van Kerkwijk, 2005a, b) to that of the whole sample; furthermore Heyl & Kulkarni (1998) find cooling ages for these sources of about 0.5 Myr. For want of a better determination we have taken the mean of these values 1.1 Myr to be the typical age of these sources. Under these assumptions, the estimated birthrate is in excellent agreement to the value proposed by Popov et al. (2006) for both the XDINSs and the RRATSs.
After having obtained the population size estimates for both the AXPs and the XDINSs, it is now possible to find any evolutionary affiliation among the different classes of NSs, simply by comparison of these statistics. We find that there are as many as 2.8 times more AXPs than already observed in our galaxy. This corresponds to a population of 14 AXPs. Including the three SGRs, assuming that all of them are observable irrespective of their location, the total magnetar population amounts to 17 sources in the Galaxy. Similarly, we find that there are 22,000 XDINSs in our galaxy. Although the birthrate of XDINSs roughly matches the upper limit of that of the normal radio pulsars, the number of normal radio pulsars (70,000 - 120,000; Vranesevic et al., 2004) is larger than that of the XDINSs due to their larger typical ages. We find that the birthrate of the AXPs and SGRs falls short of the RRATSs (and XDINSs) so that they cannot account for the RRAT population unless there is a large population of transient AXPs, a similar conclusion to that found by Popov et al. (2006) in their analysis of magnetar, XDINS and RRAT birthrates.
On the other hand, the magnetar birthrate is in good accord with the HBRP birthrate of 0.2 per century, however, the magnetar population again falls short of the HBRP population of (Vranevsevic et al., 2007). This difference in population simply reuslts from the typically larger ages of the HBRPs relative to the AXPs. Considering other instances, such as the X-ray emission from many HBRPs, the discovery of radio emission from the transient AXP XTE J1810-197 (Camilo et al., 2006), and the comparability of spin periods between the two classes, place the HBRPs in a circle of suspicion for having some connection with the magnetars.
4 Recommendations
Recently, hard X-ray emission has been detected from three AXPs (4U 0142+61, 1E 1841-045, 1RXS J170849.0-400910) by INTEGRAL space telescope operating in the 15 keV - 10 MeV energy range (Gotz et al., 2006). Furthermore, an all sky survey, conducted by using the coded mask IBIS telescope on board INTEGRAL, has identified various high energy galactic sources, a few among them ( 42) are yet to be identified (Krivonos et al., 2007). Considering the results of this study and noting the possibility of detecting hard X-ray emission from the AXPs, as well as being highly optimistic, we would like to extend our speculation that some of the unidentified sources may be those AXPs that have evaded detection in the low energy regime.
5 Conclusion
According to this study, up to 22% of all supernovae explosions give birth to a magnetar. The small size of the magnetar population reflects their short lifespans during which these objects manifest themselves as being highly energetic sources in the Galaxy. The birthrates obtained while assuming decaying magnetic fields, as advocated by Colpi et al. (2000), exceed estimates of the supernova rate in the Galaxy (Reed, 2005), thus, this study resorts to constant fields. Further timing analysis is required to gain important insight into the characteristics of XDINSs as this has been successfully achieved for only two among the seven.
Acknowledgments
The Natural Sciences and Engineering Research Council of Canada, Canadian Foundation for Innovation and the British Columbia Knowledge Development Fund supported this work. Correspondence and requests for materials should be addressed to J.S.H. (heyl@phas.ubc.ca). This research has made use of NASA’s Astrophysics Data System Bibliographic Services
References
- Bahcall & Soneira (1980) Bahcall J. N., Soneira R. M., 1980, ApJ, Supplement, 44, 73
- Binney & Merrifield (1998) Binney J., Merrifield M., 1998, Galactic astronomy. Princeton University Press
- Camilo et al. (2006) Camilo F., Ransom S. M., Halpern J. P., Reynolds J., Helfand D. J., Zimmerman N., Sarkissian J., 2006, Nature, 442, 892
- Colpi et al. (2000) Colpi M., Geppert U., Page D., 2000, ApJ, Letters, 529, L29
- Duncan & Thompson (1992) Duncan R. C., Thompson C., 1992, ApJ, 392, L9
- Foster & Routledge (2003) Foster T., Routledge D., 2003, ApJ, 598, 1005
- Gavriil et al. (2002) Gavriil F. P., Kaspi V. M., Woods P. M., 2002, Nature, 419, 142
- Gonzalez et al. (2007) Gonzalez M. E., Kaspi V. M., Camilo F., Gaensler B. M., Pivovaroff M. J., 2007, APSS, 308, 89
- Gotz et al. (2006) Gotz D., Mereghetti S., Hurley K., 2006, astro-ph/0609404
- Grenier (2004) Grenier I. A., 2004, astro-ph/0409096
- Haberl (2004) Haberl F., 2004, Memorie della Societa Astronomica Italiana, 75, 454
- Haberl (2005) Haberl F., 2005, in Briel U. G., Sembay S., Read A., eds, 5 years of Science with XMM-Newton The Magnificent Seven: Nearby Isolated Neutron Stars with strong Magnetic Fields. pp 39–44
- Heyl & Kulkarni (1998) Heyl J. S., Kulkarni S. R., 1998, ApJ, Letters, 506, L61
- Hünsch et al. (1999) Hünsch M., Schmitt J. H. M. M., Sterzik M. F., Voges W., 1999, A&A, Supplement, 135, 319
- Kaplan & van Kerkwijk (2005a) Kaplan D. L., van Kerkwijk M. H., 2005a, ApJ, Letters, 628, L45
- Kaplan & van Kerkwijk (2005b) Kaplan D. L., van Kerkwijk M. H., 2005b, ApJ, Letters, 635, L65
- Kaspi et al. (2003) Kaspi V. M., Gavriil F. P., Woods P. M., Jensen J. B., Roberts M. S. E., Chakrabarty D., 2003, ApJ, Letters, 588, L93
- Kouveliotou et al. (1998) Kouveliotou C., Dieters S., Strohmayer T., van Paradijs J., Fishman G. J., Meegan C. A., Hurley K., Kommers J., Smith I., Frail D., Murakami T., 1998, Nature, 393, 235
- Krivonos et al. (2007) Krivonos R., Revnivtsev M., Lutovinov A., Sazonov S., Churazov E., Sunyaev R., 2007, astro-ph/0701836
- Lyne & Graham-Smith (2006) Lyne A. G., Graham-Smith F., 2006, Pulsar Astronomy. Cambridge University Press
- Mazets et al. (1979) Mazets E. P., Golenetskii S. V., Il’Inskii V. N., Panov V. N., Aptekar’ R. L., Gur’yan Y. A., Sokolov I. A., Sokolova Z. Y., Kharitonova T. V., 1979, Soviet Astronomy Letters, 5, 163
- McLaughlin et al. (2006) McLaughlin M. A., Lyne A. G., Lorimer D. R., Kramer M., Faulkner A. J., Manchester R. N., Cordes J. M., Camilo F., Possenti A., Stairs I. H., Hobbs G., D’Amico N., Burgay M., O’Brien J. T., 2006, Nature, 439, 817
- Mereghetti et al. (2002) Mereghetti S., Chiarlone L., Israel G. L., Stella L., 2002, in Becker W., Lesch H., Trümper J., eds, Neutron Stars, Pulsars, and Supernova Remnants The Anomalous X-ray Pulsars. pp 29–+
- Morii et al. (2003) Morii M., Sato R., Kataoka J., Kawai N., 2003, PASJ, 55, L45
- Patel et al. (2001) Patel S. K., Kouveliotou C., Woods P. M., Tennant A. F., Weisskopf M. C., Finger M. H., Göğüş E., van der Klis M., Belloni T., 2001, ApJ, Letters, 563, L45
- Perna et al. (2001) Perna R., Heyl J. S., Hernquist L. E., Juett A. M., Chakrabarty D., 2001, ApJ, 557, 18
- Popov (2006) Popov S. B., 2006, astro-ph/0610593
- Popov et al. (2003) Popov S. B., Colpi M., Prokhorov M. E., Treves A., Turolla R., 2003, A&A, 406, 111
- Popov et al. (2006) Popov S. B., Turolla R., Possenti A., 2006, MNRAS, 369, L23
- Reed (2000) Reed B. C., 2000, AJ, 120, 314
- Reed (2005) Reed B. C., 2005, Astronomical Journal, 130, 1652
- Schmidt (1959) Schmidt M., 1959, in Greenstein J. L., ed., IAU Symp. 10: The Hertzsprung-Russell Diagram Derivation of the initial luminosity function and the past rate of star formation. pp 99–+
- Terrell et al. (1980) Terrell J., Evans W. D., Klebesadel R. W., Laros J. G., 1980, Nature, 285, 383
- Thompson & Duncan (1996) Thompson C., Duncan R. C., 1996, ApJ, 473, 322
- Torra et al. (2000) Torra J., Fernández D., Figueras F., Comerón F., 2000, Ap&SS, 272, 109
- Treves et al. (2000) Treves A., Turolla R., Zane S., Colpi M., 2000, PASP, 112, 297
- van Paradijs et al. (1995) van Paradijs J., Taam R. E., van den Heuvel E. P. J., 1995, A&A, 299, L41+
- Voges et al. (1996) Voges W., Aschenbach B., Boller T., Brauninger H., Briel U., Burkert W., 1996, iaucirc, 6420, 1
- Vranesevic et al. (2004) Vranesevic N., Manchester R. N., Lorimer D. R., Hobbs G. B., Lyne A. G., Kramer M., Camilo F., Stairs I. H., Kaspi V. M., D’Amico N., Possenti A., Crawford F., Faulkner A. J., McLaughlin M. A., 2004, ApJ, Letters, 617, L139
- Vranevsevic et al. (2007) Vranevsevic N., Manchester R. N., Melrose D. B., 2007, astro-ph/0701106
- Woods & Thompson (2006) Woods P. M., Thompson C., 2006, Soft gamma repeaters and anomalous X-ray pulsars: magnetar candidates. Compact stellar X-ray sources. Edited by Walter Lewin & Michiel van der Klis. Cambridge Astrophysics Series, No. 39. Cambridge, UK: Cambridge University Press, ISBN 978-0-521-82659-4, ISBN 0-521-82659-4, DOI: 10.2277/0521826594, 2006, p. 547 - 586, pp 547–586
- Zhang (2003) Zhang B., 2003, in Cheng K. S., Leung K. C., Li T. P., eds, ASSL Vol. 298: Stellar Astrophysics - A Tribute to Helmut A. Abt Magnetars and pulsars: a missing link. pp 27–34
- Ziolkowski (2002) Ziolkowski J., 2002, Memorie della Societa Astronomica Italiana, 73, 300