The first detection of near-infrared CN bands in active galactic nuclei: signature of star formation
Abstract
We present the first detection of the near-infrared CN absorption band in the nuclear spectra of active galactic nuclei (AGN). This feature is a recent star formation tracer, being particularly strong in carbon stars. The equivalent width of the CN line correlates with that of the CO at 2.3 m as expected in stellar populations (SP) with ages between 0.2 and 2 Gyr. The presence of the 1.1m CN band in the spectra of the sources is taken as an unambiguous evidence of the presence of young/intermediate SP close to the central source of the AGN. Near-infrared bands can be powerful age indicators for star formation connected to AGN, the understanding of which is crucial in the context of galaxy formation and AGN feedback.
Subject headings:
galaxies: stellar content – galaxies: active – galaxies: nuclei1. Introduction
It is widely known that circumnuclear star formation is commonly detected in active galactic nuclei (AGN) (e.g. Sturm et al., 1999; Contini et al., 2002; Storchi-Bergmann et al., 2005; Shi et al., 2006). In fact, in the last years, increasing observational evidence has confirmed that nuclear/circumnuclear starbursts (SBs) coexists in objects harboring an AGN (e.g. Mizutani et al., 1994; Imanishi & Dudley, 2000; Imanishi, 2002; Rodríguez-Ardila & Viegas, 2003; Imanishi & Wada, 2004). For example, Storchi-Bergmann et al. (2000) in a study of a sample of 20 Seyfert 2 (Sy 2) galaxies find out that about 50% of the sources have young to intermediate-aged ( 1 Gyr) nuclear starbursts and that 30% of the galaxies display a recent burst of star formation (, results confirmed by Gonz lez-Delgado et al., 2001). Currently, it is thought that both the active nucleus and the starburst might be related to gas inflow, probably triggered by an axis-asymmetry perturbation like bars, mergers or tidal interactions (Shlosman et al., 1989, 1990; Maiolino et al., 1997; Knapen et al., 2000; Fathi et al., 2006). This gives support to the so-called AGN-starburst (AGN-SB) connection (Norman & Scoville, 1988; Terlevich et al., 1990; Heckman et al., 1997; Gonzalez-Delgado et al., 1998; Veilleux, 2000; Ferrarese & Merritt, 2000; Heckman, 2004). This connection, however, could be incidental, as many Seyferts do not show any evidence of starburst activity (e.g. Filippenko et al., 1993) and optical spectroscopic studies of large samples do not indicate that starburst are more common in Seyferts than in normal galaxies (Pogge, 1989). One difficulty in establishing the AGN-SB connection further is that tracing starbursts reliably is difficult (Oliva et al., 1995). In the NIR region, except for a few indicators such as the methods based on the CO(2-0) first overtone or the Br emission (e.g. Origlia et al., 1993; Oliva et al., 1995), the detection of spectral features allowing the identification and dating of young stellar populations (SP) in the inner few tens of parsecs of AGN remains difficult. To understand the physics of the above connection is particularly important for galaxy formation theories, as AGN activity is advocated as regulator of star formation in massive protogalaxies, the so-called AGN feedback phenomenon (Silk & Rees, 1998; Binney, 2004; Croton et al., 2006; Bower et al., 2006).
In this line of thought, the evolutionary population synthesis calculations presented by Maraston (2005, hereafter M05), by including empirical spectra of carbon and oxygen rich stars (Lancon & Wood, 2000), are able to foresee the presence of molecular features like CH, CN and C2. They arise in young/intermediate SP and their spectral signatures are particularly enhanced in the NIR. Of particular importance are the CN bands, which arise according to the models, from stars with ages in the range 0.32 Gyr and are attributed to stars in the thermally pulsing asymptotic giant branch (TP-AGB) phase. It means that their detection can be taken as an unambiguous signature of the presence of young/intermediate SP in a well-constrained age, signaling the occurrence of SB activity. In the optical, CN bands are common in the spectra of globular clusters (e.g. Smith et al., 1989; Cohen, 1999a, b; Smith & Briley, 2006) but have been rarely reported in AGN. To our knowledge, the object showing the presence of this feature is the Sy 2 galaxy NGC 7679, where Gu et al. (2001) report extremely weak optical CN4200 Å. However contrary to the NIR, optical CN reveals old SP rather than young/intermediate-age ones (e.g. Storchi-Bergmann et al., 2000). Here, we report the first observation of the 1.1m CN band predicted by the M05 models in a comprehensive sample of Seyfert galaxies, demonstrating the usefulness of the NIR spectral region as an important tool to investigate recent star formation episodes.
2. The data
The galaxy spectra chosen for this work are the ones presented by Riffel et al. (2006, hereafter RRP06). The NIR spectra were obtained at the NASA 3 m Infrared Telescope Facility (IRTF). The SpeX spectrograph (Rayner et al., 2003), was used in the short cross-dispersed mode. A 0.8”15” slit was employed giving a spectral resolution of 360 . For more details see RRP06. A rapid inspection to the left panels of Figs. 1 to 8 and Fig. 12 of RRP06 shows that a significant fraction of objects display a deep prominent broad absorption feature starting at 1.1m and extending up to 1.15m in some sources (see, for example, NGC 1097, NGC 1144 and NGC 1614). In other objects such as Mrk 1066, NGC 5953 and NGC 7714, it is considerably narrower but still deep and strong. Almost invariably, the galaxies displaying the 1.1m absorption also present strong CO 2.3m bands and a H-continuum dominated by several absorption lines. The CaT at 0.8 m is also prominent in these objects. Moreover, these sources were classified as Sy 2/SB except Mrk 334 and NGC 1097, considered by RRP06 as Sy 1. The invariably association with CO bands and the CaT triplet allowed us to consider that the 1.1 m absorption could indeed be associated to stellar population although no previous observational report of this feature were found in the literature.
Columns 2 and 3 of Table 1 list the names and AGN type, respectively, of the galaxies where a clear evidence of the 1.1m absorption was found.
| ID | Galaxy | Type | r | W | W |
|---|---|---|---|---|---|
| (pc)a | (mag) | (mag) | |||
| (1) | (2) | (3) | (4) | (5) | (6) |
| 1 | Mrk 334 | Sy1 | 340 | 0.0630.001 | 0.0470.003 |
| 2 | NGC 34 | SB/Sy2 | 230 | 0.0820.001 | 0.1170.001 |
| 3 | NGC 591 | Sy2 | 206 | 0.0550.001 | 0.0980.009 |
| 4 | Mrk 573 | Sy2 | 267 | 0.0460.002 | 0.0570.005 |
| 5 | NGC 1097 | Sy1 | 58 | 0.0190.002 | 0.0780.005 |
| 6 | NGC 1144 | Sy2 | 447 | 0.0620.002 | 0.0770.009 |
| 7 | Mrk 1066 | Sy2 | 186 | 0.0450.001 | 0.0970.007 |
| 8 | NGC 1614 | SB | 154 | 0.0850.002 | 0.1390.007 |
| 9 | NGC 2110 | Sy2 | 121 | 0.0660.001 | 0.0330.001 |
| 10 | NGC 3310 | SB | 56 | 0.0520.002 | 0.0800.009 |
| 11 | NGC 5929 | Sy2 | 193 | 0.0500.002 | 0.0820.009 |
| 12 | NGC 5953 | Sy2 | 165 | 0.0410.002 | 0.1040.002 |
| 13 | NGC 7682 | Sy2 | 179 | 0.0360.001 | 0.0790.009 |
| 14 | NGC 7714 | H II | 115 | 0.0810.002 | 0.0980.021 |
| aafootnotetext: Radius of the integrated region. |
3. Results
The association of the 1.1 m absorption with the CN molecule was evident after comparing our spectra with Fig. 15 of M05, where a grid of synthetic spectra that include the effects of TP-AGB stars is shown. In these models, the dominant feature in the interval 0.91.4 m is a strong absorption centred at 1.1 m and attributed to CN. Models that do not include the TP-AGB population do not display the absorption. The M05 models also show that the strength of the CN absorption is a function of age and metallicity (Fig. 15 of M05). Other features present in the templates are also easily recognized in our data, including the overall shape of the continuum emission and the CaT and CO bands, particularly in the SB galaxies.

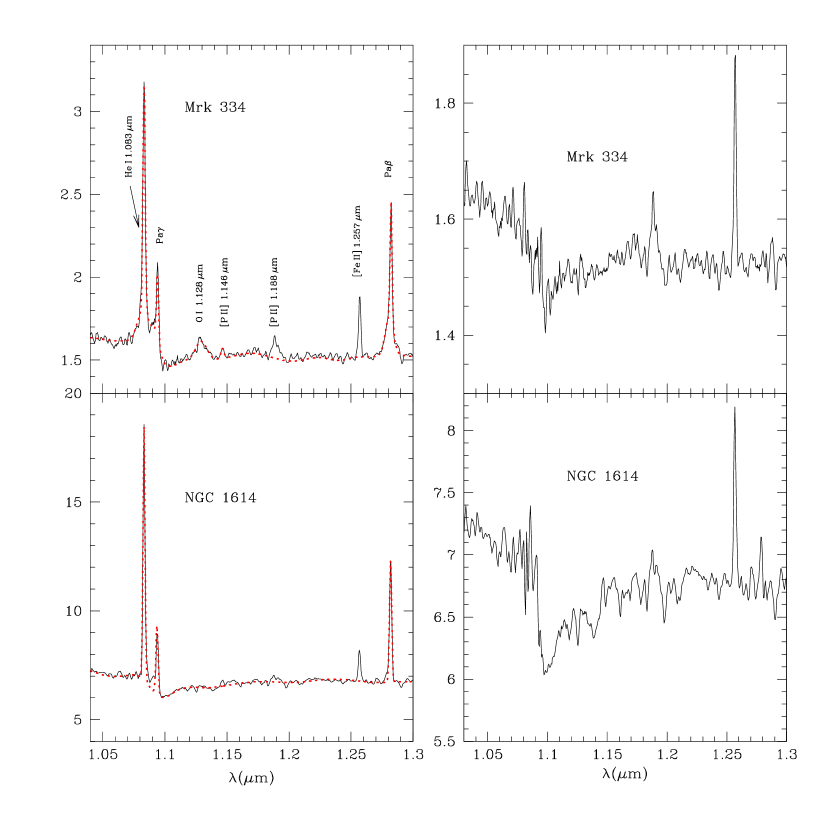
The upper left panel of Fig. 1 shows a comparison of a 1 Gyr and solar metallicity template of M05 with our data, confirming that the 1.1 m absorption is due to CN, associated to TP-AGB stars in the galaxies. No previous report of the CN1.1m band in extragalactic objects was made before. Our result points out to the presence of a significant young/intermediate stellar population, with ages between 0.3 and 2 Gyr in the objects listed in Tab. 1.
In order to properly quantify the strength of the CN 1.1m we need to subtract the emission lines of He i 1.0830m and Pa 1.0938 m that affect the band. Therefore, we have modelled these emission lines constraining the Pa width and flux to those of Pa 1.2820 m using the calculations by Hummer & Storey (1987) for their intrinsic line ratio values. For the He i, we have adjusted a gaussian to the emission line profile. It is a reliable approximation because the helium emission line is located near the blue end of the CN absorption band. As for the He i, in the spectrum of Mrk 334 we have adjusted a gaussian to the O i 1.1287m emission line. The LINER software (Pogge & Owen, 1993) was used for this purpose. A sample of the results of this process is presented in Fig. 2.
With a clear CN band, free of contamination of the emission lines, we proceed to measure the equivalent width (W) of the CN band. The continuum was linearly adjusted using the points between 1.0445m and 1.0580m as representative of the continuum at the left side of the CN band and for the right side we defined the points between 1.2160m and 1.2385m. The band widths were defined using the Maraston models, as being between 1.0780m and 1.1120m. We also include, for comparison, the W of the CO 2.2980 m line of the 2.3m CO band, measured from the galaxy spectra, taking as the line width the points 2.2860m and 2.3100 m for the band width and a continuum defined as a spline using points free from emission/absorption lines in the interval between 2.2350m and 2.3690m. The WCN and WCO measured values are listed in column 7 and 8 of Tab. 1. Here the LINER software was also used.
4. Discussion
The NIR CN absorption band is particularly enhanced in carbon stars, where there is residual carbon that is not binded with oxygen in CO molecules. As carbon stars are only produced after the third convective dredge-up along the TP-AGB phase (e.g. Iben & Renzini, 1983), their features are a clear indicator of SP rich in these stars. This constrains the age of such SP to be within the narrow range 0.3 to 2 Gyr (M05).
In order to check if our observations are actually consistent with this claim, we compare the observed strength of CN and CO with the Maraston’s model predictions. Note that the CO alone would not be a useful age indicator because this band is not only strong in TP-AGB stars or red-supergiants, but also in old RGB stars (e.g. Ivanov et al., 2000; Imanishi & Alonso-Herrero, 2004). Fig. 3 plot the values of simple stellar populations (SSPs) with ages between 0.2 and 3 Gyr and metallicities from 1/50 to twice solar.
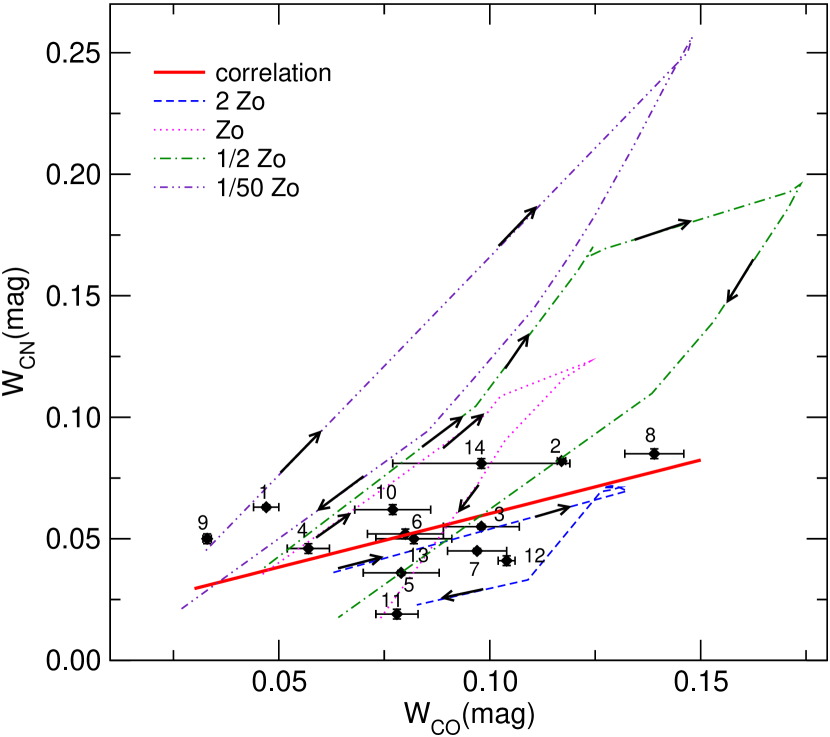
Fig. 3 confirms that the observed values are indeed consistent with the model predictions in this age range, and that the strengths of the two bands are correlated (R2= 0.66). The CO band is also present in TP-AGB spectra (cfr Fig. 16 of M05), which explains the correlation between the W of CN and CO. Interestingly, the data can be separated into two main groups according to the chemical composition. One group (NGC 34, Mrk 573, NGC 1144, NGC 3310, NGC 7682 and NGC 7714) has the light dominated by stars with solar/half solar metallicity. A second group (NGC 591, NGC 1097, Mrk 1066, NGC 5929 and NGC 5953) harbors SP with high metallicity, and just two objects are consistent with low metallicity. A detailed analysis of the ages and metallicities of our sample is postponed to another paper (Riffel et al., in preparation).
Optical stellar population synthesis carried out by Raimann et al. (2003) in a sample of Seyfert galaxies, four of them common to our sample (Mrk 573, Mrk 1066, NGC 2110 and NGC 5929) reveals that old population (10 Gyr) dominates the inner few hundred parsecs. The integrated regions of our NIR spectra are similar to that of Raimann et al. (2003). As shown by our results, for these same objects the NIR spectra display unambiguous signature of young/intermediate SP with ages between 0.3 and 2 Gyr. It means that the J-band provides complementary information not detected in the optical. An additional advantage of the CN is that it is located near the center of the -band allowing its observation in a wide range of redshifts (). The CO band instead is located near the red end of the K-band thereby allowing only observations of sources with redshifts smaller than 0.03.
5. Final Remarks
We present the first detection of the CN band in the inner 300 pc of an AGN. The presence of the CN at 1.1m in the spectrum can be taken as an unambiguous evidence of recent star formation, in particular it is associated with the presence of bright carbon stars. We have compared the observed values with predictions of SP including the contribution of carbon stars. We find a nice consistency of observed and predicted values for ages around 1 Gyr. This supports the claim that the NIR CN band is suggestive of young/intermediate age SP. Its use as age indicator is particularly adapt to AGN-hosts, where dust reddening can complicate seriously the use of optical bands. Moreover, since these molecules are enhanced in SP spanning a narrow age range, their detection is relatively robust against the age/metallicity degeneracy.
References
- Binney (2004) Binney, J. 2004, MNRAS, 347, 1093.
- Bower et al. (2006) Bower, R. G.; Benson, A. J.; Malbon, R.; Helly, J. C.; Frenk, C. S.; Baugh, C. M.; Cole, S.; Lacey, C. G., 2006, MNRAS, 370, 645.
- Cohen (1999a) Cohen, J. G., 1999, AJ, 117, 2434.
- Cohen (1999b) Cohen, J. G., 1999, AJ, 117, 2428.
- Contini et al. (2002) Contini, M., Radovich, M., Rafanelli, P., Richter, G. M., 2002, ApJ, 572, 124.
- Croton et al. (2006) Croton, Darren J.; Springel, Volker; White, Simon D. M.; De Lucia, G.; Frenk, C. S.; Gao, L.; Jenkins, A.; Kauffmann, G.; Navarro, J. F.; Yoshida, N., 2006, MNRAS, 365, 11.
- Fathi et al. (2006) Fathi, K., Storchi-Bergmann, T., Riffel, R. A., Winge, C., Axon, D. J., Robinson, A., Capetti, A., Marconi, A., 2006, ApJ, 641, 25.
- Filippenko et al. (1993) Filippenko, A. V., Ho, L. C., Sargent, W. L. W., 1993, ApJ, 410, 75.
- Ferrarese & Merritt (2000) Ferrarese, L., & Merritt, D., 2000, ApJ, 539, L9
- Gonzalez-Delgado et al. (1998) Gonzalez Delgado R.M., Heckman T., Leitherer C., Meurer G., Krolik J., Wilson A.S., Kinney A., Koratkar A., 1998, ApJ, 505, 174.
- Gonz lez-Delgado et al. (2001) Gonz lez-Delgado, R. M., Heckman, T. & Leitherer, C., 2001, ApJ, 546, 845
- Gu et al. (2001) Gu, Q. S.; Huang, J. H.; de Diego, J. A.; Dultzin-Hacyan, D.; Lei, S. J.; Benitez, E., 2001, A&A, 374, 932.
- Heckman et al. (1997) Heckman T.M., Gonzalez-Delgado R.M., Leitherer C., Meurer G.R., Krolik J., Wilson A.S., Koratkar A., Kinney A., 1997, ApJ, 482, 114.
- Heckman (2004) Heckman, T. M., 2004, cbhg.symp, 358.
- Hummer & Storey (1987) Hummer, D. G., & Storey, P. J. 1987, MNRAS, 224, 801
- Iben & Renzini (1983) Iben & Renzini 1983, ARA&A, 21, 271.
- Imanishi & Dudley (2000) Imanishi, M., Dudley, C. C., 2000, ApJ, 545, 701.
- Imanishi (2002) Imanishi, M., 2002, ApJ, 569, 44.
- Imanishi & Alonso-Herrero (2004) Imanishi, M.; Alonso-Herrero, A., 2004, ApJ, 614, 122.
- Imanishi & Wada (2004) Imanishi, M. & Wada, K., 2004, ApJ, 617, 214.
- Ivanov et al. (2000) Ivanov, V. D.; Rieke, G. H.; Groppi, C. E.; Alonso-Herrero, A.; Rieke, M. J.; Engelbracht, C. W., 2000, ApJ, 545, 190.
- Knapen et al. (2000) Knapen, J. H.; Shlosman, I. & Peletier, R. F., 2000, ApJ, 529, 93.
- Lancon & Wood (2000) Lancon & Wood 2000, A&AS, 146, 217.
- Maiolino et al. (1997) Maiolino, R., Ruiz, M., Rieke, G. H., Papadopoulos, P., 1997, ApJ, 485, 552.
- Maraston (2005) Maraston, C., 2005, MNRAS, 362, 799. M05
- Mizutani et al. (1994) Mizutani, K., Suto, H., Maihara, T., 1994, ApJ, 421, 475
- Norman & Scoville (1988) Norman C., Scoville N., 1988, ApJ, 332, 124.
- Oliva et al. (1995) Oliva, E.; Origlia, L.; Kotilainen, J. K.; Moorwood, A. F. M., 1995, A&A, 301, 55.
- Origlia et al. (1993) Origlia, L.; Moorwood, A. F. M.; Oliva, E., 1993,A&A, 280, 536.
- Pogge (1989) Pogge, R. W., 1989, ApJS, 71, 433.
- Pogge & Owen (1993) Pogge, R. W., & Owen, J. M. 1993, OSU Internal Report 93-01
- Raimann et al. (2003) Raimann, D., Storchi-Bergmann, T., Gonz lez Delgado, R. M., Cid Fernandes, R., Heckman, T., Leitherer, C., Schmitt, H., 2003, MNRAS, 339, 772.
- Rayner et al. (2003) Rayner, J. T., Toomey, D. W., Onaka, P. M., Denault, A. J., Stahlberger, W. E., Vacca, W. D., Cushing, M. C., & Wang, S. 2003, PASP, 155, 362
- Riffel et al. (2006) Riffel, R.; Rodríguez-Ardila, A.; Pastoriza, M. G., 2006, A&A 457, 61. RRP06
- Rodríguez-Ardila & Viegas (2003) Rodríguez-Ardila, A.; Viegas, S. M., 2003, MNRAS, 340, 33
- Shi et al. (2006) Shi, L.; Gu, Q. S. & Peng, Z. X., 2006, A&A, 450, 15.
- Shlosman et al. (1989) Shlosman, I., Frank, J. & Begelman, M. C., 1989, Natur, 338, 45.
- Shlosman et al. (1990) Shlosman, I., Begelman, M. C. & Frank, J., 1990, Natur, 345, 679.
- Silk & Rees (1998) Silk, J., Rees, M. J. 1998, A&A, 331,1
- Smith & Briley (2006) Smith, Graeme H.; Briley, Michael M., 2006, PASP, 118, 740.
- Smith et al. (1989) Smith, G. H., Bell, R. A. & Hesser, J. E., 1989, PASP, 101, 1083.
- Sturm et al. (1999) Sturm, E., et al., 1999, ApJ, 512, 197.
- Storchi-Bergmann et al. (2000) Storchi-Bergmann, T., Raimann, D., Bica, E. L. D., Fraquelli, H. A., 2000, ApJ, 544, 747
- Storchi-Bergmann et al. (2005) Storchi-Bergmann, T.; Nemmen, R. S.; Spinelli, P. F.; Eracleous, M.; Wilson, A. S.; Filippenko, A. V.; Livio, M., 2005, ApJ, 624L, 13.
- Terlevich et al. (1990) Terlevich E., Diaz A.I., Terlevich R., 1990, MNRAS, 242, 271.
- Veilleux (2000) Veilleux S., 2000, 2001, sgnf.conf, 88.