A wide-field kinematic survey for tidal tails around five globular clusters
Abstract
Using the AAOmega instrument of the Anglo-Australian Telescope, we have obtained medium-resolution near-infrared spectra of 10,500 stars in two-degree fields centered on the galactic globular clusters 47 Tuc, NGC 288, M12, M30 and M55. Radial velocities and equivalent widths of the infrared Ca II triplet lines have been determined to constrain cluster membership, which in turn has been used to study the angular extent of the clusters. From the analysis of 140–1000 member stars in each cluster, we do not find extended structures that go beyond the tidal radii. For three cluster we estimate a 1% upper limit of extra-tidal red giant branch stars. We detect systemic rotation in 47 Tuc and M55.
Subject headings:
globular clusters – Galaxy: kinematics and dynamics – Galaxy: structure – Galaxy: halo1. Introduction
The present structure of our Galaxy is result of a complex dynamical evolution in space and time. Globular clusters (GCs) are excellent tracers of this evolution because they interact with the gravitational field of the Milky Way, which affects their internal dynamics (Meylan & Heggie 1997). When passing through the galactic disk or the bulge, tidal shocks occur and these can have dramatic effects on the cluster evolution (Gnedin et al. 1999, Dehnen et al. 2004). N-body simulations have shown that the resulting tidal tails may be used to trace the orbital paths of GCs, which in turn reveals information about the enclosed mass of the Galaxy (e.g., Combes et al. 1999; Capuzzo Dolcetta et al. 2005).
Recent star count surveys have revealed tidal tails stretching many degrees beyond the cluster tidal radius, for which the best cases include Palomar 5 and NGC 5466 (Odenkirchen et al. 2001, 2003; Belokurov et al. 2006; Grillmair & Johnson 2006). These tails are believed to be cluster stars that have escaped due to tidal shocking. A crucial ingredient in these discoveries was the statistics of stars: in order to detect a non-circular over-density around a cluster, one has to eliminate galactic field stars very carefully. Escaped cluster members are usually identified by their colours and apparent magnitudes, using optimal contrast filtering in the color-magnitude plane.
This approach, however effective in distant and unreddened clusters, cannot easily be used for nearby clusters that have strong galactic star contamination and/or heavy interstellar reddening. However, these clusters could play a very important role in constraining models of tidal disruption, because they represent the state of a GC immediately before/after a gravitational shock by passing through the disk. The recently commissioned AAOmega fiber-fed multi-object spectrograph (Sharp et al. 2006) on the 3.9m Anglo-Australian Telescope offers a unique possibility for measuring radial velocities with 1–2 km/s precision for up to 350–360 stars per exposure in two-degree field of view, which enables a spectroscopic distinction between field stars and GC members over several tidal radii. In this Letter we report on the first results of a such survey for five southern GCs.
2. Observations
The targets (Table 1) have been selected from the catalogue of Harris (1996), using the following criteria: (i) nearby, thus with low or moderate reddening; (ii) small tidal radius (20′), so that the two-degree field of the instrument covers an area that is several times across; (iii) large radial velocity compared to the galactic field, which allows membership identification. With telescope time granted in August 2006, the two best GCs were M55 and M30, both with very large radial velocities. We also consulted the tidal tail study of Leon et al. (2000), which resulted in adding NGC 288 to the targets. M12 was included because of the suggested severe tidal stripping (de Marchi et al. 2006), while 47 Tuc for its known systemic rotation (Meylan & Mayor 1986). Two of these objects, M55 and M12, lie outside the “surviving” boundaries of GCs in figs. 21-24 of Gnedin & Ostriker (1997), favouring the possibility of significant tidal tails.
The observations were carried out on six and a half clear nights, between August 12 and August 18, 2006, with typical seeing between 1.2′′ and 2.2′′. The data were taken with the D1700 grating that has been optimized for recording the Ca II infrared triplet region. The spectra range between 8350 Å and 8790 Å, with a resolving power of 10,500. Each cluster was observed with several field configurations, which were all centered on the cluster. For every configuration we exposed 60 to 90 minutes, giving signal-to-noise ratios 50 to 250.
Of the 392 fibers of the instrument, we used 30 for sky background measurements and 5 to 8 for guiding. Lists of target stars were prepared using the 2MASS point source catalog (Skrutskie et al. 2006). For M55, we selected stars that matched the color and magnitude range of the red giant branch. For M30 and NGC 288, we did not restrict the sample, while for 47 Tuc and M12 we selected the faint end of the red giant branch. The magnitudes of the selected stars fell between 8 mag and 15 mag. To minimize cross-talk of the fibers due to scattered light, each field configuration was limited to stars in a 3-mag wide range. For this, - and -band magnitudes were estimated from the 2MASS magnitudes, using a set of linear transformations , which was calibrated using equatorial standard stars from Landolt (1983, 1992), cross-identified with the 2MASS catalogue ( refers to the Johnson bands). These transformations gave a useful and robust relation between Landolt and 2MASS, with the r.m.s. of the fits about 0.1 mag or less.
The spectra were reduced using the standard 2dF data reduction pipeline that extracts the wavelength calibrated spectra automatically. We performed continuum normalization separately and cleaned the strongest skylines that had residuals left, using linear interpolation of the surrounding continuum.
| Cluster | d | ||||
|---|---|---|---|---|---|
| (kpc) | (km/s) | (′) | |||
| NGC 104 (47 Tuc) | 4.5 | 0.76 | 18.7 | 42.9 | 2.03 |
| NGC 288 | 8.8 | 1.24 | 46.6 | 12.9 | 0.96 |
| NGC 6218 (M12) | 4.9 | 1.48 | 42.2 | 17.6 | 1.39 |
| NGC 6809 (M55) | 5.3 | 1.81 | 174.8 | 16.3 | 0.76 |
| NGC 7099 (M30) | 8.0 | 2.12 | 181.9 | 18.3 | 2.50c |
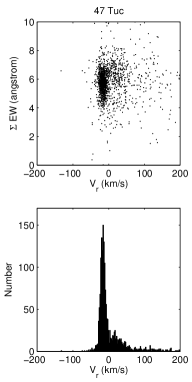
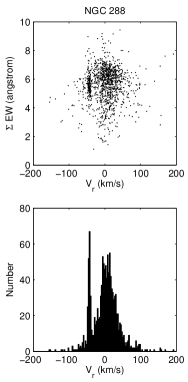
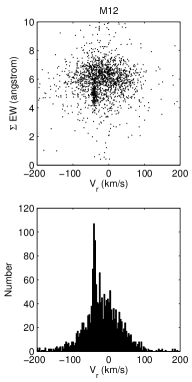
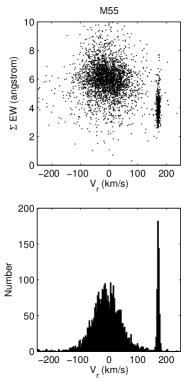
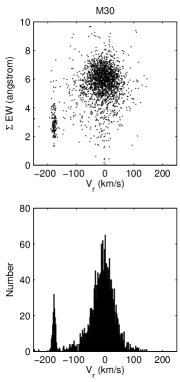
In total, we collected spectra for 10,500 stars, from which we determined two parameters for this paper. One is the equivalent width of the Ca II triplet lines at 8498, 8542 and 8662 Å. Following Cole et al. (2004), we fitted a sum of a Gaussian and a Lorentzian function to each line, which was then integrated to calculate the equivalent widths and their sum . This parameter is sensitive to surface gravity and metallicity, which can help constrain cluster membership. The fit also gave an initial radial velocity (RV) value, which was improved as follows. Using the extensive synthetic spectrum library of Munari et al. (2005), we selected best-fit synthetic spectra, degraded in resolution to match the observations, with fitting, treating RV as a fixed parameter given by the line-profile fitting. Each observed spectrum was then cross-correlated with the best-fit model, resulting in an improved RV that was usually within 5 km/s of the initial value and is believed to be accurate within 1-2 km/s.
3. Membership determination
We plot vs. RV in the upper panels of Fig. 1. In each panel the narrow clump corresponds to cluster members and the broader distribution comprises field stars. The clusters are ordered by decreasing metallicity from left to right and it is also noticeable how the mean equivalent width decreases with decreasing metallicity.
To measure the velocity ranges of the clusters, we analysed the velocity histograms shown in Fig. 1. For M55 and M30, the narrow peaks of the histograms give very well-defined velocity limits. For the other three clusters we determined the velocity positions of the sudden rises in the histogram and applied an edge-detection algorithm that is searching for the extrema of the first derivative. The results are listed in the 2nd and 3rd columns of Table 2 (with uncertainties of about 1 km/s) and their straight averages agree within 1-2 km/s with the catalogued GC RVs (Table 1). We also experimented with fitting a sum of a Gaussian and a low-order polynomial background to measure the velocity centroid and dispersion of the clusters but found that Gaussians provided poor fits.
Using the determined velocity limits, we defined the core samples of candidate members, i.e. stars with . However, it is obvious from the upper panels in Fig. 1 that even for M55 and M30, there is contamination from the field. We estimate the extent of this contamination with the following simple analysis.

In Table 2, represents the total number of observed stars in each field, while the core samples contain objects. The question is how many of them have only by chance the same velocity as the cluster. To answer this, we removed the cluster peak from the histogram and fitted a smooth, low-order polynomial over 50 km/s. Summing up the fitted function through the cluster peak gave us an estimated number of contaminating field stars with an uncertainty of about 6-8%. We also counted the number of stars in the core samples that are located outside the tidal radius ( in Table 2). This number was multiplied by () to take the missing area inside the tidal radius into account (60′ is the field radius). The resulting number, , gives another estimate of the field stars in the core sample.
| Cluster | |||||||
|---|---|---|---|---|---|---|---|
| 47 Tuc | 32 | 0 | 1696 | 1149 | 171 | 70 | 140 |
| NGC 288 | 51 | 38 | 1219 | 179 | 30 | 33 | 35 |
| M12 | 52 | 31 | 1780 | 407 | 200 | 175 | 192 |
| M55 | 160 | 182 | 3571 | 501 | 8 | 7 | 8 |
| M30 | 195 | 165 | 2240 | 154 | 7 | 4 | 5 |
The good agreement between and in most cases suggests that stars outside the tidal radii belong to the galactic field only. The largest difference was found for 47 Tuc, but its tidal radius covers over 2/3 of the whole field, so that the few stars outside do not provide an accurate estimate of the total contamination.
4. Celestial distribution of member stars
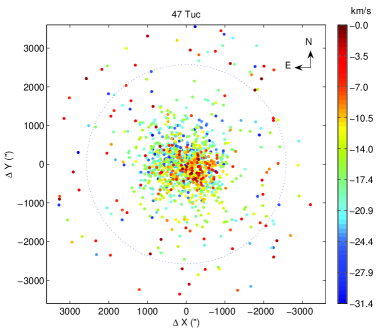
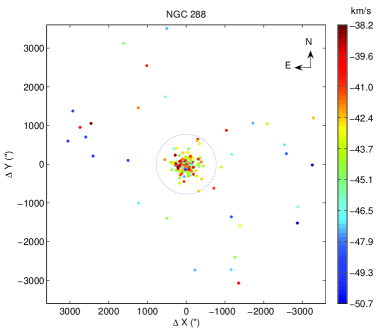
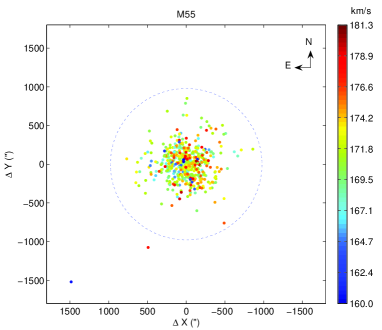
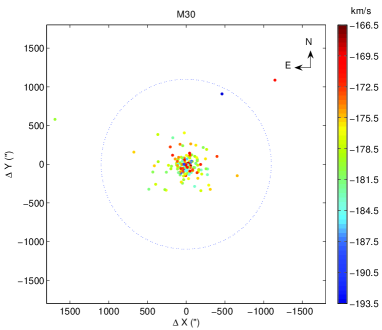
Figs. 2-3 show the positions of the stars in the core samples, color coded by the individual values (Fig. 2) and RVs (Fig. 3). For 47 Tuc, NGC 288 and M12 we show the full two-degree fields of view, while M55 and M30 are zoomed into the central one-degree field. The only evidence for non-isotropic distribution is found for NGC 288, where we see a NE-SW elongation that agrees with the reported tidal tails in the literature (Grillmair et al. 1995; Leon et al. 2000). However, the RVs outside the tidal radius do not show a coherent gradient in any direction, although stars in leading and trailing tails are expected to have systematic velocity shifts with opposite signs of a few km/s (Dehnen et al. 2004). On the other hand, there is a slight excess of stars outside the tidal radius, represented by the difference . Being positive only for NGC 288, this excess may support the existence of the reported tidal tails. To find a more conclusive result, we will use spectroscopic metallicities to secure membership identification for extra-tidal stars in a future study. For M12, the distribution of across the field marks the cluster clearly confined to the tidal radius.
Lauchner et al. (2006) discussed the relation between core concentration and tidal tails, showing that clusters with lower concentration parameter are more likely to have significant extra-tidal debris, and that the cluster concentration is a good predictor of the presence of significant tidal tails. In our sample, M55 and NGC 288 have very similarly low concentration than clusters with detected tidal tails (Pal 5, NGC 5466, NGC 5053), and yet neither of them has produced a positive detection.
To characterize the limits of our non-detections, we compared the cumulative -magnitude distributions of the observed stars with the whole two-degree 2MASS fields for M55, M30 and NGC 288. For M30, we observed 87% of all stars in the field brighter than 13.40 mag, which is 4.7 mag fainter than the tip of the AGB. For NGC 288, 82% of stars brighter than 13.55 mag were observed (the tip of the AGB plus 5.0 mag). This means we can safely exclude the presence of tidal debris that contains 1% or more of the red giant branch stars in the clusters. For M55, the numbers show that 50% of all stars brighter than 12.9 mag that match the color-magnitude diagram of the cluster were observed. With almost 500 members captured, 1% debris that contains red giant branch stars would have produced two or three clear detections. This can be firmly excluded considering the large values of the seven extra-tidal stars around M55 (5.5–7.7Å). We therefore conclude that the concentration parameter has a much weaker predictive power than suggested by Lauchner et al. (2006).
To further search for any putative tidal debris, a matched-filter analysis was undertaken for each of the GC systems (Rockosi et al. 2002). Stars were selected in the range and and, for each GC, a background colour-magnitude distribution was constructed by considering stars in an annulus of arcmins. The colour-magnitude distribution was also constructed using stars within the central 3.5 arcmins. The distributions were binned and smoothed to make them continuous, and subtracting a scaled outer distribution from the inner distribution clearly displayed the colour-magnitude sequence of the cluster itself. The cluster and background distributions were normalized and the matched-filter analysis was performed on a grid of in a box of 40 arcmins on a side, centred on each cluster. Each point of the grid represented the centre of a box of arcmin for an initial analysis, and arcmin for a secondary analysis, with the matched-filter analysis revealing what number of the stars in that region probably belong to the cluster. However, while clearly revealing the main body of each cluster, the analysis uncovered no significant substructure that could be interpreted as coherent tidal debris.
5. Future work
Our spectra form an excellent database for studying the structure and evolution of the clusters. Fig. 3 shows several important features that will help us to model their internal dynamics. Firstly, two clusters, 47 Tuc and M55, are characterized by large-scale asymmetry in velocity distribution that can be interpreted in terms of systemic rotation. A preliminary analysis of stellar velocities as function of position angle inferred a rotational velocity of 61 km/s and 31 km/s for 47 Tuc and M55, respectively, of which the 47 Tuc result is in excellent agreement with the 6.5 km/s obtained by Meylan & Mayor (1986). The influence of rotation on dynamical evolution may be significant, thus measuring it gives important clues on realistic models (Combes et al. 1999). Our data are the first to show clear signs of rotation for M55. Secondly, all five clusters are characterized by large velocity dispersions in the center (blue and red dots sitting next to each other) that gradually goes down at the edge (green belts of stars halfway to the tidal radii in Fig. 3). Thirdly, we do not see any evidence for increasing dispersion at large radii that would indicate strong tidal heating by the external gravitational field (Drukier et al. 1998), the presence of surrounding dark halo (Carraro & Lia 2000) or a breakdown of the Newtonian dynamics in the weak acceleration regime (Scarpa et al. 2007). We plan to test these theories in a future investigation.
References
- (1) Belokurov, V., et al. 2006, ApJ, 637, L29
- (2) Capuzzo Dolcetta, R., Di Matteo, P., & Miocchi, P., 2005, AJ, 129, 1906
- (3) Carraro, G., & Lia, C., 2000, A&A, 357, 977
- (4) Cole, A.A., et al., 2004, MNRAS, 347, 367
- (5) Combes, F., Leon, S., & Meylan, G., 1999, A&A, 352, 149
- (6) Dehnen, W., et al., 2004, AJ, 127, 2753
- (7) di Marchi, G., Pulone, L., & Paresce, F., 2006, A&A, 449, 161
- (8) Drukier, G.A., et al., 1998, AJ, 115, 708
- (9) Gnedin, O.Y., & Ostriker, J.P., 1997, ApJ, 474, 223
- (10) Gnedin, O.Y., Lee, H.M., & Ostriker, J.P., 1999, ApJ, 522, 935
- (11) Grillmair, C.J., et al., 1995, AJ, 109, 2553
- (12) Grillmair, C.J., & Johnson, R., 2006, ApJ, 639, L17
- (13) Harris, W.E., 1996, AJ, 112, 1487
- (14) Landolt, A.U., 1983, AJ, 88, 439
- (15) Landolt, A.U., 1992, AJ, 104, 340
- (16) Lauchner, A., Powell, Jr., W.L., & Wilhelm, R., 2006, ApJ, 651, L33
- (17) Leon, S., Meylan, G., & Combes, F., 2000, A&A, 359, 907
- (18) Meylan, G., & Heggie, D.C., 1997, A&ARv, 8, 1
- (19) Meylan, G., & Mayor, M., 1986, A&A, 166, 122
- (20) Munari, U., et al., 2005, A&A, 442, 1127
- (21) Odenkirchen, M., et al., 2001, ApJ, 548, L165
- (22) Odenkirchen, M., et al., 2003, AJ, 126, 2385
- (23) Rockosi, C.M., et al., 2002, AJ, 124, 349
- (24) Scarpa, R., et al., 2007, A&A, 462, L9
- (25) Sharp, R., et al., 2006, SPIE Proc., Vol. 6269, 14
- (26) Skrutskie, M.F., et al., 2006, AJ, 131, 1163