The speed of the ‘bullet’ in the merging galaxy cluster 1E0657–56
Abstract
Deep Chandra exposures of the hot galaxy cluster 1E0657–56 have revealed a highly dynamical state of the system due to an ongoing merger with a massive subcluster. The system is observed shortly after the first core-passage of the infalling subcluster, which moves approximately in the plane of the sky and is preceded by a prominent bow shock with Mach number . The inferred shock velocity of has been commonly interpreted as the velocity of the ‘bullet’ subcluster itself. This velocity is unexpectedly high in the CDM cosmology, which may require non-trivial modifications in the dark sector such as additional long-range scalar forces if taken at face value. Here we present explicit hydrodynamical toy models of galaxy cluster mergers which very well reproduce the observed dynamical state of 1E0657–56 and the mass models inferred from gravitational lensing observations. However, despite a shock speed of , the subcluster’s mass centroid is moving only with in the rest frame of the system. The difference arises in part due to a gravitationally induced inflow velocity of the gas ahead of the shock towards the bullet, which amounts to for our assumed mass ratio of the merger. A second effect is that the shock front moves faster than the subcluster itself, enlarging the distance between the subcluster and the bow shock with time. We also discuss the expected location of the lensing mass peak relative to the hydrodynamical features of the flow, and show that their spatial separation depends sensitively on the relative concentrations and gas fractions of the merging clusters, in addition to being highly time dependent. A generic CDM collision model, where a bullet subcluster with concentration merges with a parent cluster with concentration on a zero-energy orbit, reproduces all the main observational features seen in 1E0657–56 with good accuracy, suggesting that 1E0657–56 is well in line with expectations from standard cosmological models. In theories with an additional “fifth” force in the dark sector, the bullet subcluster can be accelerated beyond the velocity reached in CDM, and the spatial offset between the X-ray peak and the mass centroid of the subcluster can be significantly enlarged. Our results stress the need for explicit hydrodynamical models for the proper interpretation of actively merging systems such as 1E0657–56.
Subject headings:
clusters: structure – clusters: x-ray observations – methods: numerical1. Introduction
The massive cluster of galaxies 1E0657–56 at offers a so-far unique setting for testing many aspects of our understanding of dark matter and baryonic physics. In this system, a massive sub-cluster (the ”bullet” with ) has fallen through the main cluster () on a trajectory nearly exactly in the plane of the sky (Markevitch et al., 2002; Barrena et al., 2002). The matter distribution and masses quoted above have been determined from weak and strong lensing studies (Clowe et al., 2004, 2006; Bradač et al., 2006). Fitting the large-field weak lensing data with two spherically symmetric NFW mass distributions leads to (D. Clowe, private communication) kpc, and kpc, , for the main and subcluster respectively, taking , , . The distribution of baryons in the diffuse intra-cluster medium (ICM) is obtained from Chandra X-ray observations (Markevitch, 2006). By fitting the discontinuity in the gas properties across the prominent bow shock preceding the gas bullet, the shock Mach number has been determined to be (Markevitch et al., 2002; Markevitch, 2006), which together with a measurement of the pre-shock temperature translates to an inferred shock velocity of (Markevitch, 2006). Note that the errors quoted in (Markevitch, 2006) were symmetrized and the central velocity rounded down; the values used here are the most accurate ones (M. Markevitch, private communication).
In previous work, it has been assumed that this shock velocity is equal to the subcluster’s relative velocity with respect to the parent cluster (Markevitch et al., 2002; Markevitch, 2006; Hayashi & White, 2006, among others). This velocity is much higher than naturally expected according to the CDM cosmology (Hayashi & White, 2006; Farrar & Rosen, 2006). Using the large cosmological Millennium simulation (Springel et al., 2005b), Hayashi & White (2006) have measured the distribution function of the velocity of the most massive dark matter substructure in massive clusters of galaxies, fitting the results with
| (1) |
where is the circular velocity of the parent at the virial radius, and gives the fraction of clusters with a most massive substructure moving faster than . Adopting for a shock velocity of (Markevitch et al., 2004) and for the virial velocity of the parent cluster (based on a mass model with , and ), Hayashi & White (2006) found a relative likelihood of for 1E0657–56, suggesting that the system, while rare, can be plausibly obtained in CDM.
However, as previously pointed out by Farrar & Rosen (2006) this estimate appears overly optimistic in light of the new improved data on 1E0657–56. This data has increased the shock velocity to , while the mass-estimate for has seen a downward revision by a factor of . The virial velocity that is normally associated with a mass (Navarro et al., 1996) is given by . Accounting for the revised lower mass estimates from gravitational lensing (Clowe et al., 2006; Bradač et al., 2006), goes down to at most at the cluster redshift of . This means that the critical ratio changes from 1.9 to 2.68, implying that the estimated likelihood of seeing a subcluster as fast as the bullet in 1E0657–56 is really only , based on Equation (1). Given the low abundance of clusters as massive as 1E0657–56, this is an exceedingly small probability which cannot be straightforwardly understood in CDM.
An attempt to estimate the relative velocity of the subcluster and main cluster when separated by 720 kpc, taking reasonable initial conditions and the measured mass distributions, finds a maximum relative velocity of about (Farrar & Rosen, 2006), suggesting the possible presence of an additional long-range force between dark matter concentrations if 4740 is the true relative velocity (see Farrar & Rosen, 2006, and references therein). The results of Hayashi & White (2006) and the conclusion to be drawn from Farrar & Rosen (2006) depend critically on the identification of the velocity of the dark-matter bullet with the observationally inferred shock velocity. Given the importance of a reliable determination of the bullet’s velocity, we here explore the relation between the true velocity of the dark matter subcluster and the properties of the shock in the gas distribution, using simplified ‘toy’ models of the collision to make the physics clear.
We briefly summarize our methodology in §2. An analyses of the hydrodynamical state of a best-matching merger simulation is given in §3, which illustrates in particular that a significant difference between the shock and bullet velocity is naturally expected. In §4 we consider slight variations of our default model and quantify in more detail the quality of the match to the observed 1E0657–56 system. This is followed with a discussion of the dependence on further model parameters in §5. In §6 we examine simulations that include a fifth force between dark matter particles. Finally, we conclude with a discussion in §7.
2. Numerical toy models for the bullet cluster
As our default model, we consider the collision of two isolated galaxy clusters at of mass and , respectively, both containing a universal baryon fraction of , consistent with the latest cosmological constraints from the WMAP 3rd-year data (Spergel et al., 2006). We take the clusters to be spherically symmetric, with the dark matter following an NFW-profile (Navarro et al., 1997), truncated at the virial radius, and the gas being in hydrostatic equilibrium with a small core in the center, but otherwise following the NFW profile as well. For the concentrations, we adopt the values and suggested by the mass fits of Clowe (2006, private communication). Assuming a conventional virial overdensity of 200 with respect to the critical density, and a Hubble constant of , the virial velocity and radius of the parent cluster are and , while those of the subcluster are and , respectively. Numerical realizations of these equilibrium clusters as N-body/SPH models are constructed with the techniques described in Springel et al. (2005a).
We assume that the clusters fall together from infinity on a zero-energy orbit, giving the infalling subcluster a velocity of in the center-of-mass frame, at the time when the virial radii first touch. This is also the time when we start our simulations. Note that all the absolute velocities we quote are relative to the center-of-mass frame, hence the parent cluster moves with at the start. The simulations themselves are evolved with a novel version of the cosmological smoothed particle hydrodynamics (SPH) code GADGET2 (Springel et al., 2001; Springel, 2005). In our standard simulations, we employ 4.4 million particles, equally divided between dark matter and gas, and with equal mass resolution for the incoming subcluster and the parent cluster. This results in a gas mass resolution of , and a dark matter resolution of . We adopt a gravitational softening length of , which roughly demarks our spatial resolution limit.
In our default calculation we consider a direct head-on encounter of the two clusters, making the problem effectively axially symmetric around the collision axis. The need to account for the non-linear response of the dark matter during the merger requires three-dimensional simulations nevertheless. We have also considered a number of simulations with a small amount of orbital angular momentum in the collision, measured by the minimum separation the clusters would attain at perihelion if they were point masses. Also, we considered variations of our initial conditions where the relative concentrations and gas fractions of the initial cluster models were altered, or where a fifth force between dark matter particles was included. Finally, for testing numerical convergence, we have also carried out selected simulations with 35.2 million particles, resulting in 8 times better mass resolution, and a 2 times better spatial resolution in each dimension.
Since the measured temperature profile across the shock is consistent with instant shock-heating of the electrons (Markevitch, 2006), we model the ICM as an ideal gas with an adiabatic index of . For simplicity, we neglect radiative cooling of the gas, and consequently also star formation and the stellar systems of the cluster galaxies. We also disregard magnetic fields, which could in principle play an important role in stabilizing cold front against fluid instabilities and thermal conduction (Ettori & Fabian, 2000; Vikhlinin et al., 2001b; Lyutikov, 2006). Our simulations are carried out in physical coordinates, ignoring the cosmological background expansion, the infall of other structures, and the accretion of diffuse matter. While our approach is much more restricted than fully self-consistent cosmological modeling, the short time required for completing the merger (of the order of a few Gyrs) should make it a reasonably good approximation. At the same time, the simplicity of the toy model makes the physical phenomena easier to identify, in particular with respect to the relation between observed shock properties and the underlying kinematics of the dark matter, which is our main interest here. We shall begin with the simplest of the toy models, and then explore how the conclusions change as the model is varied.
3. Results for the basic toy model
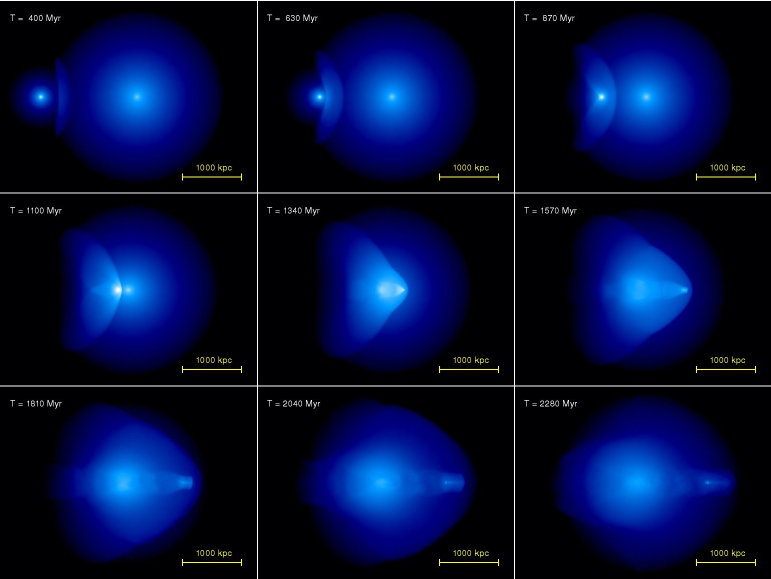
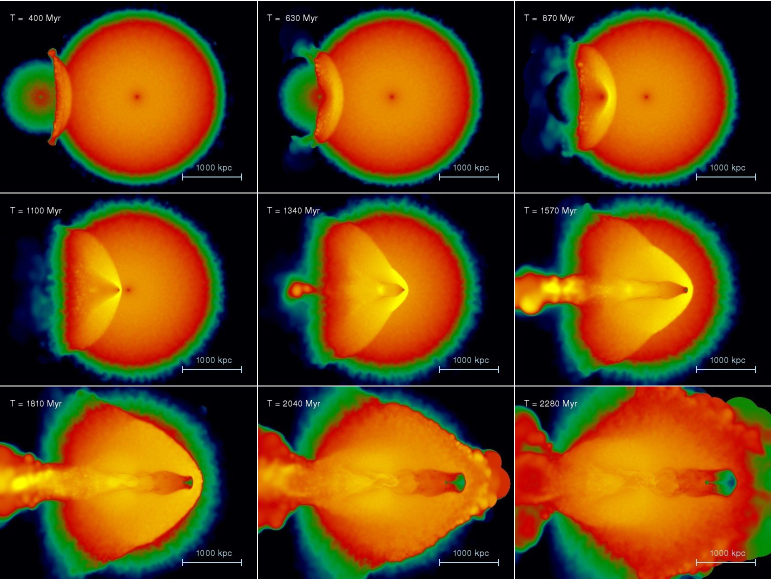
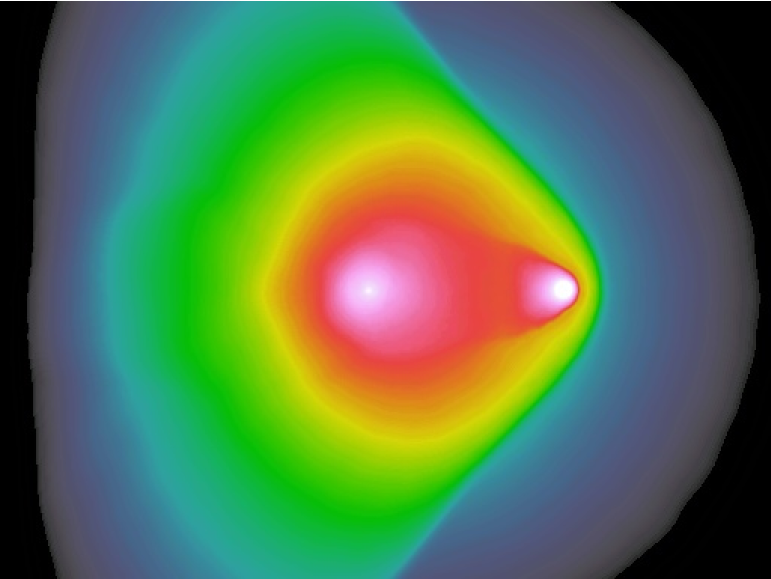
In Figure 1, we show the time evolution of our default simulation model in the form of maps of X-ray surface brightness and projected luminosity-weighted temperature111A video of the merger simulation is available for download at http://www.mpa-garching.mpg.de/volker/bullet. We only consider simple bremsstrahlung, with an X-ray volume emissivity , where and are the local gas density and temperature, respectively. The bullet cluster enters the parent at time from the left, and passes the core at around . The bullet is preceeded by a prominent bow shock, which develops a ‘bend’ during core passage, when the central region of the shock front speeds up. The compression of the central gas during core passage makes the centers of the parent and the bullet cluster very bright in X-rays for a few hundred Myrs. In addition, the bullet develops a prominent ’cold front’ (Vikhlinin et al., 2001a) after core passage, which can be seen as a sharp wedge-like ‘edge’ in the X-ray surface brightness. The temperature maps show the strong heating of the gas by the shock front, while the bullet itself is seen to be quite cold, revealing that the wedge-like edge of the bullet is really a cold front (see Markevitch & Vikhlinin, 2007, for a review). Note that the maps shown in Fig. 1 extend to substantially lower surface brightness levels than are observationally accessible.
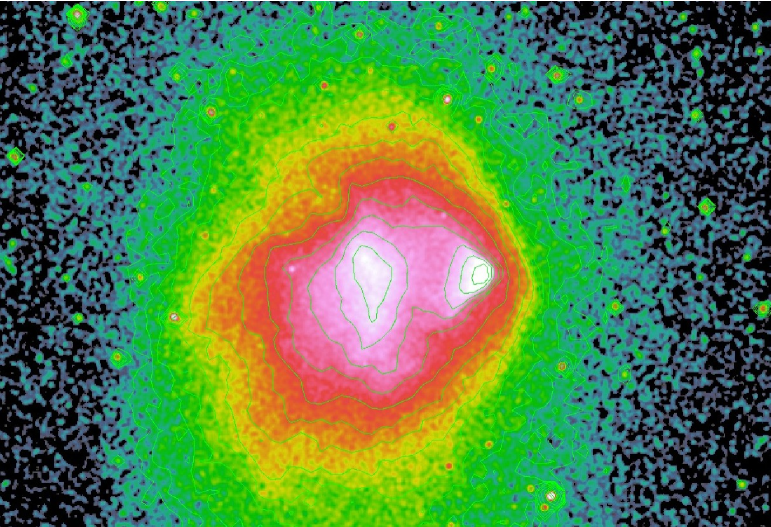
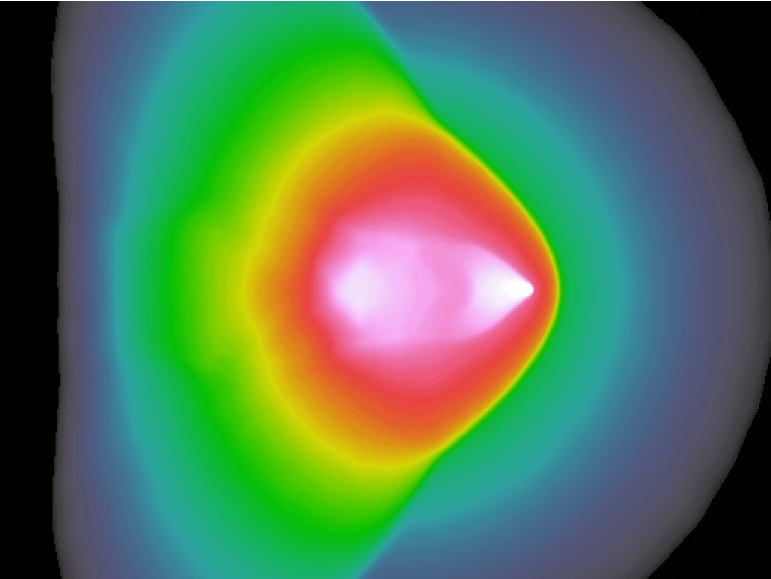
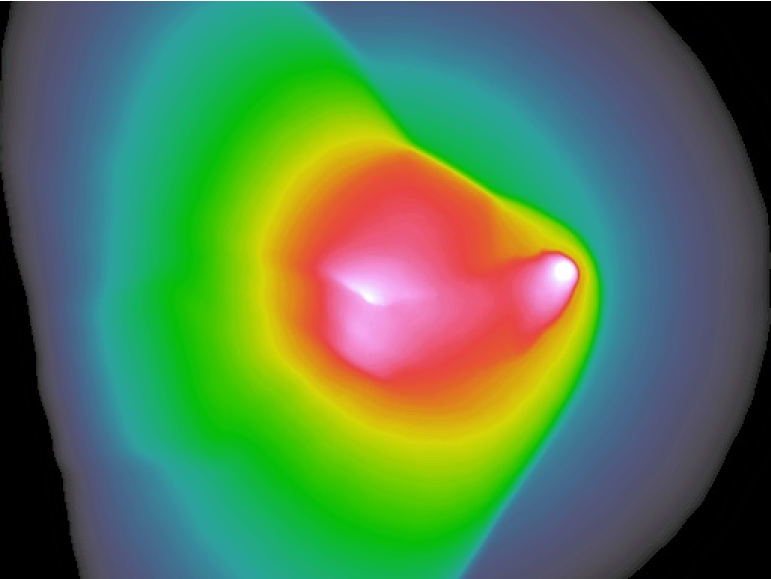
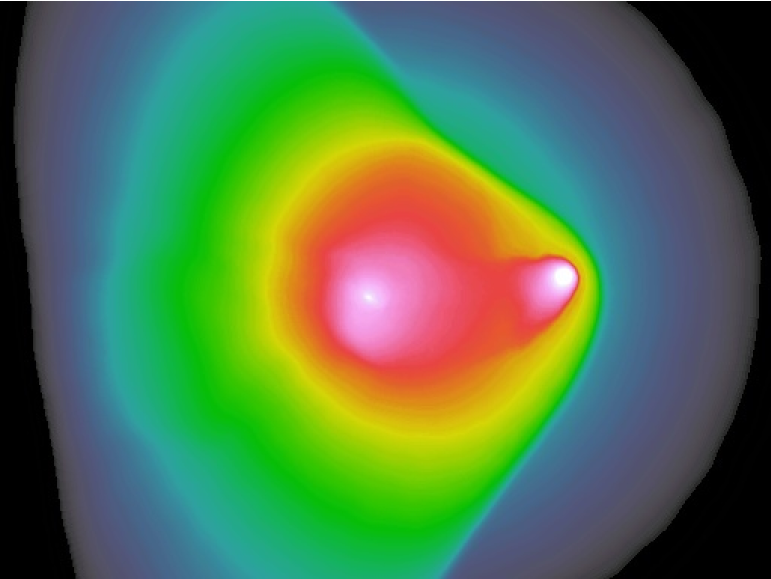
In Figure 2, we show an observed X-ray map of 1E0657–56 (based on data presented in Markevitch, 2006) and compare it to a map of the simulation drawn with a dynamic range that roughly matches that accessible in the observations. We selected a time that provides approximately the best match to the observed X-ray morphology, as will be discussed in more detail later. The simulation clearly shows a double peaked structure in the X-ray emission similar to that observed, with a wedge-like shape for the bullet that moves to the right, and with a prominent bow shock in front of the bullet. This broad agreement reconfirms the interpretation of 1E0657–56 as a merging system. We now turn to a more detailed analysis of the simulation results, in order to evaluate how well they can quantitatively reproduce the properties of the observed system.
3.1. The dynamical structure of the merging system
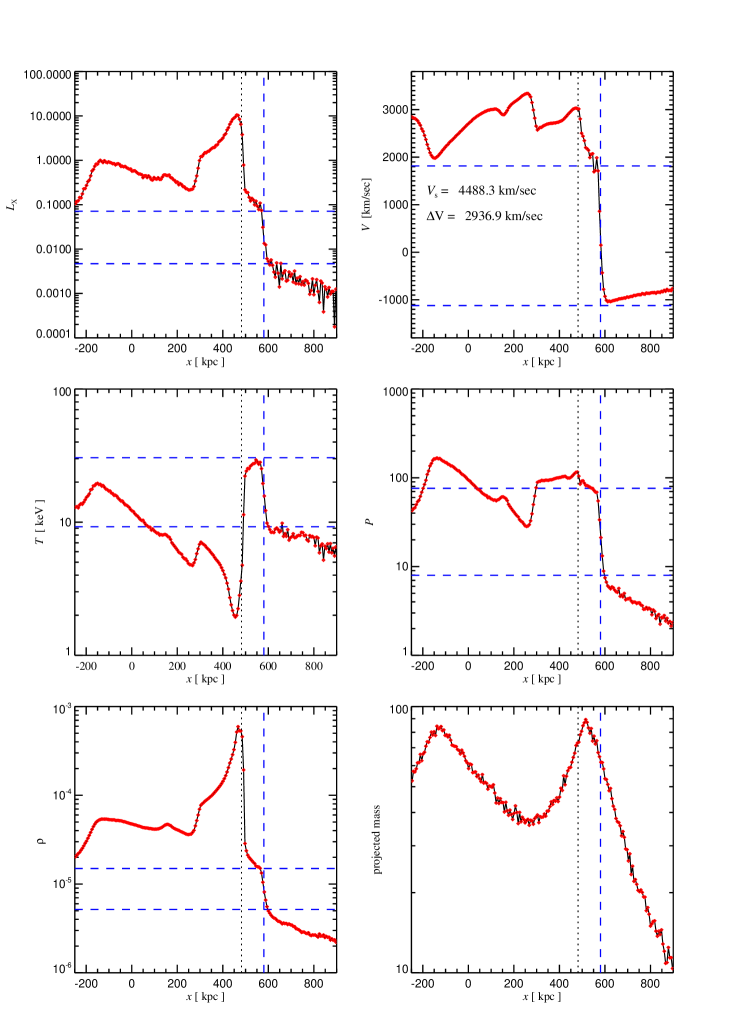
A much clearer understanding of the hydrodynamics involved is obtained by looking at profiles of the gas and the dark matter distribution along a line through the nose of the shock. This is done in Figure 3 for the local X-ray emissivity, gas velocity field, temperature, pressure, gas density, and total projected mass. In this figure at time (corresponding to the central panel in the time evolution of Fig. 1), we can clearly identify the location of the bow shock at , and a contact discontinuity at . The latter marks the edge of the bullet; behind it, the gas is quite dense and cold, and very bright in X-rays. The pressure is essentially continuous across this front.
At the bow shock, the density, velocity, pressure, temperature, and X-ray emissivity are all discontinuous (as is the specific entropy). The sizes of the corresponding jumps are consistently described by the Rankine-Hugoniot relations for an adopted Mach number of , as indicated in the panels of the figure. The preshock-temperature is , just what is observed, corresponding to a pre-shock soundspeed of . The inferred shock velocity is hence . Note that a slightly higher Mach number of 3.0 matches the numerical results still reasonably well, and would then in fact result in a shock velocity exactly equal to the value inferred from the most recent observational estimates (references). In any case, the value of is well inside the observational uncertainty.
We note that the opening angle of the Mach cone seen in our simulations is much wider than expected in the simple situation of a perturber moving with constant supersonic velocity in a homogeneous medium that is at rest. This is in part a result of the velocity structure of the upstream gas, which is not at rest, a point we shall return to later on. In addition, the speed of the bullet is not constant, and the temperature field is not strictly homogeneous. As a combined result of these complications, the opening angle of the bow shock cannot easily be used to obtain an independent measure of the strength of the shock.
3.2. The velocity of the bullet
An important point to note about Figure 3 is that the shock velocity itself does not give the expected jump in the velocity of the gas across the shock. The latter is only
| (2) |
as a result of the continuity equation. Here and give the gas densities in front of and behind the shock, and and are the corresponding velocities. If the latter are measured in the shock’s rest frame, we have , which leads together with the Rankine-Hugoniot jump condition for to Equation (2).
But perhaps the most noteworthy feature in Figure 3 is the fact that the velocity of the gaseous bullet, which is located at around , is not at all equal to the shock velocity , as has often been assumed. Furthermore, our results show that the mass centroid of the subcluster is in fact moving much slower; its velocity lies around , yet the inferred shock speed is . The difference originates primarily for two reasons:
-
1.
The pre-shock gas is not at rest. Instead, it falls towards the bullet, reaching nearly when it encounters the shock. This is because the gravity of the incoming bullet is felt already ahead of the shock front, unlike hydrodynamical forces. We shall discuss this point further below. For now we note that this means that the shock front moves only with a velocity in the rest-frame of the system.
-
2.
The subcluster’s mass centroid and the X-ray centroid are not moving as fast as the shock front itself, and are, in fact, increasingly falling behind. Note that the post-shock gas has only a velocity of relative to the pre-shock gas, and not the full speed of the shock. The bullet will hence experience significant braking by ram-pressure if it moves faster than in the rest-frame, which it does. This suggests that a difference between the speed of the bullet and the shock front may naturally arise, but the size of this effect is hard to estimate due to the time variability and the complicated geometry of the merger. But as we quantify below, a velocity difference between the subcluster’s mass centroid and the bow shock is indeed present and amounts to at the time of best match.
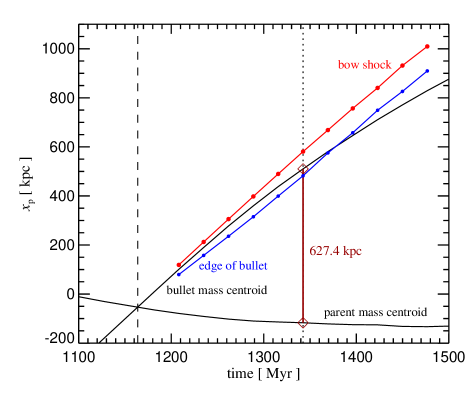
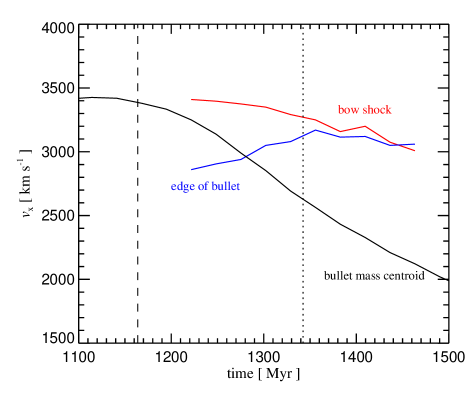
In Figure 4, we show the locations of the shock front, the edge of the bullet, and the mass centroids of parent and subcluster as a function of time, from a brief moment before core passage over a period of 400 Myr. Clearly seen is that the shock front moves faster than the mass centroid associated with the bullet. In fact, numerical differentiation of these curves shows that the shock front is moving with in the center-of-mass frame at time , while the mass centroid is moving with . The edge of the bullet stays closer to the shock front, however, only initially their distance grows to but then stays roughly constant. Given the pre-shock infall of of the gas, the velocity of the shock front in the rest-frame of the upstream gas is , consistent with the shock velocity inferred from the Rankine-Hugoniot jump conditions.
We can also see that the core passage has happened before the time displayed in Figure 3, at which point the mass peaks have a separation of . This is a bit smaller than the cited for the separation of the mass centroids of 1E0657–56, based on gravitational lensing analysis. However, just later, the distance grows to this level, with an unchanged shock strength, so that the time of best match using this measure could be defined as .
Comparing with the positions of the hydrodynamical features in Figure 4, we see that for the chosen simulation parameters the mass peak of the bullet lies slightly ahead of its X-ray edge at the time of best match, at which point it is in fact also quite close to the location of the shock front. While this is broadly consistent with the results from weak- and strong lensing analysis of 1E0657–56 (Clowe et al., 2004, 2006; Bradač et al., 2006), the size of the offset in this simulation is clearly smaller than inferred observationally. We note that this is also the case for the offset between the X-ray emission and mass peak associated with the parent cluster: those features are quite well aligned in our simulation model, unlike in the observations. However, we will consider a small variation of our default simulation model later on in §4 where a more accurate match to the observational data is obtained.
3.3. Gas infall towards the bullet
In the previous section we have seen that the upstream gas ahead of the bullet’s shock front is not at rest relative to the main parent cluster. Rather it is infalling towards the incoming bullet with a significant velocity. This effect contributes substantially to the large difference between the inferred shock velocity and the actual velocity of the infalling subcluster. Here want to examine more closely how this velocity arises.
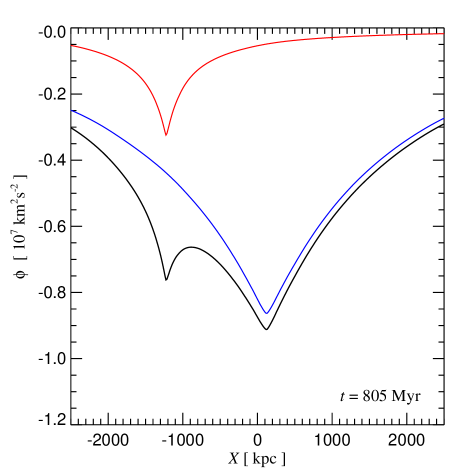
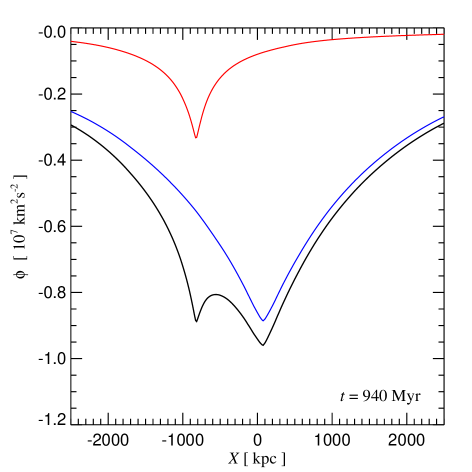
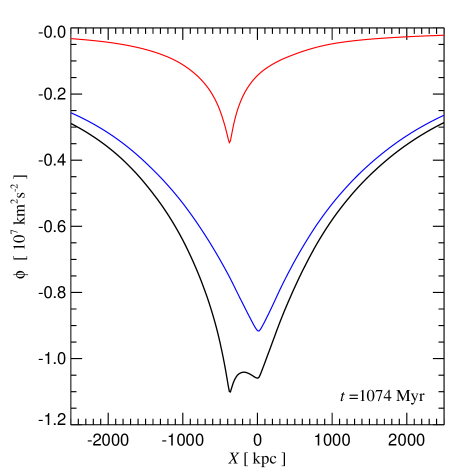
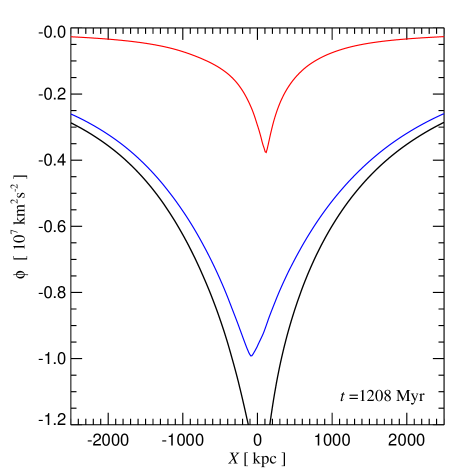
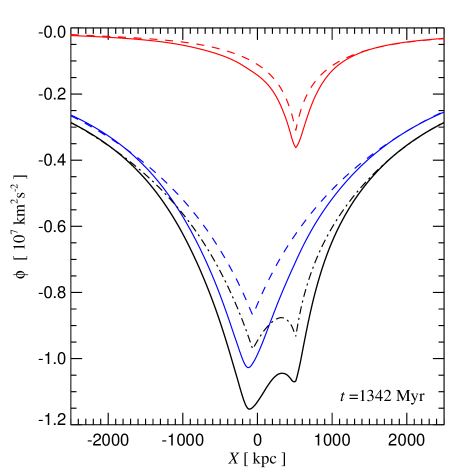
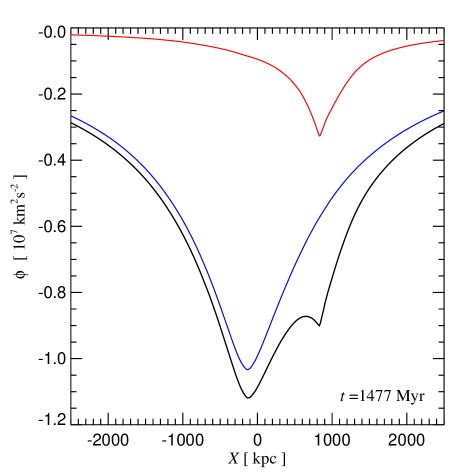
In Figure 5, we show the time evolution of the gravitational potential along the symmetry axes during the merger. Each panel shows the potential at a different time, both for the total mass and separately for the material that originally defines each of the two clusters before they start overlapping. In the early phases of the collision, the mass distribution of each of the clusters changes relatively little, such that the total potential is approximately given by translating the initial potentials of the two components, and summing them up. However, during core passage the summed potential changes rapidly in time, leading to a phase of violent relaxation that reshuffles the energies of individual dark matter particles. This irreversibly modifies the mass distributions of the involved components, and hence their potentials. Recall that in a static gravitational potential the specific energies of individual dark matter particles, , are constant along their orbits , but if the potential varies in time, their energies evolve at a rate , i.e. the particle energies simply change with the rate of change of the potential at their current location. It is precisely during core passage when the potential fluctuates on a very short timescale such that a widespread rearrangement of particle energies can occur.
We now relate this phenomenon to the large infall velocity we have found in the gas ahead of the shock. We argue that this occurs largely as a response to the change in the gravitational potential of the system induced during core passage. Consider to this end the panel at time 1340 Myr in Figure 5. In addition to the direct measurement of the total potential (solid lines), we have also included an estimate of the potential obtained by linearly translating the potentials of the two original mass components to the current positions of the mass centroids (dashed lines), and then adding them. In the resulting comparison, it is seen that the dynamically evolved potential has clearly become deeper during core passage relative to that expected for unaltered mass distributions in the two components. Note in particular that the total potential in the infall region of the gas ahead of the shock front has become deeper as well; this implies that the gas in this region is accelerated towards the shock considerably more strongly than predicted in a model where the dynamical response of the parent and bullet during core passage is neglected.
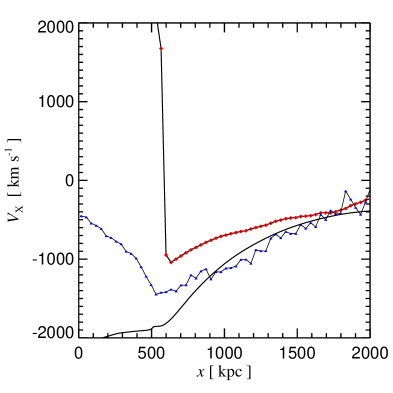
We can use the above measurement of the ‘excess change’ in the gravitational potential to obtain a rough estimate of the induced dark matter streaming velocity in the parent’s cluster material in the infall region ahead of the shock. To this end we invoke energy conservation for the radial streaming velocity of the dark matter, which at a given location should roughly increase as . This estimate neglects the fact that the particles really have a velocity distribution function, but should be good for an order of magnitude estimate. In Figure 6 we show the result, and compare it with the real dark matter streaming velocity measured in the simulation, and the mean gas velocity. We see that the above estimate matches the measurement quite well. The gas inflow velocity is somewhat lower than the induced dark matter streaming. This can be understood as a result of gas pressure effects that resist the adiabatic compression associated with the induced infall, and which are absent for the collisionless dark matter.
4. Improving the match to 1E0657–56
We now discuss in more detail the quality of the match of our default merger model to the observations of 1E0657–56, and in particular consider the sensitivity of our results to the assumed concentration of the parent cluster.
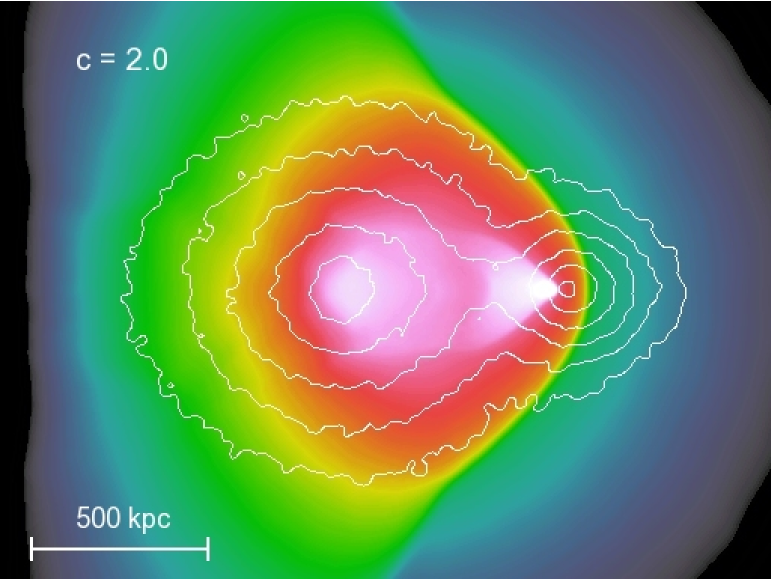
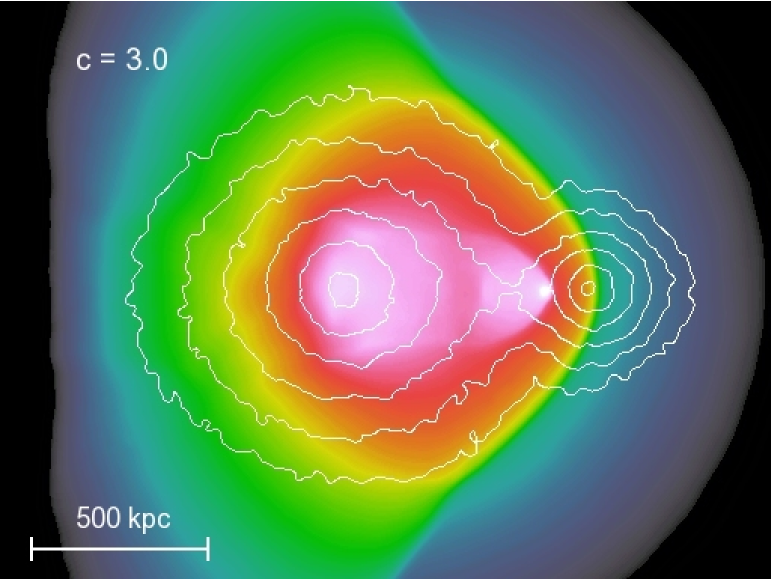
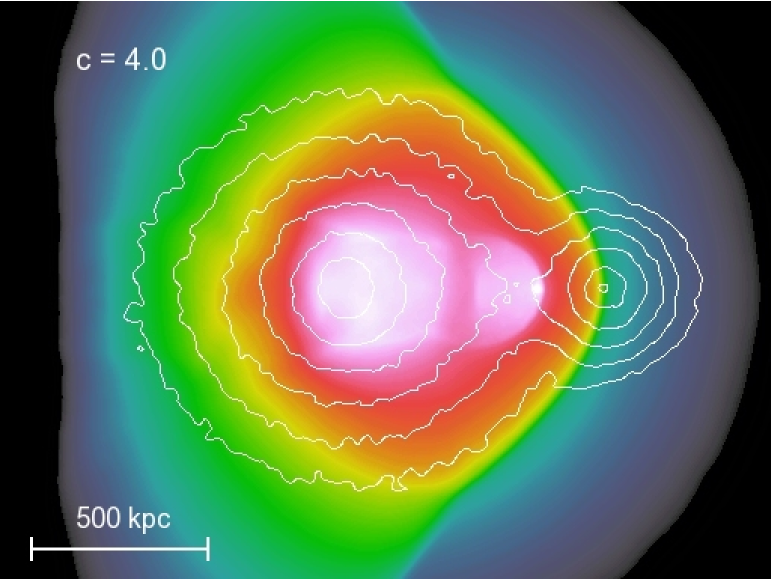
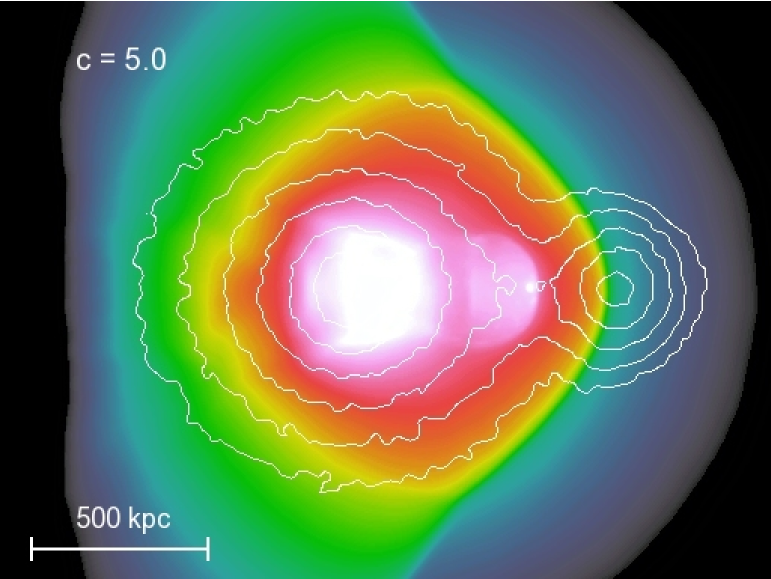
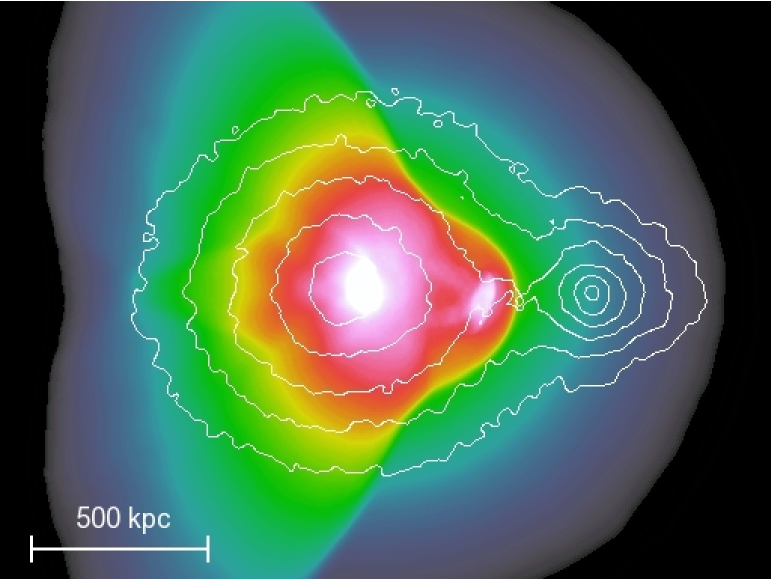
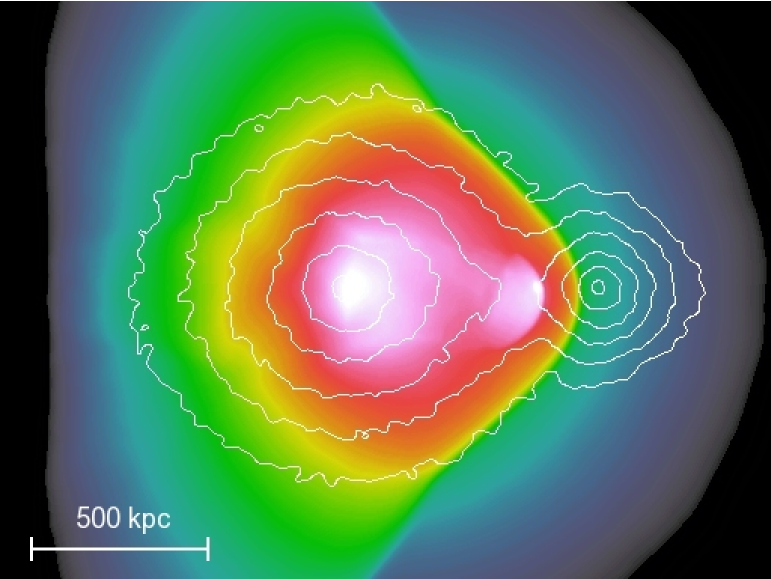
In Figure 7, we compare maps of the X-ray emission with overlaid contours of the projected total mass for different choices for the initial concentration of the parent cluster prior to the merger. The value of adopted in our default model (as suggested by new mass models of Clowe matched to the lensing data) is quite low for a cluster of this mass, given that the typical concentration expected in CDM models for a cluster of this mass lies around (Eke et al., 2001; Bullock et al., 2001). We therefore calculated a number of simulations with higher concentrations, using , , and . A larger concentration of the parent system will make it more difficult for the gas bullet to penetrate through the center. In particular, we expect that the incoming bullet experiences a higher ram pressure and will presumably also be stripped more efficiently of its dark matter during core passage.
The results shown in Figure 7 confirm this expectation: With increasing concentration, the separation between the X-ray bright region of the bullet (where the gas density peaks) and its associated dark matter mass peak becomes larger. In addition, the shape of the contact discontinuity (the edge of the bullet) changes noticeably as well; it becomes progressively rounder with increasing concentration, such that the opening angle of the narrow wedge obtained in the case is first enlarged, and finally becomes transformed into a round, blunt shape. On the other hand, the shape of the bow shock remains essentially unaffected by the change in concentration.
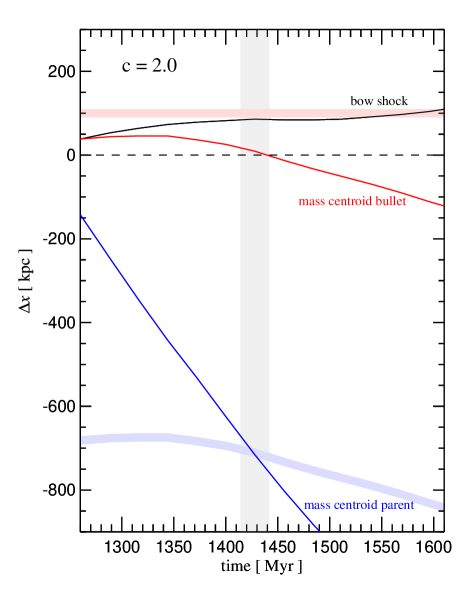
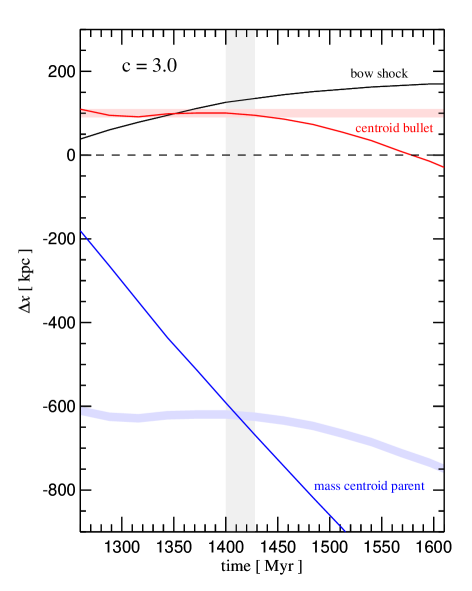
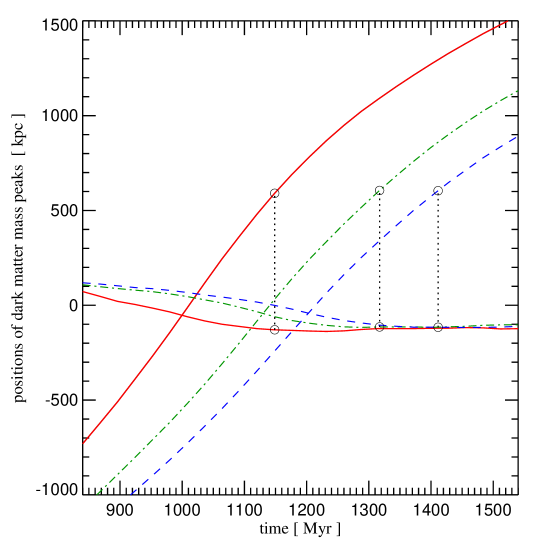
By visual inspection, it appears that the case among this set of simulations can best match the observed shape of the bullet’s edge in 1E0657–56. For this simulation we also find a significant spatial offset between the mass peak and the X-ray emission, quite similar in size to that found in the gravitational lensing analysis of Clowe et al. (2006). Figure 8 quantitatively confirms this. In it we show the location of the edge of the bullet, the bow shock, and the two mass peaks, as a function of time, both for the default case of and the model. In order to identify the time of best-match to the observed system, we plot the positions relative to the coordinate of the edge of the bullet and we mark the desired spatial offsets of the observed system with shaded bands. We focus on reproducing the distance on the sky between the mass peaks of parent cluster and subcluster given by Clowe et al. (2006), and on the separation of between the bow shock and the edge of bullet. For a good match, we hence require that these two relative differences are reproduced simultaneously. We see that this is quite well the case for the simulation, at around . Our default simulation underpredicts the separation between the bullet’s mass peak and edge of the bullet at all times, while the and cases (not shown) overpredict it during the times when the mass peaks have the right separation.
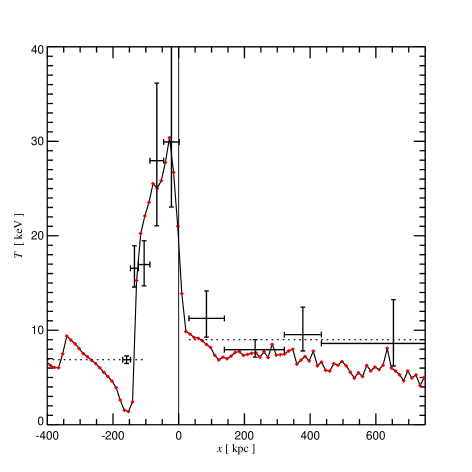
It is interesting that the case also reproduces other existing observational constraints on 1E0657–56 quite well. In Figure 9, we show an enlargement of the simulation’s temperature structure across the shock front and the contact discontinuity, and compare it to measurements of the temperature profile of 1E0657–56 obtained by Markevitch (2006) based on deep Chandra data. The shock seen in the simulation has a Mach number of , consistent with the observational data. The fall off of the temperature at the cold front is reproduced quite well. Also, the pre-shock temperature of 9 keV is matched well by the model; only further ahead of the shock the simulated temperature appears marginally lower than the measurements.
We can also consider the gas masses in spherical apertures of around the mass centroids of bullet and parent cluster, and about the center of X-ray emission of the bullet. These masses have been measured by Clowe et al. (2006), who estimate of gas around the bullet’s mass centroid (actually they used the BCG position, which we take here as a proxy for the mass centroid), while the simulation gives . For the parent mass centroid they get , and the simulation yields . Finally, for the bullet’s X-ray centroid they find while the simulation model gives also . We note however that unlike found in the lensing mass reconstructions of Clowe et al. (2006) and Bradač et al. (2006), our simulation does not show a significant spatial offset between the mass centroid of the parent cluster and its associated X-ray centroid.
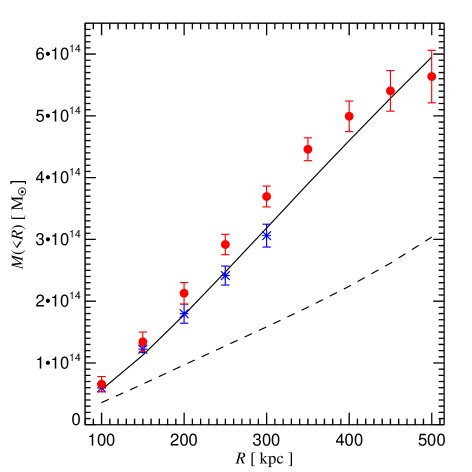
In Figure 10, we consider the projected cumulative mass profile as a function of radius around the bullet’s and the parent’s mass centroids, and we compare this to the measurement of Bradač et al. (2006) based on their weak- and strong lensing reconstruction. Our model matches the result of the lensing analysis for the parent cluster very well, but predicts significantly less enclosed mass for the bullet itself. This could perhaps be remedied by simulations with a more massive, a more concentrated, or a non-spherical bullet. Alternatively, it could be due to a systematic overestimate in the lensing mass estimate of the bullet. While the latter seems unlikely due to the extensive tests that have been applied to the mass reconstruction methods applied to 1E0657–56, the fact that the baryonic masses of the simulation model agree well with the directly measured gas masses from the X-ray observations is a point supporting the simulation’s mass model.
Finally, an interesting observation about the shape of the bow shock in our simulated mergers is that it features a clear bend towards a larger opening angle, approximately away from the symmetry axis of the merger. This feature originates during the core passage of the bullet, when the central part of the bullet is accelerated to its peak velocity and shoots out on the other side of the core. It is presently unclear whether such a feature exists in the observations, as it should be located in a region where the available X-ray maps have extremely low surface brightness and are dominated by noise. With some good will, one can spot a tentative hint for it in the observed maps of Markevitch (2006), but this is certainly far from being significant. Future X-ray observations should be able to probe to fainter surface brightness levels, in which case this generic prediction of our simulation models could be tested.
4.1. The future evolution of the bullet cluster
It is interesting to use our simulation model to study the expected future evolution of the bullet cluster system. Adopting the simulation as our best-matching model, we predict that the bullet will continue to enlarge its distance from the parent cluster for another from the time of best-match. After turn around, it falls back and experiences a second core passage after the first one. This is followed by a third passage another later, after which the bullet is nearly completely destroyed, such that a ‘ring down’ with a quick succession of possibly several further core passages leads to a complete coalescence of the cores. This allows the cluster to reestablish hydrostatic equilibrium, so that we can expect 1E0657–56 to reach a fully relaxed state again within the next .
In Figure 11, we show the time evolution of the expected bolometric X-ray emission of the system until the merger is complete. For simplicity, we have simply computed the quantity as a proxy for the bremsstrahlung emissivity from the gas of the simulations, without taking into account metal lines. The vertical dotted lines mark core passages of the bullet cluster. These happen slightly earlier than the induced peaks in the X-ray emissivity. At the time of best match with the observed state of 1E0657–56 (marked with a dashed line), the system is in an overheated state, with a mean emission-weighted temperature of around . The cluster responds to the compression from the merger by adiabatically overexpanding past its equilibrium in the subsequent evolution, leading to a comparatively cool state for a period of order before the second collision. Then a further heating event occurs when the surviving part of the bullet passes through the core a second time. Finally, the third core passage leads to near complete disruption of the remains of the bullet. We are then left with a relaxed cluster with a mean emission-weighted temperature of .
5. Dependence on model parameters
5.1. Orbital angular momentum of the encounter
Based on the visual appearance of 1E0657–56 and its small line-of-sight velocity difference of (Barrena et al., 2002), it appears that the merger is very nearly central, and closely aligned with the plane of the sky. Indeed, a slight offset from a central collision can easily introduce a significant degree of axial asymmetry larger than observed in the cones of bow shock and cold front. We illustrate this in Figure 12, where we show in the top panel a projected X-ray map for a merger with small orbital angular momentum, parameterized by an ‘impact parameter’ . Here is the distance at pericenter the clusters would reach if they interacted as point masses during the collision. Comparing this result with the observed X-ray map in Figure 2, we see that the shock structure is already too asymmetric to provide a good match to the observed X-ray morphology.
However, we can always recover symmetry by turning the orbital plane from observing it face-on to observing it edge-on. In the middle and bottom panels of Figure 12 we show the same simulation when viewed 45 degrees and 90 degrees with respect to the orbital plane. While in these cases symmetry is partially/fully recovered, the edge of the bullet and the bow shock appear rounder and less sharp, and the edge of the bullet develops a shape that agrees comparatively poorly with the observed one. The line-of-sight velocity differences obtained in the two cases amount to (for 45 degrees) and (for 90 degrees), respectively, which means that one will quickly run into tension with the observations when one tries to ‘hide’ a larger orbital angular momentum in the encounter than considered here with an edge-on view of the system.
We hence conclude that 1E0657–56 should be quite close to a central merger that happens in the plane of the sky, even though a small deviation from this geometry appears likely. For the sake of simplicity, we treat all other merger simulations in this paper as exactly central, with the merger axis aligned with the plane of the sky.
5.2. Baryon fractions of the clusters
In our default models, we consider equal baryon fractions for the two merging clusters, given by , as suggested by recent cosmological parameter constraints based on WMAP3 (Spergel et al., 2006), and we neglect the small fraction of baryons locked up in stars, so that all of the baryons are contained in the diffuse gas of the ICM. Clusters are generally believed to be essentially closed-box systems due to their large mass, so the assumption of a baryon fraction equal to the universal value should be comparatively safe. On the other hand, there is some tension with respect to this in the low-density, low- cosmological model favored by WMAP3, since detailed accounting of all observed baryonic components in clusters tends to lead to values for smaller than 0.17 (McCarthy et al., 2006).
However, in a number of test simulations where we varied , we found that our results are relatively insensitive to changing this parameter, unless we assign different baryon fraction to the clusters. The latter might be appropriate if the smaller sub-cluster has lost some of its baryons as a result of strong outflows in progenitor systems, or has locked up more of its baryons into collisionless stars. In this case we expect trends that are closely related to those found for changes in the concentration, which we considered earlier. If the baryon fraction of the bullet is lowered relative to that of the main cluster, it will be harder for the bullet’s gas to pass through the main cluster’s core. This should enlarge the separation between mass centroid of the bullet and the X-ray peak after core passage. Conversely, if the bullet is made more gas-rich while the parent’s gas density is kept fixed or lowered, the deceleration of the bullet by ram-pressure will become smaller, similar to the effect obtained when the concentration of the parent cluster is lowered, which will also tend to keep the mass centroid of the bullet and its X-ray cold front closer together.
We have carried out a number of additional simulations where we varied the baryon fractions in the two merging systems, but otherwise adopted the parameters of our default model. The results of these simulations qualitatively confirm the expectations described above without improving the match to the 1E0657–56 system in any significant way. For the sake of brevity, we therefore omit showing X-ray maps for these runs in a separate figure.
5.3. Numerical resolution
For all our default simulations we used a mass resolution of and , translating to particles for the parent cluster and for the infalling bullet cluster. To test for any possible dependence on numerical resolution, we have rerun our default model with an increased particle number by a factor of 8, and an improved spatial resolution by a factor of 2 per dimension. This simulation produces results for the strength of the shock and for the locations and velocities of the various hydrodynamic and dark matter features that are in excellent agreement with the simulation computed at our standard resolution.
We conclude form this resolution test that the numerical resolution used in all our simulations is sufficient to provide numerically converged results for all the quantities studied here.
5.4. Other parameters
Other physical parameters that in principle should be addressed in the simulations if one wants to find a ‘perfect’ model for the 1E0657–56 system include the mass ratio of bullet and parent cluster, their intrinsic shape, the relative central entropy levels of the gas in the clusters, their relative baryon fractions, the effective viscosity of the gas (Sijacki & Springel, 2006), its thermal conductivity (Jubelgas et al., 2004), and also non-thermal pressure components like cosmic rays (Pfrommer et al., 2006; Ensslin et al., 2006; Jubelgas et al., 2006) or intracluster magnetic fields (Dolag et al., 2002). It would also be interesting to try to identify a 1E0657–56 look-alike in a large-scale cosmological hydrodynamical simulation, where the full dynamics of the infall and of gas accretion would be treated self-consistently.
Obviously, this long list of possibilities quickly leads to a very large parameter space which will be difficult to constrain without additional observational constraints. Given that already our simple toy model provides a good match to the key features that are observed in 1E0657–56, we refrain from studying the extended physical parameter space further in this paper, apart from one exception that we shall consider in the next section.

6. Mergers in fifth force models
Many extensions of the standard model of particle physics not only predict dark matter candidates in the form of new elementary particles, but also additional (long-range) fields which may couple differently to the dark matter particles and ordinary baryons (e.g. Damour et al., 1990; Farrar & Peebles, 2004; Gubser & Peebles, 2004). Interest in such models is strong also on astrophysical grounds. For example, they can produce cosmic voids that are ‘emptier’ of galaxies than standard cold dark matter models (e.g. Farrar & Peebles, 2004; Nusser et al., 2005), which might be required to match observational data.
One of the simplest classes of such models can be phenomenologically characterized by a ‘fifth forth’ in the dark sector, mediated by a Yukawa-like potential
| (3) |
between dark matter particles of mass , in addition to ordinary gravity. Here is an effective screening length of the scalar force, while gives its strength on small scales relative to ordinary gravity. The difficulty to explain a velocity of the bullet as high as in CDM cosmologies led Farrar & Rosen (2006) to suggest that such a high speed, if true, may provide direct evidence for the existence of a fifth force.
In this study, we have shown that the common approach of equating the shock velocity with the bullet velocity is incorrect, and that CDM models in fact quite naturally produce shock speeds in excess of , despite the fact that the bullet is moving much slower than that, by about . While this essentially eliminates the utility of 1E0657–56 to obtain strong constraints on the strength of a possible fifth force, we are here interested in explicitly testing the conjecture of Farrar & Rosen (2006), i.e. we want to see by how much a fifth force can accelerate the bullet in direct simulations of the merging process.
For definiteness, we choose a range of and explore two different values of , namely and . The size of is large enough to encompass both the parent cluster’s virial radius and that of the infalling bullet cluster, such that the gravitational constant between dark matter particles is effectively boosted to when they are isolated. If we hence increase the random dark matter velocities in the dark halos of the initial clusters by a factor , we retain dynamical stability of the isolated systems in the fifth force model, with the same density profile as in our default simulations.
The range is also short enough such that a parabolic orbit from infinity leads only to a slightly increased velocity compared to a Newtonian infall when the virial radii first touch. We approximate this initial velocity of the encounter with the relative velocity two point masses would reach when falling together from infinity up to the initial relative separation of the sum of the two virial radii, which is the starting separation adopted in our simulations. In doing so we implicitly assume that the relative binding forces between gas and dark matter hold the isolated systems together during the initial infall without appreciable shape distortions due to the violation of the equivalence principle in the fifth force model. We then expect a 17.2% increase in the relative velocity at the initial time for the model, which we correspondingly include in our initial conditions for the fifth force simulation. We note that for an infinite range of the fifth force, this correction factor would increase to 30%.
In Figure 13, we show maps of the X-ray surface brightness with overlaid mass contours for the simulations with and , respectively, at a time when the mass centroids of the bullet and the parent cluster are apart. The X-ray morphology seen in the maps can be directly compared to the corresponding maps for ordinary mergers shown in Fig. 7. What is immediately apparent is the rather large offset between the dark matter and the gas of the bullet in the case. The centroid of the dark mass of the bullet is ahead of the shock front in this case, and ahead of the edge of the bullet. An analysis of the bow shock shows that the Mach number of the shock is slightly lower in this fifth force run, with , but the preshock temperature is a bit higher (10 keV), such that the inferred shock velocity is . Also in this case there is a preshock inflow velocity, but with a slightly reduced size of , which in part is explained by the earlier time of the ‘best-match’, here defined in terms of the separation of the mass centroids of bullet and parent cluster.
The different timing of the merger is shown in more detail in Figure 14, where we plot the coordinates of the mass centroids of bullet and parent cluster as a function of time, comparing results for , and (i.e. no fifth force). The times when the separations reach are shown with vertical dotted lines. Clearly, the model leads to a significantly earlier core passage and matching time than the other models, as a result of the higher velocity reached by the bullet. In fact, at the time of best-match, the dark matter of the bullet is moving with , which is here by chance quite close to the numerical value obtained for the shock speed. This corresponds to a substantial increase of relative to the value predicted for the corresponding CDM run. If is lowered to , the velocity increase is reduced to , and the opening angle of the bow shock becomes larger (see Fig. 13). The latter is hence in principle an interesting diagnostic for the strength of the fifth force.
The above clearly shows the substantial impact models with non-trivial interactions in the dark sector have on cosmological structure formation, and in particular on the non-linear regime that governs the internal structure and dynamics of halos. So far, comparatively little simulation work has addressed this problem (with notable exceptions, e.g. Nusser et al., 2005; Kesden & Kamionkowski, 2006), but as seen here, direct numerical simulation methods are a powerful tool to study the implications of such models and to constrain them with observational data, so future work in this area should be very worthwhile.
7. Conclusions
The bullet cluster 1E0657–56 offers a unique perspective into cluster physics and the hierarchical build-up of cosmic structure. Deep X-ray observations have revealed a strong bow shock in front of the bullet, and a contact discontinuity, a ‘cold front’, that gives its bright central region a sharp, wedge-like edge. In addition, mass reconstructions based on weak- and strong gravitational lensing have allowed a reliable determination of the projected mass distribution of the system. The latter features a spatial offset between the mass centroids and the baryonic mass centroids, which represents strong evidence for the existence of a non-baryonic dark matter component.
This combination of powerful observations destines 1E0657–56 to serve as laboratory for constraining fundamental aspects of cluster physics and of our cosmological model. For example, the system has already been used to determine constraints on the collisional cross-section of dark matter (Markevitch et al., 2004). It also has become one of the hardest challenges for alternative gravity models like MOND that try to circumvent the need for dark matter. While claims have been made that MONDian-like theories could possibly reproduce the bullet cluster as well (Angus et al., 2006; Brownstein & Moffat, 2007), nothing that comes close to the quality of the matches presented here for CDM has been presented thus far to support such scenarios.
The point we have focused on in this paper is the high inferred shock velocity in the bullet cluster, which is a direct consequence of the measured Mach number and the pre-shock temperature of the gas. The literature thus far has assumed that this shock velocity can be directly identified with the velocity of the bullet subcluster itself. Theoretical papers have then pointed out that such a large velocity for the bullet is uncomfortably high, either implying that the system is a rather rare outlier (Hayashi & White, 2006) or may need new physics in the dark sector to be explained (Farrar & Rosen, 2006).
Using explicit hydrodynamical simulation models of cluster mergers, in 3D and with self-consistent gravitational dynamics of dark matter and baryons, we have here shown that a direct correspondence between the inferred shock velocity of the bullet and that of its associated mass is however not given. In the case of 1E0657–56, the two velocities can differ both because the upstream gas is accelerated towards the shock-front by gravitational effects that can be felt ahead of the hydrodynamical shock, and secondly, because the shock front is moving with a different speed than the mass centroid of the bullet subcluster. Our simulation model based on a 1:10 merger of ordinary CDM halos on a central, zero-energy orbit reproduces the inferred shock speed well, even though the subcluster moves only with . At the same time, the model provides surprisingly good matches to the observed temperature profile across the shock and cold fronts, and to the observational determined mass distributions in the gas from X-rays, and in the total mass from lensing. We conclude that the bullet cluster 1E0657–56 is consistent with the simplest possible scenario one can construct in CDM for a 1:10 mass-ratio merger between a very rich cluster of galaxies and a smaller sub-cluster. In fact, based on the results of Hayashi & White (2006) we estimate that the likelihood to find a most massive dark matter substructure with a velocity of at least embedded in a parent system with at is as high as . Here we conservatively accounted for the increase of the relative velocity of the subcluster relative to the parent cluster, which is bounded to be less than , depending on how much mass the subcluster has already lost.
We have also shown that the size of the spatial offset between mass and baryonic peak is quite sensitive to the structural details of the merging systems. While a spatial offset between the mass centroids of dark matter and baryons arises naturally as a result of the hydrodynamic ram pressure experienced by the bullet’s gas during core passage, this displacement depends on the relative gas fractions and concentrations of the merging clusters, in addition to being highly time-variable. This could also be the reason why some earlier numerical models of the bullet cluster missed to detect the offset altogether (Takizawa, 2005). As Figure 4 shows, for low initial concentrations of the parent cluster, the shock front and the edge of the bullet can even overtake the mass centroid of the cluster at late times during the merger, thereby reversing the sign of the displacement seen by Clowe et al. (2006). One is hence not necessarily guaranteed to see a spatial offset of similar size as in 1E0657–56 between dark mass centroid and gaseous centroid in all massive cluster mergers, and during the whole post core-passage phase. Our results emphasize that an interpretation of highly non-linear systems such as 1E0657–56 requires self-consistent simulation models that account accurately both for the gravitational and hydrodynamical dynamics of dark matter and baryons during cluster mergers.
References
- Angus et al. (2006) Angus, G. W., Famaey, B., & Zhao, H. S. 2006, MNRAS, 371, 138
- Barrena et al. (2002) Barrena, R., Biviano, A., Ramella, M., Falco, E. E., & Seitz, S. 2002, A&A, 386, 816
- Bradač et al. (2006) Bradač, M., Clowe, D., Gonzalez, A. H., Marshall, P., Forman, W., Jones, C., Markevitch, M., Randall, S., Schrabback, T., & Zaritsky, D. 2006, ApJ, 652, 937
- Brownstein & Moffat (2007) Brownstein, J. R. & Moffat, J. W. 2007, ArXiv Astrophysics e-prints
- Bullock et al. (2001) Bullock, J. S., Kolatt, T. S., Sigad, Y., Somerville, R. S., Kravtsov, A. V., Klypin, A. A., Primack, J. R., & Dekel, A. 2001, MNRAS, 321, 559
- Clowe et al. (2006) Clowe, D., Bradač, M., Gonzalez, A. H., Markevitch, M., Randall, S. W., Jones, C., & Zaritsky, D. 2006, ApJ, 648, L109
- Clowe et al. (2004) Clowe, D., Gonzalez, A., & Markevitch, M. 2004, ApJ, 604, 596
- Damour et al. (1990) Damour, T., Gibbons, G. W., & Gundlach, C. 1990, Physical Review Letters, 64, 123
- Dolag et al. (2002) Dolag, K., Bartelmann, M., & Lesch, H. 2002, A&A, 387, 383
- Eke et al. (2001) Eke, V. R., Navarro, J. F., & Steinmetz, M. 2001, ApJ, 554, 114
- Ensslin et al. (2006) Ensslin, T. A., Pfrommer, C., Springel, V., & Jubelgas, M. 2006, ArXiv Astrophysics e-prints
- Ettori & Fabian (2000) Ettori, S. & Fabian, A. C. 2000, MNRAS, 317, L57
- Farrar & Peebles (2004) Farrar, G. R. & Peebles, P. J. E. 2004, ApJ, 604, 1
- Farrar & Rosen (2006) Farrar, G. R. & Rosen, R. A. 2006, ArXiv Astrophysics e-prints
- Gubser & Peebles (2004) Gubser, S. S. & Peebles, P. J. E. 2004, Phys. Rev. D, 70, 123511
- Hayashi & White (2006) Hayashi, E. & White, S. D. M. 2006, MNRAS, 370, L38
- Jubelgas et al. (2004) Jubelgas, M., Springel, V., & Dolag, K. 2004, MNRAS, 351, 423
- Jubelgas et al. (2006) Jubelgas, M., Springel, V., Ensslin, T. A., & Pfrommer, C. 2006, ArXiv Astrophysics e-prints
- Kesden & Kamionkowski (2006) Kesden, M. & Kamionkowski, M. 2006, Phys. Rev. D, 74, 083007
- Lyutikov (2006) Lyutikov, M. 2006, MNRAS, 373, 73
- Markevitch (2006) Markevitch, M. 2006, in ESA SP-604: The X-ray Universe 2005, ed. A. Wilson, 723
- Markevitch et al. (2004) Markevitch, M., Gonzalez, A. H., Clowe, D., Vikhlinin, A., Forman, W., Jones, C., Murray, S., & Tucker, W. 2004, ApJ, 606, 819
- Markevitch et al. (2002) Markevitch, M., Gonzalez, A. H., David, L., Vikhlinin, A., Murray, S., Forman, W., Jones, C., & Tucker, W. 2002, ApJ, 567, L27
- Markevitch & Vikhlinin (2007) Markevitch, M. & Vikhlinin, A. 2007, ArXiv Astrophysics e-prints
- McCarthy et al. (2006) McCarthy, I. G., Bower, R. G., & Balogh, M. L. 2006, ArXiv Astrophysics e-prints
- Navarro et al. (1996) Navarro, J. F., Frenk, C. S., & White, S. D. M. 1996, ApJ, 462, 563
- Navarro et al. (1997) —. 1997, ApJ, 490, 493
- Nusser et al. (2005) Nusser, A., Gubser, S. S., & Peebles, P. J. 2005, Phys. Rev. D, 71, 083505
- Pfrommer et al. (2006) Pfrommer, C., Ensslin, T. A., Springel, V., Jubelgas, M., & Dolag, K. 2006, ArXiv Astrophysics e-prints
- Sijacki & Springel (2006) Sijacki, D. & Springel, V. 2006, MNRAS, 371, 1025
- Spergel et al. (2006) Spergel, D. N., Bean, R., Dore’, O., Nolta, M. R., Bennett, C. L., Hinshaw, G., Jarosik, N., Komatsu, E., Page, L., Peiris, H. V., Verde, L., Barnes, C., Halpern, M., Hill, R. S., Kogut, A., Limon, M., Meyer, S. S., Odegard, N., Tucker, G. S., Weiland, J. L., Wollack, E., & Wright, E. L. 2006, ArXiv Astrophysics e-prints
- Springel (2005) Springel, V. 2005, MNRAS, 364, 1105
- Springel et al. (2005a) Springel, V., Di Matteo, T., & Hernquist, L. 2005a, MNRAS, 361, 776
- Springel et al. (2005b) Springel, V., White, S. D. M., Jenkins, A., Frenk, C. S., Yoshida, N., Gao, L., Navarro, J., Thacker, R., Croton, D., Helly, J., Peacock, J. A., Cole, S., Thomas, P., Couchman, H., Evrard, A., Colberg, J., & Pearce, F. 2005b, Nature, 435, 629
- Springel et al. (2001) Springel, V., Yoshida, N., & White, S. D. M. 2001, New Astronomy, 6, 79
- Takizawa (2005) Takizawa, M. 2005, ApJ, 629, 791
- Vikhlinin et al. (2001a) Vikhlinin, A., Markevitch, M., & Murray, S. S. 2001a, ApJ, 551, 160
- Vikhlinin et al. (2001b) —. 2001b, ApJ, 549, L47