The Masses of Black Holes in Active Galactic Nuclei
Abstract
Reverberation mapping methods have been used to measure masses in about three dozen AGNs. The consistency of the virial masses computed from line widths and time delays, the relationship between black hole mass and host-galaxy stellar bulge velocity dispersion, and the consistency with black hole masses estimated from stellar dynamics in the two cases in which such determinations are possible all indicate that reverberation mass measurements are robust and are accurate to typically a factor of a few. The reverberation-mapped AGNs are of particular importance because they anchor the scaling relationships that allow black hole mass estimation based on single spectra. We discuss potential sources of systematic error, particularly with regard to how the emission line widths are measured.
Department of Astronomy, The Ohio State University, 140 West 18th Ave., Columbus, OH 43210, USA
1. Introduction
It is only in this first decade of the century that we have been able to discuss the masses of AGN black holes with any confidence. For a somewhat longer time, however, there have been plausible measurements of the masses of black holes in quiescent galaxies, based on studies of stellar dynamics and gas dynamics in the nuclei of nearby galaxies, including our own Milky Way. The presence of an active nucleus in a galaxy makes it extremely difficult to study the nuclear stellar dynamics; the stellar absorption features are simply washed out by the AGN spectrum. But gas motions on otherwise unresolvable angular scales can be studied by use of reverberation mapping methods (Kaspi, these proceedings). In this review, we discuss progress made in determining the masses of black holes in AGNs by reverberation mapping of the broad-line region (BLR).
2. On the Reliability of Reverberation-Based Mass Measurements
Three lines of evidence suggest that the black hole masses based on reverberation are reliable at the “factor of a few” level:
-
1.
In each case where it can be reliably tested, there is a virial-like relationship between the reverberation-based emission-line lags and the emission-line width of the form , as expected if the dynamics of the BLR are dominated by the gravity of the central black hole. Specifically, the mass the the black hole is given by
(1) where is the gravitational constant and is a dimensionless factor of order unity that depends on the kinematics, geometry, and inclination of the AGN.
-
2.
Reverberation-based black hole masses correlate with the stellar bulge velocity dispersion of the host galaxies in a fashion similar to that seen in quiescent galaxies. In other words, AGNs also obey the well-known – relationship.
-
3.
In the rare cases where the black hole mass can be measured by other methods, there is general agreement with the reverberation-based masses.
2.1. The Virial Relationship
As noted above, the size of the emitting region for any particular emission line is well correlated with the emission-line width in the sense that , as expected if gravity is the principal dynamical force in the BLR. This has been shown to hold in every case where it can be reasonably tested (meaning that some reasonable range of must be sampled through measurement of different emission lines or the same emission line in very different flux states). Indeed, the better the data (not only in terms of quality, but in terms of the range of and sampled), the better the agreement with the virial prediction. The best agreement is seen in the well-studied case of NGC 5548 (Peterson & Wandel 1999; Peterson et al. 2004; Bentz et al. 2007), but a similar relationship is seen in NGC 7469 and 3C 390.3 (Peterson & Wandel 2000), NGC 3783 (Onken & Peterson 2002), Mrk 110 (Kollatschny 2003a), and NGC 4151 (Metzroth, Onken & Peterson 2006; Bentz et al. 2006b).
This relationship was anticipated in work by Krolik et al. (1991), but agreement with the virial prediction was not strong enough to convince these authors that indeed the BLR was virialized. The analysis of Peterson & Wandel (1999) differed from that of Krolik et al. by (1) exclusion of blended or contaminated lines, (2) exclusion of spurious or dubious line lags, (3) measurement of the line width in the variable part of the spectrum (as discussed below) and (4) most importantly it turns out, elimination of discretization effects arising from use of the Discrete Correlation Function method (Edelson & Krolik 1988), which returned lags only in multiples of 4 days and with dubious uncertainties. In the interim, extensive testing (e.g., White & Peterson 1994; Peterson et al. 1998) demonstrated that greater precision and accuracy could be achieved using the interpolation method as long as the data are reasonably well sampled.
Two ways of characterizing the emission-line widths have been employed to date, and we emphasize that these are not interchangeable. The simplest and most widely used line-width measure is the full-width-at-half maximum (FWHM). The other, originally suggested in this context by Fromerth & Melia (2000) and later championed by Peterson et al. (2004), is the line dispersion , which is based on the second moment of the emission-line profile111It should be recognized that is well-defined regardless of the emission-line profile. It specifically is not, as sometimes mistakenly asserted, the width of the best-fit Gaussian to the line profile. It can be measured in mean, rms, or single-epoch spectra.. On one hand, FWHM is trivial to measure and is relatively insensitive to extended wings and blending with other lines. On the other hand, is well-defined for even noisy profile data (often the case, as noted below), is less sensitive to the presence of a narrow-line component, and is more precise for low-contrast lines.
Peterson et al. (2004) argue that the virial relationship between line width and lag is best reproduced by using (as opposed to FWHM) and the centroid of the continuum/emission-line cross-correlation function (CCF) (as opposed to the peak of the CCF ). They also point out that the virial relationship is more clearly seen by measuring the line width in the variable part of the spectrum: the spectra used to measure the continuum and emission-line light curves can be combined to form mean and root-mean-square (rms) spectra; the rms spectrum isolates the part of the emission line that is actually varying, i.e., the gas to which the measured lag applies.
3. The AGN – Relationship
There is a tight correlation between the mass of the central black hole and the stellar bulge velocity dispersion (Ferrarese & Merritt 2000; Gebhardt et al. 2000a), first discovered in quiescent galaxies. It has been subsequently shown that reverberation-based black hole masses for AGNs yield a similar relationship (Gebhardt et al. 2000b; Ferrarese et al. 2001; Onken et al. 2004; Nelson et al. 2004). Onken et al. (2004) determine a mean value for the scaling factor in eq. (1) by matching the zero-point of the AGN – relationship to that of quiescent galaxies. With values of available for approximately half of the reverberation-mapped sample, Onken et al. derived a mean value of the scaling factor . The consistency between the AGN – relationship and that for quiescent galaxies provides an additional argument that the reverberation-based masses have some meaning. Moreover, the scatter around the best-fit – relationship suggests that, on average, the reverberation masses are accurate to better than 0.5 dex.
3.1. Comparison with Stellar Dynamical Masses
The black hole “radius of influence,” , defines the size of the nucleus in which the gravity of the black hole dominates the dynamics of the stars in the galactic bulge. Only two reverberation-mapped AGNs, NGC 3227 and NGC 4151, are close enough that their black hole radius of influence is in principle resolvable with Hubble Space Telescope, a 2.4-m telescope working at the diffraction limit.
In the case of NGC 3227, Davies et al. (2006) used -band integral field data obtained with SINFONI on the ESO VLT to model the stellar dynamics of the inner bulge of this galaxy. They find that the central black hole mass is in the range –, which compares favorably with the reverberation measurement of (Peterson et al. 2004), especially given the systematic uncertainties in both mass determinations. Onken et al. (2007) attempted to observe the Ca ii triplet in the near IR spectrum of NGC 4151 using STIS on HST. Despite elaborate attempts to reduce the AGN contribution to the spectrum, the Ca ii triplet lines remained undetectable in the HST data. Fortunately, however, it was possible to use two long-slit spectra of NGC 4151 obtained on the NOAO Mayall 4-m telescope on Kitt Peak and the MMT on Mt. Hopkins, and these proved to be good enough to model the dynamics. But because NGC 4151 is a non-axisymmetric system (it has a clear central bar) and only two slit positions were obtained, the mass determination is quite model-dependent. If it is assumed that the inclination of the bulge is the same as the disk of the galaxy, then the central black hole mass is in the range –. If, on the other hand, it is assumed that we observe the bulge edge-on, then we obtain only an upper limit to the black hole mass, . Either result is consistent with the most recent reverberation result, (Bentz et al. 2006b).
In both cases, the agreement between the reverberation and stellar dynamical results is gratifying. However, neither stellar dynamical mass measurement is particularly robust, and certainly additional observations with an integral field unit and adaptive optics will be required to make a truly convincing case.
4. The Mass–Luminosity Relationship
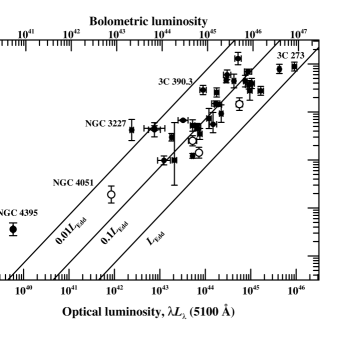
Based on reverberation-mapping results for three dozen AGNs, we can begin to construct a mass–luminosity relationship, as shown in Fig. 1. There are several notable features. First, reassuringly, all of the AGNs are accreting at sub-Eddington rates, although in each case we have made the unsupported general assumption that the bolometric luminosity is simply a multiple of the optical luminosity, specifically . Second, most of the AGNs that can be classified as narrow-line Seyfert 1 (NLS1) galaxies (open circles in the Figure) are found to be high accretion-rate objects. Moreover, there are several objects with similar “I Zw 1” type spectra that do not formally meet the NLS1 criterion of , but are nevertheless quite similar objects222We submit the following oversimplified argument: as shown in the next section, the size of the BLR scales like . From the virial equation (eq. 1), the line width scales like . We define the Eddington ratio as the accretion rate relative to the Eddington rate, i.e., . Combining these, we can write The suggestion is that NLS1 properties are attributable to the Eddington ratio, i.e., objects with similar should have similar spectra. However, we see that the line widths of more massive objects increase with so that high-mass AGNs with similar to those of low-mass AGNs do not meet the NLS1 line-width criterion of even though the spectra are otherwise similar. Some of the higher-luminosity AGNs (e.g., 3C 273 [PG 1226+023] and PG 1700+518) would be classified with the open-circle objects in Fig. 1 if the criterion was based on rather than line width only.. Third, there are a few galaxies that seem to be outliers relative to the rest of the distribution: specifically, some objects appear to have abnormally low Eddington ratios. Some of these, like NGC 3227 and NGC 4051, are heavily reddened and have significant internal extinction, so their luminosities (and hence Eddington ratios) are clearly underestimated.
5. Estimating Black Hole Masses from Individual Spectra
The 36 reverberation-mapped AGNs shown in Fig. 1 are of particular importance because they anchor the black hole mass scale, as we will see in this section.
5.1. The Radius–Luminosity Relationship
There is a remarkable correlation between the BLR radius (), as measured for some particular emission line, and the luminosity of the AGN. The existence of the correlation itself is not so remarkable; indeed it was anticipated when there were only a handful of admittedly rather unreliable measurements of the BLR size (e.g., Koratkar & Gaskell 1991), but appeared only clearly when PG quasars were added to the reverberation-mapped sample of AGNs (Kaspi et al. 2000). It is usually supposed that it was the extension of the luminosity range to higher values that led to the emergence of the – relationship, but this is only partially correct. The high-luminosity PG quasars were of particular importance in defining the – relationship primarily because they are so luminous that the luminosity measurement is affected only a small amount by contamination by the host galaxy. As showed by Bentz et al. (2006a, and these proceedings), the low-luminosity end of the – relationship is obscured by the substantial contamination of the luminosity measurement by starlight from the host galaxy. When the host-galaxy starlight contribution is correctly accounted for, the beautiful – relationship shown by Bentz et al. emerges; over the whole luminosity range, a good fit is obtained with . So what is remarkable about this relationship is:
-
1.
The slope of the – relationship is consistent with the most naïve expectation if the physical conditions in the BLR are the same in all AGNs. This is a low-order approximation that flies in the face of observations (e.g., the Baldwin Effect) and theory (e.g., more massive black holes should have cooler accretion disks, and hence the shape of the ionizing continuum should be a function of black hole mass).
-
2.
The starlight-corrected – relationship now appears to have so little scatter that outliers are suspicious: either their lags are dubious or their luminosities are underestimated because of internal reddening, for example.
5.2. Using (or Abusing) Scaling Relationships
The beauty of the radius–luminosity relationship is that it allows us to estimate the size of the line-emitting region by measurement of the luminosity alone. By combining this with the line width, we can then estimate the mass of an AGN from a single spectrum (Wandel, Peterson, & Malkan 1999; Vestergaard 2002, 2004; McLure & Jarvis 2002; Kollmeier et al. 2006; Vestergaard & Peterson 2006). This has to be done carefully, however, to avoid introducing systematic errors. In the case of H, the narrow-line component of H needs to be accounted for. Blending with other lines, especially Fe ii, has to be dealt with. Also, it is important to realize that the scale factor in eq. (1) has to be appropriate for the line-width measure and type of spectrum being measured:
-
1.
As already noted, FWHM and cannot be used interchangeably; to do so introduces a bias in the mass scale, as will be described below.
-
2.
The scale factor that should be used for estimating the black hole mass from a single spectrum is not necessarily the factor determined by Onken et al. (2004); this value calibrates the black hole mass scale based on measuring in rms spectra. Typically, the variable part of the H line is about 20% narrower than the whole, uncontaminated line, thus requiring a different scale factor.
The line-width ratio is a crude parameterization of the line profile. It is trivial to show that this ratio has a value of for a Gaussian profile, which provides a good benchmark for comparison with observed values. Values of are found for profiles that are more rectangular or “boxy” than a Gaussian; values describe profiles that have narrower cores and broader wings than a Gaussian, i.e., they are “peakier” than a Gaussian. The observed values of for the mean spectra of the reverberation-mapped AGNs range from (PG 1700+518) to (Akn 120), with an average value of . Lower values are found for objects that can be classified as NLS1s or similar I Zw 1-type objects — in other words, the line width ratio seems to correlate with other properties, specifically accretion rate, although rather imperfectly (Collin et al. 2006). The important thing to note, however, is that simply substituting, say, FWHM for will systematically change the black hole mass scale for NLS1s relative to the mass scale for other reverberation-mapped AGNs.
This, of course, doesn’t tell us which line width measure is the best one to use, i.e., the one that introduces less bias relative to the “true” black hole masses. In an attempt to identify the best line-width estimator, Collin et al. (2006) performed a simple test. They divide the sample of reverberation-mapped AGNs into two subsamples based on the line-width ratio, a Population 1 with and a Population 2 with ; using the Gaussian value as the separator puts about half of the AGNs for which measurements are available in each subsample, thus enabling a separate determination of the scaling factor in eq. (1). Repeating the analysis of Onken et al. (2004) for the subsamples, using as the line-width measure, Collin et al. (2006) find that the scale factors for Populations 1 and 2 are nearly identical. On the other hand, when FWHM is used as the line-width measure, the scale factors for the two populations are quite different. They then separate the reverberation-mapped sample into two subsets on the basis of line width alone, and divide the reverberation-mapped sample into a Population A with km s-1 and Population B with km s-1 (cf. Sulentic et al. 2000). Using for the line-width measure, Collin et al. find consistent scale factors. And again, when FWHM is used as the line measure, the scale factors are inconsistent with one another. It is thus concluded that using as the line-width measure in eq. (1) gives a less-biased mass scale than using FWHM because the scale factors for the former do not depend as strongly on either line width or profile.
It is worth repeating that, like all work on the scale factor thus far, the calibration is statistical in nature and does not necessarily apply to individual sources. These statistically determined scaling factors are intended to give correct mean masses for a sample of objects: the results should be unbiased in the sense that we overestimate as many masses as we underestimate.
5.3. Can We Determine the Inclination of the BLR?
As discussed by Collin et al. (2006), there is evidence that both and are affected by both Eddington ratio and inclination of the BLR. Inclination is potentially the single largest systematic effect in measuring masses: the mass inferred will be underestimated by a factor of (where is the inclination), which is especially worrisome since unification suggests that we should see most AGNs at low inclination, at , where is the opening angle of the obscuring torus, probably in the range –.
It has been suggested by several authors (Wu & Han 2001; Zhang & Wu 2002; McLure & Dunlop 2001) that if inclination is the major systematic factor affecting reverberation masses, it might be possible to infer the inclination of the BLR by comparing the reverberation-based mass (henceforth ) with some other estimator, such as the mass predicted by the – relationship (which we will refer to henceforth as ). We would expect, for example, that at least some NLS1s or other likely low-inclination sources would have unusually small values of the ratio . As a first step in investigating this, let us consider a couple of illuminating test cases.
3C 120:
This is a particularly interesting source in this context because its inclination is constrained to be close to face-on () by the existence of a superluminal jet (Marscher et al. 2002). At an inclination of , the width of a line arising from a thin disk is so large that the reverberation-based mass ought to underpredict the true mass by an order of magnitude. This source, however, does not stand out in any way in the – relationship.
Mrk 110:
This NLS1 has an independent mass estimate based on the gravitational redshift of its strong emission lines (Kollatschny 2003b). The reverberation mass is , which is slightly larger than that predicted by the gravitational redshift, ; of course, given that a mean value of was used to compute the reverberation-based mass, these values are perfectly consistent. In contrast, the prediction of the – relationship is much smaller, . If the narrowness of the emission lines was due to inclination alone, we would expect to be larger than and closer to since neither nor are expected to be inclination-dependent.
NGC 4151:
As noted above, the reverberation and stellar dynamical masses of NGC 4151 are consistent at . The predicted mass from the – relationship is an order of magnitude smaller than this, .
These three examples all run quite counter to the expected trend if small line widths are attributable primarily to inclination effects. However, Collin et al. (2006) make a statistical argument that some objects with low values of could be low-inclination sources if there is a vertical component (i.e., along the disk axis) that also contributes to the line width: a contribution of 10–30% of the disk-plane velocity dispersion in the -direction would be consistent with the distribution of observed values.
Since doesn’t appear to be a very good predictor of inclination, we need to consider other ways to obtain even approximate measures of inclination of the BLR. Candidates include radio jets (as in the case of 3C 120), spectropolarimetry of the broad emission lines (see Lira, these proceedings), and velocity-resolved reverberation mapping, since a high-fidelity velocity–delay map should allow us to infer the inclination of the BLR directly.
6. Future Progress
As noted above, the – relationship does not appear to be a good enough predictor of AGN black hole mass to infer the inclination of the BLR in a particular AGN from . However, Collin et al. (2006) find at least a suggestion that the line-width ratio might be statistically a good predictor. Whether or not is a statistically good predictor as well (which amounts to asking whether inclination effects are even important) remains to be seen: at the present time there are simply far too few sources for which measurements are available. The prospects for getting additional measurements of are unclear; all of the “easy” sources have been done. The reverberation-mapped AGNs for which measurements are unavailable are those at redshifts where the Ca ii triplet is redshifted into the near-IR water vapor bands. Moreover, the bulge light is a proportionally smaller contributor to the total light, and the bulge is spatially less well-resolved in these more luminous, more distant AGNs, compounding the difficulty of observing the weak absorption features. We can, however, use redshifted CO transitions in the -band to measure bulge velocity dispersions, and this has been done in a few cases (e.g., Dasyra et al. 2006). However, for sources with both CO and Ca ii measurements, the agreement between them is not as good as one would hope, perhaps only because of the relatively low signal-to-noise ratios of the IR spectra at this time. Of course, prospects for improving the quality of the IR spectra are quite good as integral field units and laser adaptive optics systems are deployed on telescopes like VLT and Gemini.
Another crucial need is to obtain at least one high-fidelity velocity–delay map for at least one emission line in one AGN to serve as proof of concept. Based on years of experience in studing emission-line variability, Horne et al. (2004) carried out simulations that underscore the need for high signal-to-noise ratio (), highly homogeneous, moderate-resolution spectra, high time resolution, and a sufficiently long duration program. For typical bright Seyfert galaxies, it seems that it would be possible to obtain a good velocity-delay map of H or H based on spectra with in the range 30–100 and spectral resolution km s-1, sampled once per day for several months. While this sounds like a fairly tall order, comparison with previous reverberation-mapping campaigns reveals that this is not much beyond what has been done already: indeed, some of the better previous programs met nearly all of the criteria outlined above.
7. Conclusions
Good progress has been made in using reverberation mapping to measure BLR radii and corresponding black hole mases. Black hole masses have been measured for some three dozen AGNs; based on their scatter around the – relationship, reverberation-based masses appear to be accurate to a factor of about three. However, we find that in individual cases, the – relationship is not a particularly good predictor of black hole mass, much less inclination. We are continuing both direct and statistical tests to determine the accuracy of reverberation-based masses and to identify systematic biases.
The relatively few AGNs for which we have reverberation-based masses are a precious commodity because the data are so hard-won and because these are the direct measurements that anchor the AGN black-hole mass scale. The relationship between BLR radius and AGN continuum luminosity (Bentz et al., these proceedings) is now sufficiently well-defined, at least for the Balmer lines, that we can use the predictions with considerable confidence, provided of course that we use the correct factor to compute the masses. At the present time, it appears that the systematic uncertainties in masses based on scaling relationships are no worse than a factor of (Vestergaard & Peterson 2006).
We have also pointed out that the full potential of reverberation mapping has yet to be realized. We still have not obtained a high-fidelty velocity–delay map of even a single source, but we also note that significant improvements are certainly within reach.
Acknowledgments.
I am grateful for support of reverberation-mapping studies at Ohio State University by the US National Science Foundation through grant AST-0604066 and NASA through grant HST-AR-10691 from STScI. I thank my collaborators, particularly M.C. Bentz, S. Collin, K.D. Denney, M. Dietrich, T. Kawaguchi, C.A. Onken, R.W. Pogge, and M. Vestergaard.
References
- Bentz et al. (2006a) Bentz, M.C., et al. (2006a), ApJ, 644, 133
- Bentz et al. (2006b) Bentz, M.C., et al. (2006b), ApJ, 651, 775
- Bentz et al. (2007) Bentz, M.C., et al. (2007), ApJ, in press
- Collin et al. (2006) Collin, S., Kawaguchi, T., Peterson, B.M., & Vestergaard, M. 2006, A&A, 456, 75
- Dasyra et al. (2006) Dasyra, K.M., et al. 2006, ApJ, in press (astro-ph/0610719)
- Davies et al. (2006) Davies, R.I., et al. 2006, ApJ, 646, 754
- Denney et al. (2006) Denney, K.D., et al. 2006, ApJ, 653, 152
- Edelson& Krolik (1988) Edelson, R.A., & Krolik, J.H. 1998, ApJ, 333, 646
- Ferrarese & Merritt (2000) Ferrarese, L., & Merritt, D. 2000, ApJ, 539, L9
- Ferrarese et al. (2001) Ferrarese, L., et al. 2001, ApJ, 555, L79
- Fromerth & Melia (2000) Fromerth, M.J., & Melia, F. 2000, ApJ, 533, 172
- Gebhardt et al. (2000a) Gebhardt, K., et al. 2000a, ApJ, 539, L13
- Gebhardt et al. (2000b) Gebhardt, K., et al. 2000b, ApJ, 543, L5
- Horne et al. (2004) Horne, K., Peterson, B.M., Collier, S., & Netzer, H. 2004, PASP, 116, 465
- Kaspi et al. (2000) Kaspi, S., et al. 2000, ApJ, 533, 631
- (16) Kollatschny, W. 2003a, A&A, 407, 461
- (17) Kollatschny, W. 2003b, A&A, 412, L61
- Kollmeier et al. (2006) Kollmeier, J., et al. 2006, ApJ, 648, 128
- Koratkar & Gaskell (1991) Koratkar, A.P., & Gaskell, C.M. 1991, ApJ, 370, L61
- Krolik et al. (1991) Krolik, J.H., et al. 1991, ApJ, 371, 541
- Marscher et al. (2002) Marscher, A.P., et al. 2002, Nature, 373, 127
- McLure & Dunlop (2001) McLure, R.J., & Dunlop, J.S. 2001, MNRAS, 327, 199
- McLure & Jarvis (2002) McLure, R.J., & Jarvis, M.J. 2002, MNRAS, 337, 109
- Metzroth, Onken, & Peterson (2006) Metzroth, K.G., Onken, C.A., & Peterson, B.M. 2006, ApJ, 647, 901
- Nelson et al. (2004) Nelson, C.H., et al. 2004, ApJ, 615, 652
- Onken et al. (2002) Onken, C.A., & Peterson, B.M. 2002, ApJ, 572, 746
- Onken et al. (2004) Onken, C.A., et al. 2004, ApJ, 615, 645
- Onken et al. (2007) Onken, C.A., et al. 2007, submitted to ApJ
- Peterson & Wandel (1999) Peterson, B.M., & Wandel, A. 1999, ApJ, 521, L95
- Peterson & Wandel (2000) Peterson, B.M., & Wandel, A. 2000, ApJ, 540, L13
- Peterson et al. (1998) Peterson, B.M., et al. 1998, PASP, 110, 660
- Peterson et al. (2004) Peterson, B.M., et al. 2004, ApJ, 613, 682
- Peterson et al. (2005) Peterson, B.M., et al. 2005, ApJ, 632, 799
- Sulentic et al. (2000) Sulentic, J.W., et al. 2000, ApJ, 536, L5
- Vestergaard (2002) Vestergaard, M. 2002, ApJ, 571, 733
- Vestergaard (2004) Vestergaard, M. 2004, ApJ, 601, 676
- Vestergaard & Peterson (2006) Vestergaard, M., & Peterson, B.M. 2006, ApJ, 641, 689
- Wandel, Peterson, & Malkan (1999) Wandel, A., Peterson, B.M., & Malkan, M.A. 1999, ApJ, 526, 579
- White & Peterson (1994) White, R.J., & Peterson, B.M. 1994, PASP, 106, 879
- Wu & Han (2001) Wu, X.-B., & Han, J.L. 2001, ApJ, 561, 59
- Zhang & Wu (2002) Zhang, T.-Z., & Wu, X.-B. 2002, Chinese J. Astron. Astrophys., 2, 487