The Magnetic Topology of Coronal Mass Ejection sources
Abstract
In an attempt to test current initiation models of coronal mass ejections (CMEs), with an emphasis on the magnetic breakout model, we inspect the magnetic topology of the sources of 26 CME events in the context of their chromospheric and coronal response in an interval of approximately nine hours around the eruption onset. First, we perform current-free (potential) extrapolations of photospheric magnetograms to retrieve the key topological ingredients, such as coronal magnetic null points. Then we compare the reconnection signatures observed in the high cadence and high spatial resolution of the Transition Region And Coronal Explorer (TRACE) images with the location of the relevant topological features. The comparison reveals that only seven events can be interpreted in terms of the breakout model, which requires a multi-polar topology with pre-eruption reconnection at a coronal null. We find, however, that a larger number of events (twelve) can not be interpreted in those terms. No magnetic null is found in six of them. Seven other cases remain difficult to interpret. We also show that there are no systematic differences between the CME speed and flare energies of events under different interpretations.
I. Introduction
Coronal Mass Ejections (CMEs) are solar eruptions that expel up to 10 16 g of coronal material at speeds that range a few km s-1 to over 2000 km s-1 (e.g. Vourlidas et al., 2002; Yurchyshyn et al., 2005). Though it is clear that solar magnetic fields play an important role in confinement of plasma in the corona and the storage of free energy before a CME, developing a detailed understanding of how the evolution of the Sun’s magnetic fields can trigger the sudden release of mass and energy has proved to be very challenging. Many theories of coronal mass ejections have been proposed (see reviews Forbes, 2000; Klimchuk, 2001; Zhang & Low, 2005) that rely on different methods of energy release. Models, such as the “magnetic breakout” model (Antiochos et al., 1999; Lynch et al., 2004), the “tether cutting” model (Moore & LaBonte, 1980; Sturrock, 1989) and the “flux rope” models (e.g. Forbes & Isenberg, 1991; Lin et al., 2001; Amari et al., 2000, 2004; Török & Kliem, 2005) make specific predictions on the magnetic complexity required for an eruption and the time and location of the magnetic reconnection that either drives or results from the CME.
The breakout model requires the presence of a multi-polar magnetic configuration and reconnection at a coronal null that allows the transfer of magnetic flux between flux systems. This means that reconnection is expected above the sheared expanding arcade, just before or at the eruption, followed by the standard flare reconnection below the erupted material. The flux rope and tether cutting models, in contrast, do not require complex multi-polar fields and predict the reconnection of low-lying fields very close in time, just before or at, the onset of the CME. In these cases, the presence of a coronal null is not required, although the null can be present as a passive actor in the eruption.
Observationally, there is some evidence for both scenarios: eruptions in multi-polar active regions with an active coronal null (e.g. Aulanier et al., 2000; Sterling & Moore, 2001; Manoharan & Kundu, 2003; Gary & Moore, 2004), and eruptions in bipolar regions or even multi-polar with a passive null (e.g. Moore et al., 2001; Li et al., 2006). These studies, however, were generally limited to investigating a single event and often employed different data sets and analysis techniques.
In the present work, we perform a systematic study of a large number of events within the same analysis framework. In the high cadence and high spatial resolution images of TRACE (Transition Region And Coronal Explorer, Handy et al., 1999), we inspect the extreme ultraviolet (EUV) and ultraviolet (UV) response in a time range that spans approximately nine hours around the eruption time and analyze it in the context of potential field extrapolations of the photospheric magnetic field. The comparison allows us to determine the presence (or absence) of coronal magnetic nulls and their association with the UV-EUV response, which flux systems have an active role in the eruption, and the relevant timings for the event.
Our results indicate that, even though several eruption events can be interpreted in terms of breakout reconnection, a larger number of them do not fulfill the requirements in terms of the magnetic topology or the timing of the UV-EUV response.
The paper is subdivided into several sections. In § II we describe the data selection and the different steps in the analysis, including an illustration through two sample cases. § III introduces a summary of the results before having a closer look at specific properties, and finally in section IV we give our final remarks and conclusions.
| GOES flare | LASCO | |||||
|---|---|---|---|---|---|---|
| No. | Date | Class | Time | CME Time | Source | Ref |
| 1 | 1998/07/14 | M4.4 | 13:00 | AR8270 | 3 | |
| 2 | 1999/05/10 | M2.5 | 05:31 | 05:50 | AR8539 | 1 |
| 3 | 1999/07/19 | C4.2 | 02:13 | 03:06 | AR8631 | 1 |
| 4 | 1999/09/13 | C2.6 | 16:49 | 17:31 | AR8693 | 1 |
| 5 | 2000/06/06 | X2.3 | 15:25 | 15:54 | AR9026 | 1,2 |
| 6 | 2000/06/07 | X1.3 | 15:54 | 16:30 | AR9026 | 1 |
| 7 | 2000/07/14 | X5.8 | 10:24 | 10:54 | AR9077 | 1,2 |
| 8 | 2000/07/25 | M8.1 | 02:50 | 03:30 | AR9097 | 1 |
| 9 | 2000/09/06 | C2.2 | 15:29 | 16:30 | AR9154 | 1 |
| 10 | 2000/09/25 | M1.9 | 02:16 | 02:50 | AR9167 | 1 |
| 11 | 2000/11/24a | X2.0 | 05:02 | 05:30 | AR9236 | 1 |
| 12 | 2000/11/24b | X2.4 | 15:14 | 15:30 | AR9236 | 1,2 |
| 13 | 2000/11/24c | X1.9 | 22:00 | 22:06 | AR9236 | 1 |
| 14 | 2001/04/08 | C1.5 | 23:38 | 00:06 | AR9415 | 1 |
| 15 | 2001/04/09 | M8.0 | 15:35 | 15:54 | AR9415 | 1 |
| 16 | 2001/04/10 | X2.2 | 05:26 | 05:30 | AR9415 | 1,2 |
| 17 | 2001/04/11 | M2.4 | 13:27 | 13:32 | AR9415 | 1 |
| 18 | 2001/09/22 | C2.7 | 09:25 | 09:42 | AR9626 | 1 |
| 19 | 2001/10/19a | X1.6 | 01:05 | 01:27 | AR9661 | 1 |
| 20 | 2001/10/19b | X1.6 | 16:31 | 16:50 | AR9661 | 1,2 |
| 21 | 2001/10/25 | X1.4 | 15:03 | 15:26 | AR9672 | 1 |
| 22 | 2001/11/28 | M6.8 | 16:36 | 17:30 | AR9715 | 1 |
| 23 | 2001/12/13 | X6.1 | 14:30 | 14:54 | AR9733 | 1 |
| 24 | 2002/03/15 | M2.2 | 23:17 | 23:06 | AR9866 | 2 |
| 25 | 2002/07/15a | X3.1 | 20:07 | 20:30 | AR10030 | 1 |
| 26 | 2002/07/15b | M1.8 | 20:28 | 21:30 | AR10030 | 2 |

II. Data selection and analysis
II.1. Sample
In the present study our goal is to analyze the plasma response during the eruptions in the context of the magnetic topology of the sources. Therefore, we want to study CME sources that fulfill certain criteria. We look for identified sources of cataloged CMES; sources that have been observed in the UV-EUV at a minimum spatial and temporal resolution and are located within 400″ of disk center. These requirements are necessary to obtain reliable magnetic field extrapolations and a comprehensive understanding of the timings and locations relevant to the eruption.
Our starting working sample is the one provided by Zhou et al. (2006): a total of 288 earth-directed halo CMEs with their identified on-disk sources, observed by LASCO (Large Angle and Spectrometric Coronograph Experiment, Brueckner et al., 1995) in the interval from March 1997 to December 2003. In particular the 178 CMEs that lie in the interval between April 1998 to December 2001. We also worked with a list of 60 major solar energetic particle events of cycle 23 (Gopalswamy et al., 2004). From those two samples, we selected those events that were observed by TRACE in any of its UV-EUV passbands and were located, at the time of the eruption and observations, within 400″ of disk-center. We filtered the data further to get rid of cases with large data gaps, insufficient field of view or large and complex magnetic configurations that are difficult to handle with our Cartesian extrapolation code. In total, we selected 25 study cases, plus a well known breakout case: the 1998 July 14 event (Aulanier et al., 2000). A summary of the observations is presented in Table I. There are 18 different sources, all active regions, and some of them produce multiple events. The eruptions exhibit GOES (Geostationary Operational Environmental Satellites) flares in the range C1.5 (1-8 Å flux = 1.5 W m-2) to X5.8 (5.8 W m-2).
II.2. EUV-UV data
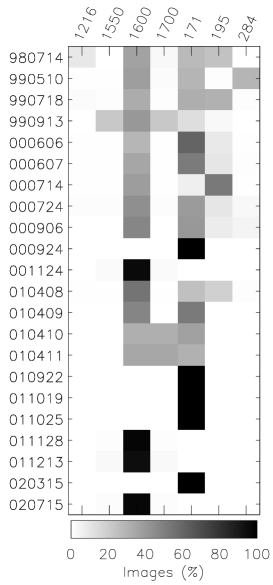
For each event, we inspected TRACE images in the 9 hour interval centered around one hour before the first observed time of the CME in LASCO. The observing programs for each event were different. The events were mostly covered with the 171 Å or the 1600 Å passband or sometimes both (see Figure 1), which correspond to plasma in the lower corona (1MK) and lower chromosphere, respectively. The observing cadence depends on the program, but typical values are of the order of a minute for the EUV images and seconds for the UV. The images were reduced using standard software and were co-aligned to the magnetograms by cross-correlating the magnitude of the magnetic flux density to the 1600 Å intensities, when available. Otherwise, EIT (Extreme-ultraviolet Imaging Telescope, Delaboudiniere et al., 1995) 171 Å images were used.
| Reconnection | Filament | ||||||||
|---|---|---|---|---|---|---|---|---|---|
| No. | Date | MP | NP | SNL | PFLR | Location | Timing | Model | eruption |
| 1 | 1998/07/14 | ✓ | ✓ | ✓ | Within fan | Fan & spine | At | • | |
| 2 | 1999/05/10 | ✓ | ✓ | ✓ | Within fan | Fan & spine | At | • | ✓ |
| 8 | 2000/07/25 | ✓ | ✓ | ✓ | Within fan | Null | At | • | U |
| 23 | 2001/12/13 | ✓ | ✓ | U | Within fan | Fan & spine | U | • | U |
| 25 | 2002/07/15a | ✓ | ✓ | ✓ | Within fan | Fan & spine | Before | • | U |
| 26 | 2002/07/15b | ✓ | ✓ | ✓ | Within fan | Fan & spine | Before | • | U |
| 18 | 2001/09/22 | ✓ | ✓ | ✓ | U (X-point) | Null | Before | • | ✓ |
| 21 | 2001/10/25 | ✓ | ✓ | ✓ | Within fan | U | U | * | U |
| 4 | 1999/09/13 | ✓ | ✓ | ✓ | Within fan | Filament† | Before | * | ✓ |
| 7 | 2000/07/14 | ✓ | ✓ | ✓ | Within fan | NL† | Before | ✓ | |
| 19 | 2001/10/19a | ✓ | ✓ | ✓ | Within fan | U | U | * | U |
| 15 | 2001/04/09 | ✓ | ✓ | ✓ | Within fan | NL† | U | U | |
| 10 | 2000/09/25 | ✓ | ✓ | ✓ | U | Spine? | At | * | U |
| 5 | 2000/06/06 | ✓ | ✓ | ✓ | U | NL† | Before† | U | |
| 6 | 2000/06/07 | ✓ | ✓ | ✓ | U | NL† | At† | ✓ | |
| 14 | 2001/04/08 | ✓ | ✓ | ✓ | U | U | U | * | U |
| 17 | 2001/04/11 | ✓ | ✓ | ✓ | U | NL† | At† | * | U |
| 3 | 1999/07/19 | ✓ | ✓ | ✓ | Outside fan | Filament†/PFLR | At | ✓ | |
| 24 | 2002/03/15 | ✓ | ✓ | ✓ | Outside fan | PFLR | After | U | |
| 11 | 2000/11/24a | ✓ | U | NL† | U | U | |||
| 12 | 2000/11/24b | ✓ | U | NL† | Before† | U | |||
| 13 | 2000/11/24c | ✓ | U | NL† | Before† | U | |||
| 16 | 2001/04/10 | ✓ | ✓ | Filament† | At† | ✓ | |||
| 20 | 2001/10/19b | ✓ | ✓ | NL | Before | ✓ | |||
| 22 | 2001/11/28 | ✓ | U | NL† | Before† | * | U | ||
| 9 | 2000/09/06 | ✓ | NL† | Before† | ✓ | ||||
Note. — MP: multipolar; NP: null point; SNL: sheared neutral line; PFLR: post-flare loop ribbons; U: unclear; NL: neutral line; : consistent with the topology and observational predicitions of the breakout model (Antiochos et al., 1999); : inconsistent with that model; : remains unclear; †: intensity enhancement, but not necessarily due to reconnection.
II.3. Magnetic field extrapolation
In order to examine the magnetic field topology of the sources, we performed potential field extrapolations, the current free case of a force-free field approximation. The method and solutions, obtained by means of Fourier transforms in a Cartesian coordinate system, can be found in Alissandrakis (1981) and Gary (1989). As boundary conditions we used the line-of-sight component of the photospheric magnetic field, as given by full disk magnetograms from MDI (Michelson Doppler Imager, Scherrer et al., 1995) for all the cases except for the July 14 1998 event in which we used a Kitt Peak magnetogram.
For each source, we selected a square field of view with sizes ranging between 350 and 480 Mm long, depending on the area occupied by the dominant active region and neighbouring flux systems. In cases where several active regions are found in close proximity, a reduced field of view can result in too localized connectivities that do not represent the interconnectivity between different regions. For those cases, several fields of view were tested, trying to reproduce the connectivities provided by a potential field source-surface model (PFSS, Schrijver & Derosa, 2003), a full Sun potential extrapolation in spherical coordinates. This model provides a better context in terms of the surrounding flux that can affect the flux systems that we are interested in. On the other hand, the resolution at smaller scales is insufficient to deal with finer structures within a single active region, which is crucial for a study like ours.
Once the full 3D magnetic field distribution is calculated, we proceed to locate coronal null points, i.e. locations where the magnetic field vanishes. Our code essentially looks for changes in the direction of the magnetic field vectors surrounding each point. When large changes in the direction of the magnetic field are found, namely a minimum in the dot product of the field vectors of two adjacent positions, we then search for nearby minima as well as for minima along field lines that pass near that point.
It is important to note that erupting systems are generally non-potential (e.g. Schrijver et al., 2005). The excess of magnetic energy is what allows the system to relax in a violent way and expel coronal mass. Therefore, we do not expect to reproduce the observed loops in detail. The non-potentiality, however, can be localized and confined to one topological domain where the field is strongly sheared. For the large scale topology, potentiality can be a fair approximation (e.g. Aulanier et al., 2000; Li et al., 2006) of the relevant topological domains and the presence of key topological ingredients like coronal null points. Null points are stable topological features and cannot be easily destroyed (Greene, 1988). A change in magnetic shear can result in a shift of its position (Demoulin et al., 1994), its height for example. We have confirmed this expected general agreement by visually comparing the loop connections in the EUV images to the flux systems result of the extrapolation. Nulls outlined in the coronal images are also found in the extrapolations, sometimes slightly shifted from their predicted position.
II.4. Analysis: Two Sample Cases
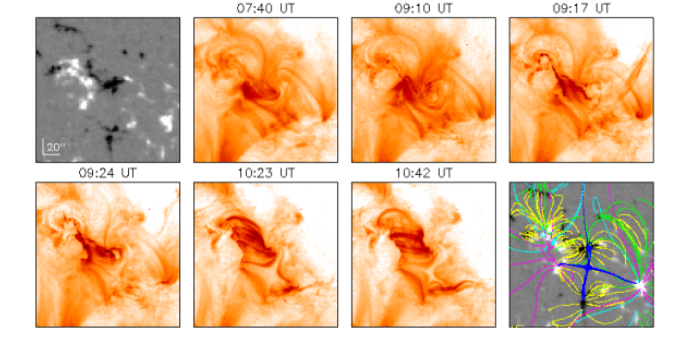
We will illustrate our strategy through two representative examples of the events in the sample. We begin with event 18 in Table I. The CME associated with this event was first seen in LASCO at 09:42 UT on September 22, 2001. A weak C2.7 GOES flare peaking at 09:25 UT was associated with it. The source is active region AR9626 which can be seen in detail in Figure 2.
Figure 2 shows the magnetic topology and the 171 Å plasma evolution during the eruption. The magnetogram on the top left corner shows in its center a leading negative (black) polarity that in the EUV images is connected to the trailing positive polarity by sheared EUV loops. The magnetic shear is obvious from the comparison of the loops across the active region neutral line (NL), seen in the 07:40 UT pre-eruption 171Å image, to the field line connectivities across that same NL in the potential extrapolation of the bottom right panel. The extrapolation shows the presence of a coronal null point, in the shape of an X (blue lines), between the edges of AR9626 and some neighbouring flux.
A close inspection of the pre-eruption NL shows highly sheared loops and absorption EUV features, typical of prominence material, from the beginning of the observational data, which in this particular case is as early as 8 hours before the eruption. The NL loops, as they slowly evolve, begin to reveal the presence of the null by outlining the top of the X (07:40 UT panel). At around 08:59 UT the expansion of the inner sheared loops becomes evident (compare with the 09:10 UT panel) and the interaction with the coronal null at around 09:13 UT produces the violent eruption (09:17 UT panel) that results in the disappearance of the outer sheared arcade and the subsequent formation of the post-flare loops (see 09:24 UT through 10:42 UT). This final and relaxed configuration is close to potential. Some of the post-eruption loops outline the null point location.
According to our introductory considerations, this is an example of breakout eruption candidate. There is an evident coronal null that becomes active before the eruption and allows reconnection to take place and open the way out to the erupting material.
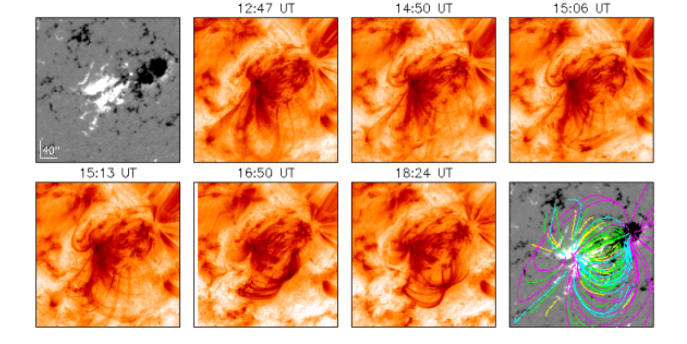
A totally different case is event 9. The CME associated to this event was first seen in LASCO at 16:30 UT on September 6, 2000. A weak C2.2 GOES flare peaking at 15:29 UT was associated with it. The source is active region AR9145 and can be seen in detail in Figure 3. Like Figure 2, it shows the magnetic topology and the 171 Å plasma evolution during the eruption. In this case, however, the source is fundamentally bipolar and there is no coronal null present in the extrapolated field. As a result, with the current analysis, the eruption can not be interpreted in terms of breakout.
At the larger scales, the magnetic field topology of the active region is close to potential even before the eruption. The large overlying loops in the 12:47 UT TRACE image show connections that are similar to the field lines in the bottom right panel. Under this arcade of loops, we find sheared structures and prominence material that appears suspended in a plane almost perpendicular to the plane of the arcade. At around 13:41 UT there is a flaring event close to the NL. Minutes later, the prominence material starts to slowly rise. In its rising phase it interacts with the overlying arcade that gets pushed aside, starting at around 14:50 UT, while the to be-erupted material makes its way up increasing its speed. Frames 15:06 UT and 15:13 UT represent that phase. The erupted plasma is seen in absorption (lighter in these reverse scale images) near the bottom of the 14:50 UT still. It is seen as a bright (dark in the image) feature in the 15:06 UT and reaches the edge of the field of view in the 15:13 UT frame. Finally, we see the formation of the post-flare loops outlining the potential topology of the bipolar source (frames at 16:50 UT and 18:24 UT).
Since this event clearly lacks a relevant null point it does not support the breakout reconnection model.
III. Results and discussion
The results of our analysis (§ II.4) of each of the 26 events presented in Table I are discussed in this section. First we summarize the results in a Table of properties, then we examine them making special emphasis in important aspects like morphology and timing. Finally, we will discuss the CME and flare properties of the events.
III.1. Summary
The results are summarized in Table 2. In the table we present a comprehensive description of properties for all the events. This is a modified version of an original table proposed in the SHINE (Solar, Heliospheric and INterplanetary Environment) meeting of 2000, as a guide to differentiate observationally between different CME models. In an attempt to classify the events by their topological properties that can help discriminate between current CME initiation models, our results remain mostly qualitative, as are the fundamental differences between these models.
In the first two columns we identify the event with a number and its date that relates them to Table I. The third and forth state if the source is multi-polar (MP) or not, and whether the erupting flux system is related to a coronal null point (NP) or not.
The next column (SNL) refers to the shear of the magnetic field near the neutral line: is it sheared with respect to a potential field? This is determined by visual inspection of TRACE movies with overlays of field lines. The field is considered sheared if the first post-flare loops are inclined with respect to the orientation of the field lines across the magnetic inversion line in the current-free model.
The sixth column (PFLR) describes the location of post-eruption ribbons with respect to the null topology (if present) and is discussed in more detail in § III.2.
The next two columns characterize the reconnection signatures in terms of location and timing with respect to the eruption. By reconnection signatures we mean a sudden EUV or UV intensity increase at the source around the time of the eruption. We use that term for simplicity and a clearer presentation. It is a matter of discussion if some of these signatures are just sudden energy depositions or density enhancements of a different origin. We assume that these brightenings are signatures of reconnection when they outline a topology that favours the reconnection, i.e. fan and spine (Lau & Finn, 1990; Priest & Titov, 1996) or classical post-flare loop reconnection, and we label the rest with † to stress that the origin could be unrelated to the reconnection of field lines. Details for each event are discussed in the appendix. Post-flare loops are seen in every case.
The next to the last column (Model) indicates our interpretation of the event. The symbol indicates that the event is consistent with the topology and observational predictions of the breakout model (Antiochos et al., 1999). An event is included in this category if, before or at the time of the eruption, there are signatures that reveal the involvement of a coronal null, namely nearly simultaneous intensity enhancements at the location of the footpoints of fan and spine loops or an obvious null activity like in AR9626. Sometimes, even if there is reconnection at the null before the eruption, it can be preceded by activity at the magnetic inversion line. For now, we will consider this fact as a property that needs further investigation, and will classify the events with null reconnection before the eruption as breakout cases. Further discussion about the timing is given in § III.2.
We label with a those events whose properties seem inconsistent with the breakout model. It can be due to the fact that a coronal null, the required condition, is not present, or if present it simply does not play a role. Finally, corresponds to those cases that, after the analysis, remain unclear in the interpretation.
Filaments are often associated with a CME, so in the last column we have also considered their association to these events. In the majority of the events we see absorptions features in EUV aligned with the neutral lines. In many cases it is unclear if the filament material gets expelled during the eruption. We have assigned a check mark to those cases in which we see considerable upward motion of absorption material.
There are several interesting results to be extracted from the table. First, all the sources but one can be considered multi-polar and the majority have sheared magnetic fields near the neutral line. The remaining cases are uncertain because we only have 1600 Å images and we can not see the loops. This common pattern gets broken once we consider the rest of the properties. A coronal null point related to flux systems involved in the eruption, is found for nineteen events (73%) and in twelve of those cases the null’s role in the eruption seems irrelevant or unclear with the current data. Overall, we end up with seven (27%) that are consistent with breakout, twelve that are not (46%) and seven (27%) that remain uncertain under the current set of observations.
III.2. A closer look: morphology and timing
The ordering of the events in Table 2 is prompted by grouping their shared properties. It is obvious that the multi-polarity (MP) and shear (SNL) are properties shared by most of the events. The absence of a coronal null groups seven of them in the bottom part, ruling them out from being considered as breakout cases. Event 22 is left uncertain for the reasons given in the appendix.
The location of the footpoints of the post-flare loops (PFLR), i.e. the TRACE 1600 Å ribbons, with respect to the location of the intersection of the fan surface with the photosphere, is another important characteristic of these events. Six of the breakout cases involve a flux system that is contained by the separatrix dome or fan surface originated at the null. Therefore the post-flare ribbons evolve within the fan in all these cases. Only one of them, event 18 depicted in Figure 2, shows a different configuration, a 3-D X-point with no clear fan and spine within the extrapolation box due to the topological symmetry of the four dominant sources. The development of the ribbons within the fan, although characteristic of the breakouts events, is not exclusive of them. It is also seen in two non-breakout cases, events 7 and 15, and three more that remain uncertain. In these cases, there is a coronal null, but there are no obvious signatures of activity there prior to the eruption.
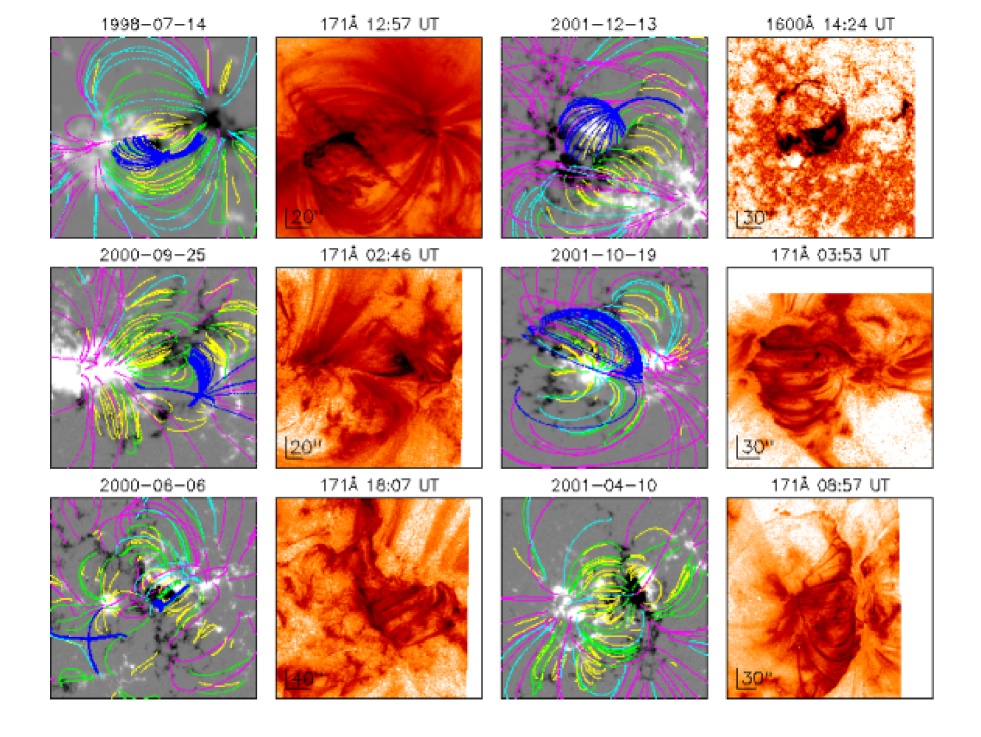
In terms of the reconnection signatures, the table shows that those events interpreted as breakout exhibit intensity enhancements related directly or indirectly, via the fan and spine, to the null. Figure 4 shows a more compact version of Figure 2 for six events. The top two panels show a brightening at the footpoints of loops that outline the spine and fan plus the flare ribbons, characteristic of the breakout cases in our study. Timing should be a constraint to decide whether this null activity is a trigger or a consequence of the eruption. To be conclusive about this aspect, however, is challenging. Even if the null signatures precede the eruption, defined as the moment in which the fields open up and the material gets expelled from the field of view, the fan and spine activity can be sometimes seen preceded by an intensity enhancement near the NL and the delay can be just a single frame in the EUV, i.e. one minute. The origin is not clear with the current set of observations. This is observed in the two examples in Figure 4: the July 14, 1998 event (event 1), a breakout example analyzed in detail by Aulanier et al. (2000), and the December 13, 2001 case (event 23).
Those events that we do not consider candidates for breakout exhibit pre-eruption activity that is unrelated to any identified coronal null. The reconnection signatures or intensity enhancements are observed near the neutral line. The most likely interpretation for some of these intensity enhancements is the standard post-flare reconnection in the form of brightenings at the footpoints of reconnected small and low-lying loops. Other seem to be aligned with structures along the neutral line, which in a few cases can be directly associated to the filament. Among the events difficult to interpret, we find brightenings at the neutral line and the filament, unclear interpretations too, but also an active null with an unresolved eruption path (event 10). In terms of timing, it still remains challenging in some cases to state if the brightenings are a trigger or a consequence of the eruption.
Therefore, we conclude that the morphology and the location of the energy deposition can be given with enough confidence as to diagnose the null’s involvement. Timing, however, remains an unresolved issue in some of the eruptions. Observations with a higher temporal cadence and a complementary side view, which will be provided by future missions, should help to resolve some of these uncertainties.
The middle panels in Figure 4 show two events that remain uncertain in our interpretation. Even though both show the presence of a coronal null in the extrapolation, a 9 minute data gap plus evident neutral line activity in the right most case (event 19) and an uncertain origin of the eruption in the left case (event 10), leave the two cases open to interpretation. Five other cases in the list are left with an uncertain interpretation due to several considerations that are summarized case by case in the appendix.
The bottom two panels of Figure 4 show two representative events, where breakout is not considered the most likely interpretation. In the right most case (event 16), we do not find a coronal null and the first signs of activity are seen at the filament. The bottom left case (event 5), shows no convincing activity at the coronal nulls, but mainly at a neutral line that is extended and not associated with a null point that would explain the magnetic flux transfer necessary for a breakout eruption.
Finally, two general remarks with respect to the topology: first, post-flare loops are consistent with the potential field connectivities in the erupting magnetic domain, expected as a result of the relaxation of the field after the eruption (see Figure 2, 3 and 4); secondly and more related to the EUV evolution, the ribbons migrate outward from the neutral line until they reach the location where the (quasi) separatrices, that encompass that particular magnetic domain, intersect the photosphere, i.e. where and when the post-flare reconnection ends in the erupting magnetic domain. The outward migration is seen for 21 (81%) cases while five cases remain unclear for observational constraints or complexity in the evolution. In two events (25 and 26) the outward migration is preceded by an inward movement toward the neutral line. In four events (2, 11, 12 and 13) the outward migration seen in the inner ribbons, close to the neutral line, is accompanied by an inward movement of outward ribbons.

III.3. Speeds and flare fluxes
One question that we can ask is this: is there any difference between the CMEs produced by the events with different interpretations? In Figure 5 we present in data points the relationship between the CME plane-of-sky speed (linear fit in LASCO images) and the GOES X-ray intensity. The different symbols have the same coding as in Table 2, with the addition of three breakout candidates from the literature (filled square and filled triangles). The correlation (Spearman’s coefficient of 0.60) between both quantities is known (Moon et al., 2002). This relationship has also been shown in the past in terms of the kinetic energy, instead of the speed. For the kinetic energy, we find a correlation of 0.59, very close to the 0.54 presented by Hundhausen (1997, see also ). In the context of the different models of CME initiation, it is important to point out that our results show no distinction in terms of energies or speeds between those events interpreted as breakout and the rest. Different observational signatures do not result in CMEs with different energetic characteristics.
In Figure 5 we also show the distribution function of speeds in our dataset (dashed line) in comparison to the log-normal distribution found by Yurchyshyn et al. (2005) for 4315 CMEs (dotted line). It clearly shows that the CME events observed by TRACE are mostly in the higher speeds tail of the distribution. The reason behind it is that TRACE observations are biased towards large flaring active regions which are often associated with fast CMEs (see Burkepile et al., 2004, and references therein). Furthermore, halo CMEs, predominant in the sample, tend to be high speed CMEs (Lara et al., 2006). This has to be taken into consideration when extracting conclusions about the whole population of CMEs from a TRACE sample.
IV. Conclusions
We have presented results from the study of 26 CME initiation events, that we have classified according to the two dominant schools of thought in CME initiation: CMEs initiated in complex topologies that require the presence of active coronal nulls, and CMEs that only require sheared fields in bipolar sources. We have found several examples that fit in the first scenario, but do not rule out the second. And most importantly, we have found a larger number of cases that do not seem to fulfill the strict requirements of the breakout model.
Our results also show that there are no systematic differences in terms of the energetics of the CME and the flare between events with different observational signatures. This, in principle, rules out a scenario with two different mechanisms operating in different energetic domains and leading to the formation of distinct types of CMEs. If several models of eruption are viable, they have to predict a similar energetic response from the CME. The alternative is that the mechanism is unique and the different observational signatures are just a reflection of a local topology.
The results are suggestive, but not conclusive. There are limitations in data (field of view, temperature coverage, projections, sampling) and techniques (oversimplified magnetic modeling) that should be addressed by future missions and studies. From the observational point of view, simultaneous coverage in 1600Å and 171Å has proved to be sufficient for this type of diagnostic, as it allows inspecting the evolution of the loops and the main footpoint activity. We should, however, not underestimate the limitations of interpreting the evolution of a 3-dimensional structure in a 2-dimensional image, mainly when that structure is developing in the direction that we do not have information about. Simultaneous side views, like the ones that STEREO will provide in the future, should help us to deal with some of the uncertainties in our study, inherent to the lack of information in the radial direction.
Acknowledgements.
This work was supported by NASA’s Living with a Star Program. We would like to thank Spiro Antiochos and Jim Klimchuk for many helpful discussions on this topic. TRACE is a mission of the Stanford-Lockheed Institute for Space Research, and part of the NASA Small Explorer program. SOHO is a project of international cooperation between ESA and NASA. Here we present some additional information on several of the events. It is not meant as a detailed description of each case, but as complementary information for those cases that deserve some extra comments outside the concise characterization of Table 2. Movies for all events can be accessed by contacting I. Ugarte-Urra..1. 1999/05/10
Cadence at the time of the eruption is of the order of 10 minutes, which limitates the conclusions. In the potential field extrapolation we do not find a point where the magnetic field completely vanishes, although we find a local minimum. Nevertheless from our inspection of the topology and the coronal images, we do believe that the coronal null is present.
.2. 1999/07/19
There are no signatures that relate the null to the eruption before it happens. The first intensity enhancements are almost simultaneously at the filament and the ribbons of post-flare loops, which are located under the spine, outside the fan.
.3. 1999/09/13
Using a high resolution MDI magnetogram as a boundary condition for the extrapolation we find a coronal null on top of the separatrix dome (fan) that encompasses the erupting flux system. Nevertheless, the first signatures of the eruption are seen as intensity enhancements at the filament that lies along the magnetic inversion line. The removal of overlying flux, very clear in this example, follows as the eruption develops.
.4. 2000/09/25
A coronal null is certainly associated with part of the post-flare loop formation and most likely to the first stages in the flare. There is no clear evidence, however, of plasma being ejected from the area, even though the EIT movie shows signatures of a global disturbance originated from that location.
.5. 2001/04/08
The CME source is correctly identified and the images show some of the typical ingredients in a classical eruption: opening of overlying fields, post-flare loop arcade. The interpretation, however, is left uncertain because the topological association between the pre-eruption activity and the erupting arcade is unclear.
.6. 2001/04/09
No signatures of null reconnection can be seen in this case. The low lying null gets outlined by post-flare loops, but its role in the first stages of the eruption is not clear. Furthermore, some of the flux systems associated with the null are too small to allow significant flux exchange.
.7. 2001/04/11
To the east side of the erupting neutral line there is an evident coronal null, both in the images and the extrapolation, that shows signatures of reconnection before the event. Nevertheless, at the time of the eruption the sudden intensity enhancements are seen at the neutral line and the footpoints of post flare loops.
.8. 2001/10/19a
There is a 9 minutes data gap at 00:50 UT, right at the moment the eruption takes place. Post-flare loops outline the separatrix dome associated with a low-lying coronal null in the west side of the erupting neutral line. Loops on the neighbourhood of the null seem to be dragged to it before the eruption, but there is no conclusive evidence of its role. Just before 00:50 UT, there is prominence material evolution and energy deposition at the neutral line.
.9. 2001/10/19b
The extrapolation code does not find a coronal point. We do however see some activity near the neutral line that could be related to a negative parasitic polarity embedded in positive flux. It seems likely that a low lying null is present at that location, but it is not found due to poor resolution. Our conclusions do not change either way.
.10. 2001/10/25
There is a 20 minute data gap at the time of the eruption that makes it difficult to extract conclusions about the reconnection signatures: timing and location. The topology is compatible with breakout.
.11. 2001/11/28
Only UV images are available. The images show continuous pre-eruption brightenings in several locations of the active region. During and after the eruption the strongest intensity enhancements are constrained to a limited area. This area is associated with the topological domain that contains flux connections between the leading positive polarity and a parasitic negative flux concentration. The configuration resembles some of the breakout cases, including a separatrix dome, however no coronal null is found in the potential extrapolation. The point with minimum field strength is very close to the bottom of the extrapolation box.
.12. 2002/03/15
At the core of the active region there is negative polarity surrounded almost completely by positive flux and trailing a leading negative polarity. A fan-spine configuration is found and activity is seen around the null with loops outlining the separatrix dome. Yet, this happens only after the eruption, being the main eruptive region the neutral line between the two dominant flux systems outside the fan. Reconnection at the null appears to be a consequence of the eruption.
References
- Alissandrakis (1981) Alissandrakis, C. E. 1981, A&A, 100, 197
- Amari et al. (2004) Amari, T., Luciani, J. F., & Aly, J. J. 2004, ApJ, 615, L165
- Amari et al. (2000) Amari, T., Luciani, J. F., Mikic, Z., & Linker, J. 2000, ApJ, 529, L49
- Antiochos et al. (1999) Antiochos, S. K., DeVore, C. R., & Klimchuk, J. A. 1999, Astrophys. J. , 510, 485
- Aulanier et al. (2000) Aulanier, G., DeLuca, E. E., Antiochos, S. K., McMullen, R. A., & Golub, L. 2000, Astrophys. J. , 540, 1126
- Brueckner et al. (1995) Brueckner, G. E., Howard, R. A., Koomen, M. J., Korendyke, C. M., Michels, D. J., Moses, J. D., Socker, D. G., Dere, K. P., Lamy, P. L., Llebaria, A., Bout, M. V., Schwenn, R., Simnett, G. M., Bedford, D. K., & Eyles, C. J. 1995, Sol. Phys., 162, 357
- Burkepile et al. (2004) Burkepile, J. T., Hundhausen, A. J., Stanger, A. L., St. Cyr, O. C., & Seiden, J. A. 2004, Journal of Geophysical Research (Space Physics), 109, 3103
- Delaboudiniere et al. (1995) Delaboudiniere, J.-P., Artzner, G. E., Brunaud, J., Gabriel, A. H., Hochedez, J. F., Millier, F., Song, X. Y., Au, B., Dere, K. P., Howard, R. A., Kreplin, R., Michels, D. J., Moses, J. D., Defise, J. M., Jamar, C., Rochus, P., Chauvineau, J. P., Marioge, J. P., Catura, R. C., Lemen, J. R., Shing, L., Stern, R. A., Gurman, J. B., Neupert, W. M., Maucherat, A., Clette, F., Cugnon, P., & van Dessel, E. L. 1995, Sol. Phys., 162, 291
- Demoulin et al. (1994) Demoulin, P., Henoux, J. C., & Mandrini, C. H. 1994, A&A, 285, 1023
- Forbes (2000) Forbes, T. G. 2000, J. Geophys. Res., 105, 23153
- Forbes & Isenberg (1991) Forbes, T. G., & Isenberg, P. A. 1991, Astrophys. J. , 373, 294
- Gary (1989) Gary, G. A. 1989, ApJS, 69, 323
- Gary & Moore (2004) Gary, G. A., & Moore, R. L. 2004, Astrophys. J. , 611, 545
- Gopalswamy et al. (2004) Gopalswamy, N., Yashiro, S., Krucker, S., Stenborg, G., & Howard, R. A. 2004, Journal of Geophysical Research (Space Physics), 109, 12105
- Greene (1988) Greene, J. M. 1988, J. Geophys. Res., 93, 8583
- Handy et al. (1999) Handy, B. N., Acton, L. W., Kankelborg, C. C., Wolfson, C. J., Akin, D. J., Bruner, M. E., Caravalho, R., Catura, R. C., Chevalier, R., Duncan, D. W., Edwards, C. G., Feinstein, C. N., Freeland, S. L., Friedlaender, F. M., Hoffmann, C. H., Hurlburt, N. E., Jurcevich, B. K., Katz, N. L., Kelly, G. A., Lemen, J. R., Levay, M., Lindgren, R. W., Mathur, D. P., Meyer, S. B., Morrison, S. J., Morrison, M. D., Nightingale, R. W., Pope, T. P., Rehse, R. A., Schrijver, C. J., Shine, R. A., Shing, L., Strong, K. T., Tarbell, T. D., Title, A. M., Torgerson, D. D., Golub, L., Bookbinder, J. A., Caldwell, D., Cheimets, P. N., Davis, W. N., Deluca, E. E., McMullen, R. A., Warren, H. P., Amato, D., Fisher, R., Maldonado, H., & Parkinson, C. 1999, Sol. Phys., 187, 229
- Hundhausen (1997) Hundhausen, A. J. 1997, in Coronal Mass Ejections: Geophysical Monograph 99, ed. N. Crooker, J. A. Josely, & J. Feynman
- Klimchuk (2001) Klimchuk, J. A. 2001, Space Weather, 125, 143
- Lara et al. (2006) Lara, A., Gopalswamy, N., Xie, H., Mendoza-Torres, E., Pérez-Eríquez, R., & Michalek, G. 2006, Journal of Geophysical Research (Space Physics), 111, 6107
- Lau & Finn (1990) Lau, Y.-T., & Finn, J. M. 1990, Astrophys. J. , 350, 672
- Li et al. (2006) Li, H., Schmieder, B., Aulanier, G., & Berlicki, A. 2006, Sol. Phys., 18
- Lin et al. (2001) Lin, J., Forbes, T. G., & Isenberg, P. A. 2001, J. Geophys. Res., 106, 25053
- Lynch et al. (2004) Lynch, B. J., Antiochos, S. K., MacNeice, P. J., Zurbuchen, T. H., & Fisk, L. A. 2004, Astrophys. J. , 617, 589
- Manoharan & Kundu (2003) Manoharan, P. K., & Kundu, M. R. 2003, Astrophys. J. , 592, 597
- Moon et al. (2002) Moon, Y.-J., Choe, G. S., Wang, H., Park, Y. D., Gopalswamy, N., Yang, G., & Yashiro, S. 2002, Astrophys. J. , 581, 694
- Moore & LaBonte (1980) Moore, R. L., & LaBonte, B. J. 1980, Solar and Interplanetary Dynamics, 207
- Moore et al. (2001) Moore, R. L., Sterling, A. C., Hudson, H. S., & Lemen, J. R. 2001, Astrophys. J. , 552, 833
- Priest & Titov (1996) Priest, E. R., & Titov, V. S. 1996, Phil. Trans. R. Soc. Lond. A, 354, 2951
- Scherrer et al. (1995) Scherrer, P. H., Bogart, R. S., Bush, R. I., Hoeksema, J. T., Kosovichev, A. G., Schou, J., Rosenberg, W., Springer, L., Tarbell, T. D., Title, A., Wolfson, C. J., Zayer, I., & MDI Engineering Team. 1995, Sol. Phys., 162, 129
- Schrijver & Derosa (2003) Schrijver, C. J., & Derosa, M. L. 2003, Sol. Phys., 212, 165
- Schrijver et al. (2005) Schrijver, C. J., DeRosa, M. L., Title, A. M., & Metcalf, T. R. 2005, Astrophys. J. , 628, 501
- Sterling & Moore (2001) Sterling, A. C., & Moore, R. L. 2001, Astrophys. J. , 560, 1045
- Sturrock (1989) Sturrock, P. A. 1989, Sol. Phys., 121, 387
- Török & Kliem (2005) Török, T., & Kliem, B. 2005, ApJ, 630, L97
- Vourlidas et al. (2002) Vourlidas, A., Buzasi, D., Howard, R. A., & Esfandiari, E. 2002, in ESA SP-506: Solar Variability: From Core to Outer Frontiers, ed. A. Wilson, 91–94
- Yurchyshyn et al. (2005) Yurchyshyn, V., Yashiro, S., Abramenko, V., Wang, H., & Gopalswamy, N. 2005, Astrophys. J. , 619, 599
- Zhang & Low (2005) Zhang, M., & Low, B. C. 2005, ARA&A, 43, 103
- Zhou et al. (2006) Zhou, G. P., Wang, J. X., & Zhang, J. 2006, A&A, 445, 1133