Behavior of X-Ray Dust Scattering and Implications for X-Ray Afterglows of Gamma-Ray Bursts
Abstract
The afterglows of gamma-ray bursts (GRBs) have commonly been assumed to be due to shocks sweeping up the circum-stellar medium. However, most GRBs have been found in dense star-forming regions where a significant fraction of the prompt X-ray emission can be scattered by dust grains. Here we revisit the behavior of dust scattering of X-rays in GRBs. We find that the features of some X-ray afterglows from minutes to days after the gamma-ray triggers are consistent with the scattering of prompt X-ray emission from GRBs off host dust grains. This implies that some of the observed X-ray afterglows (especially those without sharp rising and decaying flares) could be understood with a dust-scattering–driven emission model.
1 INTRODUCTION
Currently, the popular model for gamma-ray bursts (GRBs) and their afterglows is the fireball-shock model (for recent reviews, see Zhang & Mészáros 2004; Piran 2005; Mészáros 2006). In this model, the short-term prompt emission of GRBs is ascribed to internal shocks in the ejecta, and the long-term afterglow at lower energy is ascribed to external shocks sweeping up the circum-stellar medium. The rapid localization of the Swift Gamma-Ray Burst Explorer (Gehrels et al., 2004) has led to a recent breakthrough in the detections of early afterglows. This has given rise to theoretical studies of the early afterglow emission, especially in X-ray energy, thanks to the X-Ray Telescope (XRT) onboard Swift.
Recently, an X-ray halo around the short GRB 050724 was detected by XRT, with both a radial temporal evolution and intensity distribution that are consistent with the properties of Galactic dust-scattering (Vaughan et al., 2006). Previously, GRB 031203 (Vaughan et al., 2004) and GRB 050713A (Tiengo & Mereghetti, 2006) had also been found to have similar dust-scattered X-ray halos, as observed by XMM-Newton. In addition, a careful inspection of the XMM-Newton data shows the presence of some diffuse emission in the field of GRB 050730, which could also be produced by dust-scattering, although this needs to be verified (Tiengo & Mereghetti, 2006). Note that host galaxies have been found for some GRBs localized so far. Most of these galaxies show signs of active star formation, implying the presence of GRB progenitors forming out of dense gaseous clouds (Paczyński, 1998). Thus, dust-scattering off of dust grains may be common in GRB phenomena, which could have been playing an important role in the observed X-ray afterglows.
A diffuse X-ray halo is predicted to appear around an X-ray point source when the interstellar dust grains scatter some of the X-rays, typically by to 1∘ (Overbeck, 1965; Martin, 1970). This time-dependent information about scattering in GRBs was previously considered by Dermer et al. (1991), who assumed the existence of binary companions or accretion disks in GRB systems; a Compton echo of reflected X-ray and gamma-ray emission with a time profile mimicking the primary burst emission was expected. The features of delayed echo emission were also discussed in detail by Miralda-Escudé (1999), Mészáros & Gruzinov (2000), Madau et al. (2000), Esin & Blandford (2000), Sazonov & Sunyaev (2003) and Ramirez-Ruiz & Madau (2004) in a variety of emission geometries and ambient gas distributions around GRBs.
In this paper, the scattering of X-rays by dust grains in GRBs is revisited. We estimate the emerging flux during such an X-ray echo event, which is expected to be dominant in the X-ray afterglow. We find that an initial pulse of X-rays from a normal GRB scattering off dust grains in a host galaxy can give rise to a long-term “afterglow” with almost the same amount of energy as expected in GRB X-ray afterglows. However, the angular size of this echo emission is too small to be possibly resolved on Earth. Therefore, only the temporal features of the total scattered flux are considered here. We find that some of these features are consistent with observations of GRB X-ray afterglows. We discuss the prominent flux of X-ray echo emission in 2 and the temporal behavior in 3. We suggest in 4 that dust scattering of prompt X-ray emission off host dust grains may be an alternative explanation for some of the GRB X-ray afterglows. Our conclusions are summarized in 5.
2 TOTAL FLUX OF AN X-RAY ECHO
The quantity that we first consider is the amount of energy. This should be evaluated for the scattering effect in the context of GRBs at the first step to make sure that scattering off dust grains can viably produce a detectable X-ray afterglow. This was previously discussed by Miralda-Escudé (1999). We follow his result here.
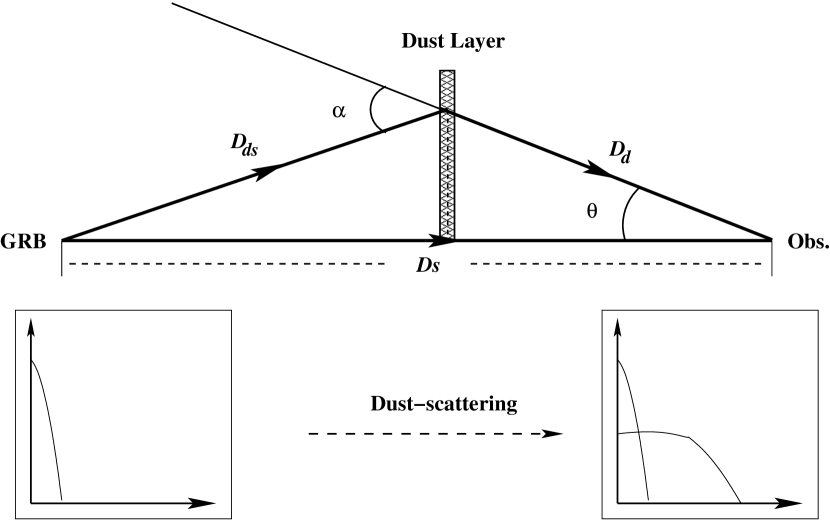
Considering a variable X-ray source at angular diameter distance , and an intervening dust layer (e.g. a galaxy or a cloud) at redshift and with angular diameter distance , the time delay of photons received at an angle from the source scattered by the dust layer is given by
| (1) |
where is the angular diameter distance from the dust layer to the source. See Figure 1 for the geometry of the scattering.
For simplicity, the variable source is assumed to emit most of its energy in a narrow energy band (e.g. 2–10 keV) with a given fluence , in a time much shorter than . Thus we can approximate the source emission as a pulse of monochromatic light with wavelength . If an experiential size distribution of grains in the intervening dust layer is assumed, i.e., , where is the scattering optical depth of dust grains with radius , the total flux of the X-ray echo due to the small-angle scattering can be estimated by
| (2) |
where is approximately satisfied, is the mean gas column density over the layer, and is the total metallicity in dust grains. Here the differential cross section is treated as an approximation of the Mie solution, which is given in the form of the “Rayleigh-Gans” approximation in 3.
Using the relation between and (eq. [1]) in equation (2) yields
| (3) |
where the echo flux is a function of the time delay . We should point out that (1) this equation is a good estimate of the flux of X-ray echoes, from which we can get a preliminary idea of how much the flux will be at a given and whether it will be detectable at the time of interest. We discuss this issue later in this section. (2) Considering the typical scattering angle implied by the value of , equation (3) is only valid before or around , where is the speed of light. (3) This equation implies that a pulse of light propagating through a dusty region will produce a long-term delayed emission, which is like an “afterglow” of this pulse (see Fig. 1). Here we call this a dust-scattering–driven afterglow. We work out its detailed light curve in 3.
Equation (3) suggests that the flux of echoes is substantially determined by the given geometry of dust scattering (i.e., , , and ) at a given time. In general, three cases should be considered.
Case (1): the dust layer is in the form of an intervening galaxy, which is also at a cosmological distance. Thus,
| (4) | |||||
where is the mean energy of the X-ray photons, Mpc, and are assumed. This X-ray echo can be much brighter than any intrinsic emission from the intervening galaxy (Miralda-Escudé, 1999). However it is below the XRT detection limit ( for a s integration time) of Swift (Gehrels et al., 2004).
Case (2): the dust scattering happens at low latitudes or in dense clouds of our Galaxy, which have been verified by observations. We can get a similar expression for the total flux of the echo
| (5) | |||||
where , , pc, and are assumed (Dickey & Lockman, 1990). The typical halo radius is about . This echo feature is quite detectable and consistent with observations (Vaughan et al. 2004, 2006). Due to the large halo radius, this case can be easily distinguished by observational analysis (Tiengo & Mereghetti, 2006).
Case (3): if the dust scattering happens in the host galaxy of a GRB at redshift , we have
| (6) | |||||
where , pc, and are assumed. This case is similar to case (2), and thus the echo emission is significantly detectable, since both cases have a similar scattering geometry, except that the halo in case (3) has a very small angular size and cannot be resolved on Earth. Obviously such a bright flux is quite comparable to those of normal X-ray afterglows (e.g. Costa 1999). We need to give a further consideration of this echo component, which may have been observed but not realized so far. In general, only the total flux of the echo emission versus time needs to be considered, due to its small angular size.
3 LIGHT CURVE OF AN X-RAY ECHO
Here, we revisit the temporal behavior of an X-ray echo event with a delayed time of minutes to days (e.g. Mészáros & Gruzinov 2000; Sazonov & Sunyaev 2003). For this purpose, we need to know the differential cross section for the small-angle scattering of X-rays off dust grains. For typical spherical grains of radius , in the limit of
| (7) |
the exact Mie solution recovers the Rayleigh-Gans approximation
| (8) |
where is the total cross section, is the wavelength of the X-ray photons, is the scaled angular coordinate, is the scattering angle, and is the first-order spherical Bessel function (Overbeck, 1965; Alcock & Hatchett, 1978; Smith & Dwek, 1998). For simplicity, our treatment takes the dust grains as Rayleigh-Gans particles (e.g. Krügel 2003) and is independent of the chemical composition or shape of the grains, as long as equation (7) holds.
3.1 Analytical Treatment in a Simple Case
For a variable X-ray source (e.g. the prompt X-ray counterpart of a GRB) at an angular diameter distance , with an unabsorbed flux as a function of time, , scattered by an intervening dust layer (which could be assumed to be in the host galaxy of a GRB with an angular diameter distance from the GRB) at an angular diameter distance with a scattering optical depth , the observed intensity of the X-ray echo is calculated by
| (9) |
where is given by equation (1), , , and are used in the small-angle limit, is the mean wavelength of X-ray photons in the dust frame, is assumed to be small, and the light that multiply scatters into the line of sight is ignored.
At first, for simplicity, we assume that does not vary with and based on the fact that the dust layer may have a small thickness (Vaughan et al. 2004, 2006). For a bursting source, most of its energy is assumed to be emitted in a narrow band on a time much shorter than , and the flux is then approximated as , where is the Dirac delta function and the source’s trigger time is taken as the time zero point. It follows from equation (9) that the total flux of the echo is analytically expressed as
| (10) |
where the function is defined as , and is defined as . Some formulae are given in the Appendix for translating the Dirac delta function of into a function of .
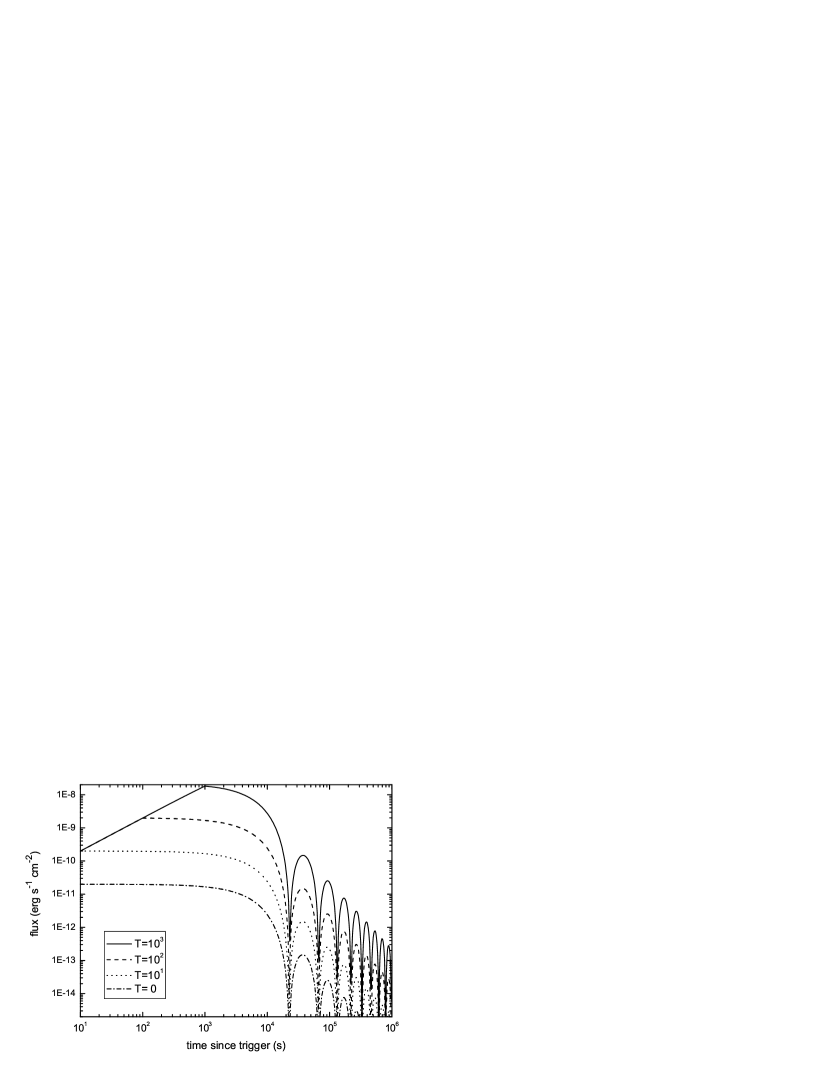
This temporal behavior is illustrated in Figure 2 with the dot-dashed line. The dust layer is assumed to be in the host galaxy, and we have , , and in Figure 2. Studies of interstellar extinction indicate that most of the grains have a size near and a distribution in a wide range (Mathis et al., 1977; Draine, 2003). Here we choose for a simple illustration. The X-rays in the range can be scattered most efficiently (Miralda-Escudé, 1999), and thus the average photon energy is used. The total X-ray fluence in the energy band from about 2 to 10 keV is given. The mean scattering optical depth is assumed in Figure 2, although is expected to be dependent on the photon energy (e. g. Mészáros & Gruzinov 2000; we account for this below).
Note that in the X-ray scattering scenario, the size of the interstellar dust grains is generally larger than the wavelength of the X-rays. As very big particles block practically all light that falls onto them, most of the scattered photons substantially originate from diffraction at their edges. The diffraction of X-rays through a dust layer causes an interferometric pattern in the differential cross section as a function of the scattering angle, as given in equation (8), only if equation (7) holds (e.g. Krügel 2003). This translates into the pattern of total flux versus time, as shown in Figure 2. The significant semi-periodic interferometric pattern indicated in these light curves reminds one of the X-ray light curve observed in some long GRBs, e.g., GRB 050904 (Watson et al., 2006; Cusumano et al., 2006). Of course, this pattern may be smoothed out in some other realistic situation, when there is a range of dust grain sizes and the total flux is detected in a finite X-ray band (e.g. keV for XRT ). This is treated in some detail in the following subsection.
The shallow decay phase shown in the light curve, which is common in the small-angle scattering scenario predicted by equation (3), can actually be attributed to the first maximum in the differential cross section peaking at a very small scattering angle, with the scaled notation (Alcock & Hatchett, 1978). The differential cross section decreases dramatically at (Alcock & Hatchett, 1978), which is translated into the decaying total flux at . After that, a fast power-law decay of the maxima (roughly ) emerges. Regardless, the small-angle approximation used here (i.e. ) is not violated throughout the whole light curve, since the scattering angle is no more than several arcminutes at a delayed time s, with pc.
Furthermore, we also consider the scattering of a constant X-ray beam emitted by the source within a time range , i.e., the flux is approximated as . The received flux can be calculated by integrating equation (9) over and . The results with different are also shown in Figure 2. The on-going flux is given, and the other parameters are not changed. The light curves due to scattering of a beam are similar to those of a pulse, except that an early rise is expected in the former case.
3.2 Numerical Treatment for a Practical Case
Above we assume a constant scattering optical depth , a grain size , and a homochromous initial fluence . In some cases , may vary as the X-ray energy changes, and the grain size may have a certain distribution. For the Rayleigh-Gans approximation, the total scattering cross section is also inferred (e.g. Mauche & Gorenstein 1986), and it is suggested by observations that (Mathis et al., 1977). Here, in our treatment with only small scattering optical depth (), we assume that
| (11) |
where is a constant in units of , is the scattering optical depth at 1 keV, , m, and m are inferred from observations (Mathis et al., 1977; Mauche & Gorenstein, 1986; Draine, 2003). Here is inferred from a single observation (Mitsuda et al., 1990) and then adopted by Mészáros & Gruzinov (2000).
An initial source spectrum should also be taken into account. In the soft X-ray band, this is given by the Band spectrum (Band et al., 1993)
| (12) |
where is a parameter in units of , and and keV are suggested by Preece et al. (2000). Thus, we can calculate the measured flux, e.g., in the keV band by XRT. Consequently,
| (13) |
Here the unabsorbed initial emission is still taken to be a pulse of light, approximately as in equation (10). In the case of a beam of light, the difference in the echo light curve is the short rising time at the beginning time (e.g., see Fig. 2).
Equation (13) can be evaluated numerically with different parameters considered. We find that the temporal behavior of significantly depends on three observable quantities of dust grains. The first quantity is the position of dust . This is because depends prominently on the position of the dust, which is inferred from equation (1). The second quantity is the maximal size of a dust grain, , which is the large-size cutoff for the size distribution. The third quantity is the index in the dependence of dust-scattering optical depth on X-ray energy.
One prominent characteristic of this temporal behavior is a distinguishable broken power law, with a break time dependent on the parameters discussed above. As shown in Figure 3, a shallow decay before the break and a slope after the break are clearly present in the light curves. The shallow decay before the break is expected from our previous discussion and roughly consistent with our estimates of small-angle scattering, shown by equation (3), while the steep decay after the break can be attributed to the quickly decreasing cross section of larger angle scattering at later times. This feature of the flux () is also implied in the previous discussion, e.g., as shown in Figure 2, which is roughly consistent with the decreasing maxima.
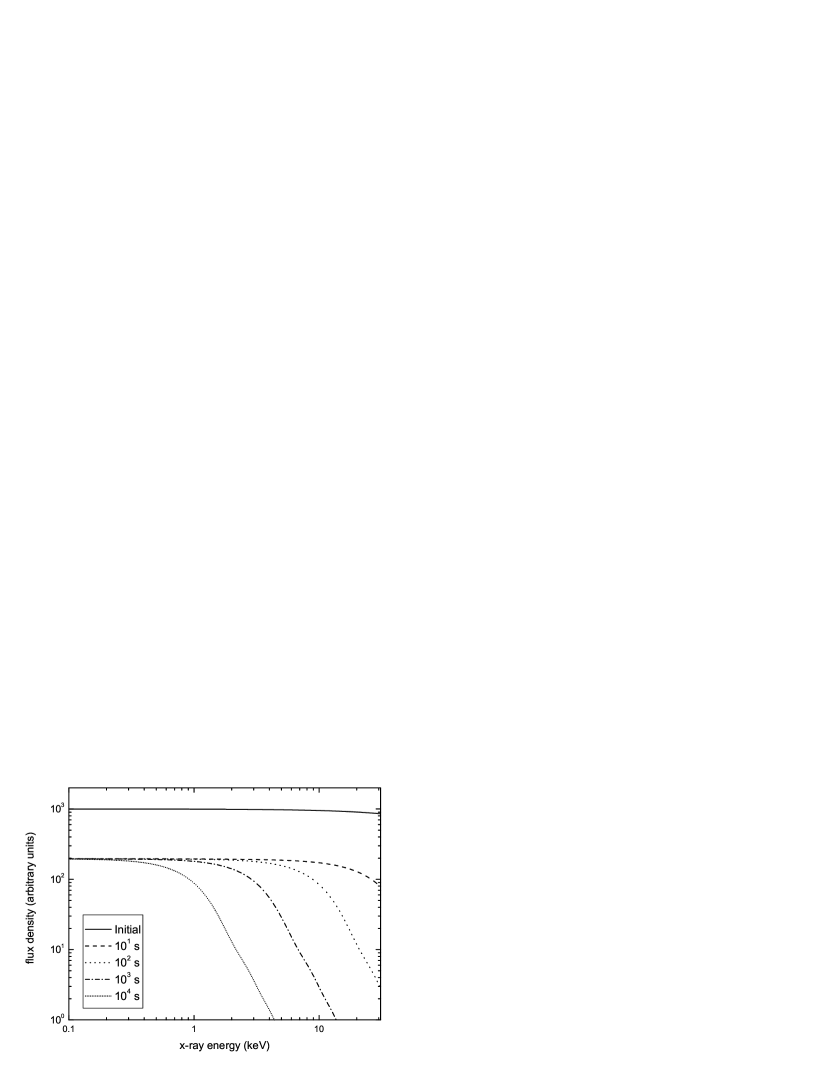
Figure 4 plots the spectral evolution during dust scattering. In general, the spectra soften as the flux decreases. The softening of the spectra can be attributed physically to the diffraction effect (treated as scattering here) which is described in the differential cross section versus scattering angle (eq. [8]). Softer X-rays tend to be scattered at a larger angle , with high-order maxima in the differential cross section, and are thus received at a larger angle , which leads to a longer arrival time due to a longer light distance (eq. [1]). Obviously, one can tell from Figure 4 that the visible softening emerges at later time when the steep decay () in the light curves shows up. This corresponds to a delayed time of , where is the Planck constant, and , , and are the equivalent average photon wavelength, energy, and dust radius, respectively.
4 IMPLICATIONS FOR X-RAY AFTERGLOWS
Above, we revisit the X-ray scattering off dust grains at GRB stages. Now we apply these results to observational data and suggest that some of the X-ray afterglows detected so far may be alternatively explained as the emission from X-ray echoes, i.e., dust-scattering–driven afterglows.
1. A shallow decay followed by a “normal” decay and a further steepening is suggested by Zhang et al. (2006) to be characteristic of almost all the GRBs. (1) In general, to account for shallow decay, a continuous activity of the GRB progenitor is expected (Dai & Lu, 1998; Zhang, & Mészáros, 2001; Dai, 2004) or a power law distribution of the Lorentz factors in the ejecta is assumed (Rees & Mészáros, 1998; Sari & Mészáros, 2000). Alternatively, we propose that this feature can be attributed to the X-ray echo emission at early times. (2) To account for the steep decay after the “normal” decay, the relativistic jet effect has been suggested (Rhoads, 1999; Sari, Piran, & Halpern, 1999). Alternatively, this feature can be explained as the X-ray echo emission at late times. To summarize, the features with a shallow decay followed by a “normal” decay and a further steepening are consistent with the X-ray echo emission presented above, e. g., as shown in Figure 3.
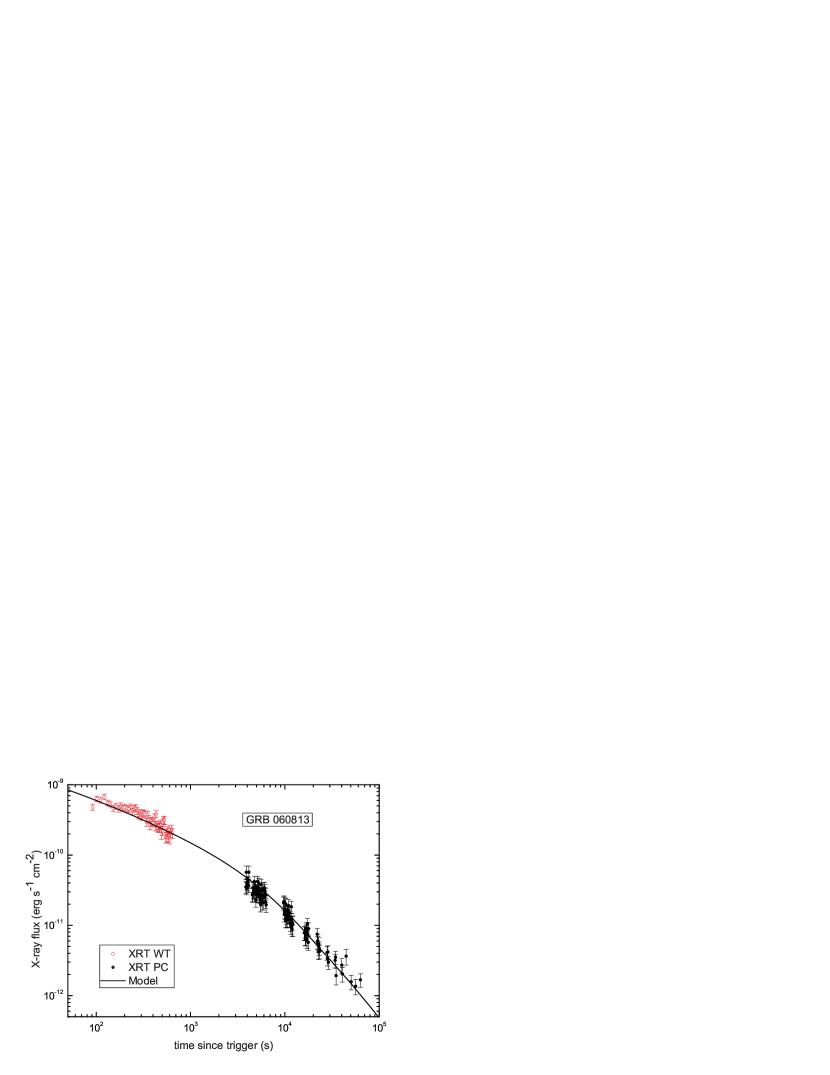
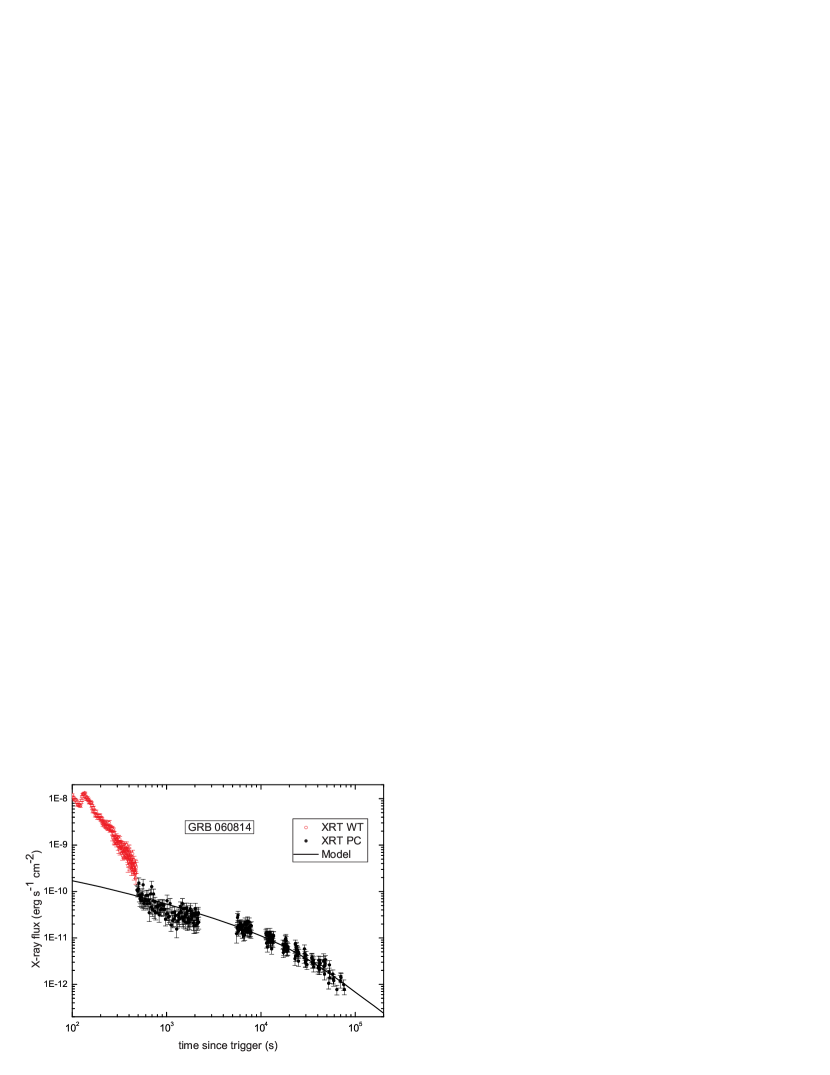
Here, we apply equation (13) to two recently detected GRBs, 060813 and 060814, in Figure 5, where and keV are assumed. The consequent parameters are and pc for GRB 060813 and and pc for GRB 060814. The other parameters, , , and , are the same for the two GRBs. Obviously, a shallow decay is common in early X-ray afterglows. This favors the dust-scattering scenario, which predicts a shallow decay at an early time, when the scattering angle is smaller (see also eq. [3]). In any case, the detailed light curve depends on several parameters that we mentioned in §3.2, and thus the early temporal index varies in a wide range, e.g., , and then steepens into at a moderate time (see also Fig. 3). Of course, as the scattering angle gets larger at later times, a further steepening of the decay () is also predicted in our calculations. Nevertheless, the steep decay () is not observed in most X-ray afterglows (Sato et al., 2007; Romano et al., 2006b). In the latter case, it may be due to a larger , which means that an echo event with a small scattering angle will take place with a longer duration, so that the shallow decay component will last a longer time, thereby preventing the emergence of a steep decay.
2. Most early X-ray light curves are found to decline rapidly in the first few minutes, with a power-law index of or greater (Tagliaferri et al., 2005; Nousek et al., 2006; Zhang et al., 2006). In general, this feature can be taken as a GRB tail emission arising from high angular latitudes (Kumar & Panaitescu, 2000). Then a break to a shallower decay component, as mentioned above, commonly shows up, which is defined as an X-ray hump by O’Brien et al. (2006). Early XRT data reveal little evidence of spectral evolution across this temporal break, but where evolution is seen, the spectrum tends to get harder (O’Brien et al., 2006; Nousek et al., 2006). Provided that the “hump” component is explained as the X-ray echo emission, this spectral feature is basically consistent with our expectation. As shown in Figure 4, the early-time spectrum of echo emission in soft X-rays would hardly change from the initial prompt spectrum. Given an intrinsic evolution of the prompt spectrum, the delayed echo spectrum can be harder than the contemporaneous tail emission in the observer’s frame.
Our model predicts that a visible spectral evolution in XRT is expected when the steep decay phase () emerges. It is worth mentioning that the Rayleigh-Gans approximation is adopted here in calculating the differential cross section. This approximation works pretty well for normal interstellar dust and energies at or above 2 keV. However, it overestimates the echo emission at lower energies (Smith & Dwek, 1998), where absorption of soft X-rays is important. This absorption effect will weaken the low-energy component in the spectra. Thus, the spectral shapes, as shown in Figure 4, have been idealized in our treatment. Regardless, a softening spectrum is expected when the steep decay phase () emerges. This feature needs to be verified by time-resolved spectral analysis, in case the steep decay phase does emerge.
3. Fluctuations or flares are observed in some GRBs (e.g. GRB 050904: Watson et al. 2006, Cusumano et al. 2006; XRF 050406: Romano et al. 2006a; GRB 060713A: Guetta et al. 2006). Generally these flares are thought to be caused by late internal shocks, similar to those that produce the prompt emission (Zhang et al. 2006; Burrows et al. 2005b; Fan & Wei 2005; Wu et al. 2005; Perna et al. 2005; Liang et al. 2006), or late external shocks (Piro et al., 2005). Both the late internal shock model and late external shock model require late-time activities of central engines (Wu et al., 2005).
Alternatively, we have three reasons suggesting that these flares, or some of them, might be due to dust-scattering:
1. Enormous flares are also observed in some GRBs (e.g. GRB 050502B: Burrows et al. 2005a; Falcone et al. 2006), which requires a more complicated theoretical explanation. However, these flares usually begin with an excess absorbing column that softens as the flare progresses. In addition, the afterglow intensity and slope are similar before and after the flare (Burrows et al., 2005a; Falcone et al., 2006). These features seem to favor the dust-scattering scenario, which does not disturb anything when it turns off. The softening feature emerges when it turns on.
2. Semi-periodic fluctuations are revealed in some GRBs (e.g. GRB 050904: Watson et al. 2006, Cusumano et al. 2006; GRB 050730: Burrows et al. 2005b), which reminds one of the interferometric pattern expected in the dust-scattering scenario under certain assumptions. Although this feature may always be smoothed out in practical cases (see 3), one can see a hint of the physics this may have unearthed.
3. Otherwise, if the dust layer is broken up or distorted by the GRB progenitor or is fluffy, as in some cases with many holes and voids (Woo et al., 1994; Mathis et al., 1995; Predehl & Klose, 1996), flares should also be expected in the echo light curves. For example, a big jump in around causes a rapid rise and a rapid decay around due to the time delay of the scattered flux introduced in equation (9), where is the angular scale from the GRB source of the fluctuation of the dust intensity in the host galaxy. In any case, we may be able to discover whether these flares are due to dust scattering, after improving our model with specific dust details.
5 CONCLUSIONS
In this paper, we revisit the X-ray dust scattering in GRBs. First, we give an estimate of the emerging flux during such an X-ray echo event, which is expected to be dominant in X-ray afterglows. We find that an initial pulse of X-rays from a normal GRB scattering off dust grains in the host galaxy can be followed by a long-term “afterglow” with almost the same amount of energy as expected in the GRB X-ray afterglows. Second, we investigate the behaviors of such an event, especially its light curves. We find that some of these features are also consistent with observations of GRB X-ray afterglows. We suggest that some of the X-ray afterglows from GRBs (especially those without sharp rising and decaying flares) can be understood in the dust-scattering–driven afterglow model. The scattering of the prompt X-ray emission from GRBs off the host dusty regions can be an alternative explanation for most of the features observed recently in X-ray afterglows by Swift XRT.
Several properties of dust grains (e. g., , and ) are supposed to be relevant for temporal behaviors of X-ray echoes. The most deterministic one is the position of dust (i.e. ), because it determines the time delay given in equation (1). However, until now, we have not known this quantity very well. Reichart (2001) assumed that there is a preburst, dense environment due to the strong winds of GRB progenitors with an inner radius of about several parsecs, while Madau et al. (2000) and Moran & Reichart (2005) suggested that this radius may be about 0.001–0.01 pc. Mészáros & Gruzinov (2000) and Sazonov & Sunyaev (2003) assumed a GRB origin at the center of a uniform dusty region with a radius of about 10–100 pc. In addition, the situation could be more complicated, with the evolution of the dust grain population considered. Waxman & Draine (2000) suggested that dust grains will be sublimated by the optical/UV flash of GRBs out to a distance of about several parsecs (see also Perna & Loeb 1998; Lazzati et al. 2001; Perna & Lazzati 2002; Heng et al. 2007). Recently, Campana et al. (2007) suggested a distance of several parsecs by analyzing the evolution of the soft X-ray absorbing column around GRB 050904. Here, we find that a of tens of parsecs is consistent with Swift GRBs, based on our dust-scattering–driven afterglow model.
It should be noted that X-ray echo emission is proposed here to be due to dust scattering taking place at a distance of tens of parsecs from the GRB source. However, in the standard external-shock model, relativistic shocks generally take place up to a distance of cm. So technically this echo scenario does not rule out the existence of emission from external shocks in both X-ray and optical/NIR bands. In addition, there is indeed some evidence for chromatic light-curve breaks, which may require that the X-ray and optical emission have different origins (Fan & Piran, 2006; Panaitescu et al., 2006; Romano et al., 2006b). Thus, there will be at least two types of X-ray afterglows if the external-shock model and the dust-scattering model are both valid.
Appendix A APPENDIX - FORMULAE FOR ANALYTICAL TREATMENT
The Dirac delta function has the following properties:
| (A1) |
| (A2) |
| (A3) |
In 3.1, is assumed for a GRB pulse. Here, the delta function of can be translated into a function of :
| (A4) | |||||
where the function is defined as , and is always positive in our treatment.
References
- Alcock & Hatchett (1978) Alcock, C., & Hatchett, s. 1978, ApJ, 222, 456
- Band et al. (1993) Band, D. L. et al. 1993, ApJ, 413, 281
- Burrows et al. (2005a) Burrows, D. N., et al. 2005a, Science, 309, 1833
- Burrows et al. (2005b) Burrows, D. N., et al. 2005b, Procs. of “The X-ray Universe” Conf., Spain (astro-ph/0511039)
- Costa (1999) Costa, E. 1999, A&AS, 138, 425
- Campana et al. (2007) Campana, S., et al. 2007, ApJ, 654, L17
- Cusumano et al. (2006) Cusumano, G., et al. 2006, Nature, 440, 164
- Dai & Lu (1998) Dai, Z. G., & Lu, T. 1998, A&A, 333, L87
- Dai (2004) Dai, Z. G. 2004, ApJ, 606, 1000
- Dermer et al. (1991) Dermer, C. D., Hurley, K. C., & Hartmann, D. H. 1991, ApJ, 370, 341
- Dickey & Lockman (1990) Dickey, J. M., & Lockman, F. J. 1990, ARA&A, 28, 215
- Draine (2003) Draine, B. T. 2003, ARA&A, 41, 241
- Esin & Blandford (2000) Esin, A. A., & Blandford, R. D. 2000, ApJ, 534, L151
- Falcone et al. (2006) Falcone, A. D., et al. 2006,ApJ, 641, 1010
- Fan & Wei (2005) Fan, Y. Z., & Wei, D. M. 2005, MNRAS, 364, L42
- Fan & Piran (2006) Fan, Y. Z., & Piran T. 2006, MNRAS, 369, 197
- Gehrels et al. (2004) Gehrels, N., et al. 2004, ApJ, 611, 1005
- Guetta et al. (2007) Guetta, D., et al. 2007, A&A, 461, 95
- Heng et al. (2007) Heng, K., Lazzati, D., & Perna, R. 2007, ApJ, in press (astro-ph/0703158)
- Kumar & Panaitescu (2000) Kumar, P., & Panaitescu, A. 2000, ApJ, 541, L51
- Krügel (2003) Krügel, E. 2003, The Physics of Interstellar Dust (Bristol and Philadelphia: Institute of Physics Publishing)
- Lazzati et al. (2001) Lazzati, D., Perna, R., & Ghisellini, G. 2001, MNRAS, 325, L19
- Liang et al. (2006) Liang, E. W., et al. 2006, ApJ, 646, 351
- Madau et al. (2000) Madau, P., Blandford, R. D., & Rees,M. J. 2000, ApJ, 541, 712
- Martin (1970) Martin, P. G. 1970, MNRAS, 149,221
- Mathis et al. (1977) Mathis, J. S., Rumpl, W., & Nordsieck, K. H. 1977, ApJ, 217, 425
- Mathis et al. (1995) Mathis, J. S., et al. 1995, ApJ, 449, 320
- Mauche & Gorenstein (1986) Mauche, C. W., & Gorenstein, P. 1986, ApJ, 302, 371
- Mészáros & Gruzinov (2000) Mészáros, P., & Gruzinov, A. 2000, ApJ, 543, L35
- Mészáros (2006) Mészáros, P. 2006, Rept. Prog. Phys., 69, 2259
- Miralda-Escudé (1999) Miralda-Escudé, J. 1999, ApJ, 512, 21
- Mitsuda et al. (1990) Mitsuda, K., Takeshima, T., & Kii, T. 1990, ApJ, 353, 480
- Moran & Reichart (2005) Moran, J. A., & Reichart, D. E. 2005, ApJ, 632, 438
- Nousek et al. (2006) Nousek, J. A., et al. 2006, ApJ, 642, 389
- Overbeck (1965) Overbeck, J. W. 1965, ApJ, 141, 864
- O’Brien et al. (2006) O’Brien, P. T., et al. 2006, ApJ, 647, 1213
- Paczyński (1998) Paczyński, B. 1998, ApJ, 494, L45
- Panaitescu et al. (2006) Panaitescu, A., et al. 2006, MNRAS, 369,2059
- Perna & Loeb (1998) Perna, R., & Loeb, A. 1998, ApJ, 501, 467
- Perna & Lazzati (2002) Perna, R., & Lazzati, D. 2002, ApJ, 580, 261
- Perna et al. (2006) Perna, R., Armitage, P. J., & Zhang, B. 2006, ApJ, 636, L29
- Piran (2005) Piran, T. 2005, Rev. Mod. Phys., 76, 1143
- Piro et al. (2005) Piro, L. et al. 2005, ApJ, 623, 314
- Predehl & Klose (1996) Predehl, P., & Klose, S. 1996, A&A, 306, 283
- Preece et al. (2000) Preece, R. D., et al. 2000, ApJS, 126, 19
- Ramirez-Ruiz & Madau (2004) Ramirez-Ruiz, E., & Madau, P. 2004, ApJ, 608, L89
- Rees & Mészáros (1998) Rees, M., & Mészáros 2001, P. 1998, ApJ, 496, L1
- Reichart (2001) Reichart, D. E. 2001, ApJ, 554, 643
- Rhoads (1999) Rhoads, J. E. 1999, ApJ, 525, 737
- Romano et al. (2006a) Romano, P. et al. 2006a, A&A, 450, 59
- Romano et al. (2006b) Romano, P. et al. 2006b, A&A, 456, 917
- Sari, Piran, & Halpern (1999) Sari, R., Piran, T., & Halpern, J. P. 1999, ApJ, 519, L17
- Sari & Mészáros (2000) Sari, R., & Mészáros, P. 2000, ApJ, 535, L33
- Sato et al. (2007) Sato, G., et al. 2007, ApJ, 657, 359
- Sazonov & Sunyaev (2003) Sazonov, S. Y., & Sunyaev, R. A. 2003,A&A, 399, 505
- Smith & Dwek (1998) Smith, R. K., & Dwek, E. 1998, ApJ, 503, 831
- Tagliaferri et al. (2005) Tagliaferri, G., et al. 2005, Nature, 436, 985
- Tiengo & Mereghetti (2006) Tiengo, A., & Mereghetti, S. 2006, A&A, 449, 203
- Vaughan et al. (2004) Vaughan, S., et al. 2004, ApJ, 603, L5
- Vaughan et al. (2006) Vaughan, S., et al. 2006, ApJ, 639, 323
- Watson et al. (2006) Watson, D., et al. 2006, ApJ, 637, L69
- Waxman & Draine (2000) Waxman, E., & Draine, B. T. 2000, ApJ, 537, 796
- Woo et al. (1994) Woo, J., et al. 1994, ApJ, 436, L5
- Wu et al. (2005) Wu, X. F., et al. 2005, ApJ, submitted, astro-ph/0512555
- Zhang, & Mészáros (2001) Zhang, B., & Mészáros, P. 2001, ApJ, 552, L35
- Zhang, & Mészáros (2004) Zhang, B., & Mészáros, P. 2004, Int. J. Mod. Phys. A, 19, 2385
- Zhang et al. (2006) Zhang, B., et al. 2006, ApJ, 642, 354