Discovery of Probable Relativistic Fe Emission and Absorption in the Cloverleaf Quasar H 1413+117
Abstract
We present results from Chandra and XMM-Newton observations of the low-ionization broad absorption line (LoBAL) quasar H 1413+117. Our spatial and spectral analysis of a recent deep Chandra observation confirms a microlensing event in a previous Chandra observation performed about 5 years earlier. We present constraints on the structure of the accretion flow in H 1413+117 based on the time-scale of this microlensing event.
Our analysis of the combined spectrum of all the images indicates the presence of two emission peaks at rest-frame energies of 5.35 keV and 6.32 keV detected at the 98% and 99% confidence levels, respectively. The double peaked Fe emission line is fit well with an accretion-disk line model, however, the best-fitting model parameters are neither well constrained nor unique. Additional observations are required to constrain the model parameters better and to confirm the relativistic interpretation of the double peaked Fe K line. Another possible interpretation of the Fe emission is fluorescent Fe emission from the back-side of the wind. The spectra of images C and D show significant high-energy broad absorption features that extend up to rest-frame energies of 9 keV and 15 keV respectively. We propose that a likely cause of these differences is significant variability of the outflow on time-scales that are shorter than the time-delays between the images.
The Chandra observation of H 1413+117 has made possible for the first time the detection of the inner regions of the accretion disk and/or wind and the high ionization component of the outflowing wind of a LoBAL quasar.
1 INTRODUCTION
The broad X-ray absorption lines produced by outflowing material detected recently in two broad absorption line (BAL) quasars possibly probe a highly ionized, high velocity component of the wind that appears to be distinct from the absorbers detected in the optical and UV wavebands (e.g., Chartas et al. 2007). Because of the limited number of BAL quasars bright enough to allow X-ray spectroscopy of their broad absorption lines, the general X-ray properties of the outflows in such objects are poorly constrained. The two X-ray brightest quasars with detected X-ray BALs are APM 08279+5255 ( = 3.91; Chartas et al., 2002) and PG1115+080 ( = 2.72; Chartas et al. 2003). Order of magnitude estimates of the mass outflow rates in these objects (Chartas et al. 2007) imply rates that are comparable to the estimated accretion rates of a few Myr-1 and are considerably higher than those derived from observations of UV BALs. The fraction of the total bolometric energy released by these two quasars into the IGM in the form of kinetic energy (hereafter referred to as outflow efficiency) is constrained to be , and , respectively. The main reason for the significantly higher outflow efficiencies of the X-ray absorbing material compared to the UV absorbing material in these objects is the significantly higher outflow velocities of the X-ray absorbing wind, reaching 0.4 coupled with the fact that . Our derived estimates of the efficiency of the outflows in BAL quasars PG 1115+080 and APM 08279+5255, when compared to values predicted by recent models of structure formation [e.g., Scannapieco & Oh 2004 (SO04); Granato et al. 2004 (G04); Springel, Di Matteo, & Hernquist 2005 (SDH05); Hopkins et al. 2005, 2006], imply that these winds will have a significant impact on shaping the evolution of their host galaxies and in regulating the growth of the central black hole. The outflowing X-ray absorbing material is likely launched from the accretion disk. The high outflow velocities, the high ionization and the rapid flux variability of the X-ray BALs in APM 08279+5255 and PG 1115+080 indicate that the launching radius is close to the last stable orbit of the black hole (Chartas et al. 2002; 2003). Fe K emission originating from the accretion disk was not detected in the X-ray spectra of APM 08279+5255 and PG 1115+080. This is not surprising since the equivalent width of the Fe K line for the X-ray luminosities of these objects is expected to be 200 eV (e.g., Nandra et al. 1997) which is below the detection limit of these observations. Part of the difficulty of detecting the Fe K line in quasars arises from the significant dilution of the reprocessed emission from the disk by the emission from the primary X-ray source (presumably the hot corona overlaying the inner disk that up-scatters the soft, thermal photons from the disk). The equivalent width of the Fe line in quasars has also been observed to be inversely proportional to luminosity (e.g., Nandra et al. 1997). One possible explanation is that the disk density is reduced for more luminous quasars and recent work indicates that it is proportional to 1/L (see Krolik 1998 eqn. 7.74). The reduction of the disk density in luminous quasars will result in a higher ionization parameter in the surface layers of the disk causing a lower equivalent width for neutral iron line emission, although leading to other features (e.g., Reynolds & Nowak 2003).
Direct emission from the central X-ray source is thought to be significantly absorbed by an outflowing wind in a class of objects known as low ionization broad absorption line (LoBAL) quasars. A recent BeppoSAX observation of the LoBAL quasar Mrk 231 (Braito et al. 2004) confirmed the presence of a Compton thick absorber in this object with a column density of 2 1024 cm-2. Another member of this rare class is the gravitationally lensed = 2.56 quasar H 1413+117 (the Cloverleaf quasar). A recent 38 ks Chandra observation of H 1413+117 taken in 2000 April revealed a remarkable iron emission feature (Oshima et al. 2001; Gallagher et al. 2002), which was interpreted as Fe K fluorescence from the far side of the quasar outflow. Our re-analysis of the Cloverleaf data (Chartas et al. 2004) indicated that the Fe K line was only significant in the brighter image A. We also found that the Fe K line and the continuum were enhanced by different factors. A microlensing event could explain both the energy-dependent magnification and the significant detection of Fe K line emission in the spectrum of image A only. In the context of this interpretation we provided constraints on the spatial extent of the inferred scattered continuum and reprocessed Fe K line emission regions in a low-ionization broad absorption line quasar. From our analysis of the 38 ks Chandra observation of H 1413+117 we predicted that a follow-up observation would show the following, if microlensing was affecting image A:
(a) A reduction of the magnification of the X-ray continuum flux of image A as the microlensing caustic traverses the accretion disk. Once the microlensing event is complete the X-ray flux ratios of the images should become similar to the optical flux ratios in the and bands, which are less sensitive to microlensing due to the larger sizescales of the and emission regions compared to the X-ray emission region.
(b) A reduction in the Fe K line flux as the microlensing caustic sweeps across the accretion disk and outflowing wind.
In this work we present the results from a deeper 89 ks follow-up observation of H 1413+117 and revisit our microlensing interpretation of the magnification event in image A. The deeper observation allows us to analyze of the spectra of individual images. The spectra show broad absorption features bluewards of the rest-frame energy of 6.4 keV and two remarkable emission line features redwards of this energy. In the discussion section we present plausible interpretations of the properties of the emission and absorption features. We have also analyzed two XMM-Newton observations of H 1413+117 taken between the two Chandra ones. The XMM-Newton observations do not resolve the lensed images but allow us to monitor the variability of the combined spectrum of all images of H 1413+117. Throughout this paper we adopt a -dominated cosmology with = 70 km s-1 Mpc-1, = 0.7, and = 0.3. The luminosity distance to H 1413+117 in this cosmology is 21 Gpc. The luminosity distance estimate is taken from Caroll, Press, & Turner (1992) and is based on the Friedman-Robertson-Walker model.
2 OBSERVATIONS AND DATA ANALYSIS
H 1413+117 was observed with the Advanced CCD imaging Spectrometer (ACIS; Garmire et al. 2003) on board the Chandra X-ray Observatory (hereafter Chandra) on 2000 April 19 and 2005 March 30 for 38.2 ks and 88.9 ks, respectively. It was also observed with XMM-Newton (Jansen et al. 2001) on 2001 July 29 and 2002 August 2 for 19.2 ks and 23.5 ks, respectively. The spectral analysis of the Chandra April 2000 observation of H 1413+117 was presented in Oshima et al. (2001), Gallagher et al. (2002), Chartas et al. (2004) and Dai et al. (2004). Because of significant improvements in the calibration of the instruments on board Chandra since the publication of these results, we have re-analyzed this observation. Updates on the calibration of Chandra and XMM-Newton are reported on the Chandra X-ray Center (CXC) and XMM-Newton Science Operations Centre (SOC) World Wide Web (WWW) sites, respectively. 111The CXC and SOC WWW sites are located at http://asc.harvard.edu/ciao/releasenotes/history.html and http://xmm.vilspa.esa.es/external/xmm_sw_cal/calib/rel_notes/index.shtml, respectively.
The Chandra observations of H 1413+117 were analyzed using the standard software CIAO 3.3 provided by the CXC. For the reduction we used standard CXC threads to screen the data for status, grade, and time intervals of acceptable aspect solution and background levels. The pointings of the observatory placed H 1413+117 on the back-illuminated S3 chip of ACIS. To improve the spatial resolution we removed a 025 randomization applied to the event positions in the CXC processing and employed a sub-pixel resolution technique developed by Tsunemi et al. (2001) and later improved by Mori et al. (2001).
We analyzed the XMM-Newton data for H 1413+117 with the standard analysis software SAS version 6.5 provided by the XMM-Newton SOC. We filtered the PN (Strüder et al. 2001) and MOS (Turner et al. 2001)
data by selecting events with PATTERNS
in the 0–4 and 0–12 ranges, respectively.
Several moderate-amplitude background flares were present
during the XMM-Newton observations of H 1413+117.
The PN and MOS data were filtered to exclude times when the full-field count rates
exceeded 20 s-1 and 4 s-1, respectively.
A log of the Chandra and XMM-Newton observations of H 1413+117 observations that includes observation dates, observed count rates, total exposure times, and observational identification numbers is presented in Table 1.
In both the Chandra and XMM-Newton analyses we tested the sensitivity of our results
to the selected background and source-extraction
regions by varying the locations of the background regions and varying the
sizes of the source-extraction regions. We did not find any significant change in the
background-subtracted spectra.
As we describe in §2.2, §2.3 and §2.4 the Chandra and XMM-Newton spectra of H 1413+117 were fitted with a variety of models
employing XSPEC version 12 (Arnaud 1996).
In all models
we included Galactic absorption due to neutral gas with a
column density of =1.82 1020 cm-2 (Dickey & Lockman, 1990). Falco et al. (1999) give a total extinction of 0.22 0.04 mag for the lensing galaxy and Dai et al. (2006) estimate a dust-to-gas ratio of
E()/ = (1.4 0.5) 10-22 mag cm2 for the lens.
Based on these results we estimate the column density of the lens
to be 1.5 1021.
We conclude that the absorption from the lens does not have any significant
effect on the spectral modeling of H 1413+117 since
the intrinsic absorption is significantly larger with a column density of
= 1–10 1023 (see §2.2 and §2.3).
All quoted errors are at the 90% confidence level unless mentioned otherwise.
Due to the poorer S/N of the XMM-Newton spectra of H 1413+117 all
errors on parameters obtained from fits to these spectra
are quoted at the 68% confidence level.
2.1 Spatial Analysis of the Chandra observation of H 1413+117.
To estimate the X-ray flux ratios of H 1413+117 we modeled the 89 ks Chandra images of
A, B, C and D, with
point-spread functions (PSFs) generated by the simulation tool MARX (Wise et al. 1997).
The X-ray event locations were binned with a bin-size of 00246 to sample the PSF
sufficiently (an ACIS pixel subtends 0491).
The simulated PSFs were fitted to the Chandra data by minimizing the
-statistic formed between the observed and simulated images
of H 1413+117.
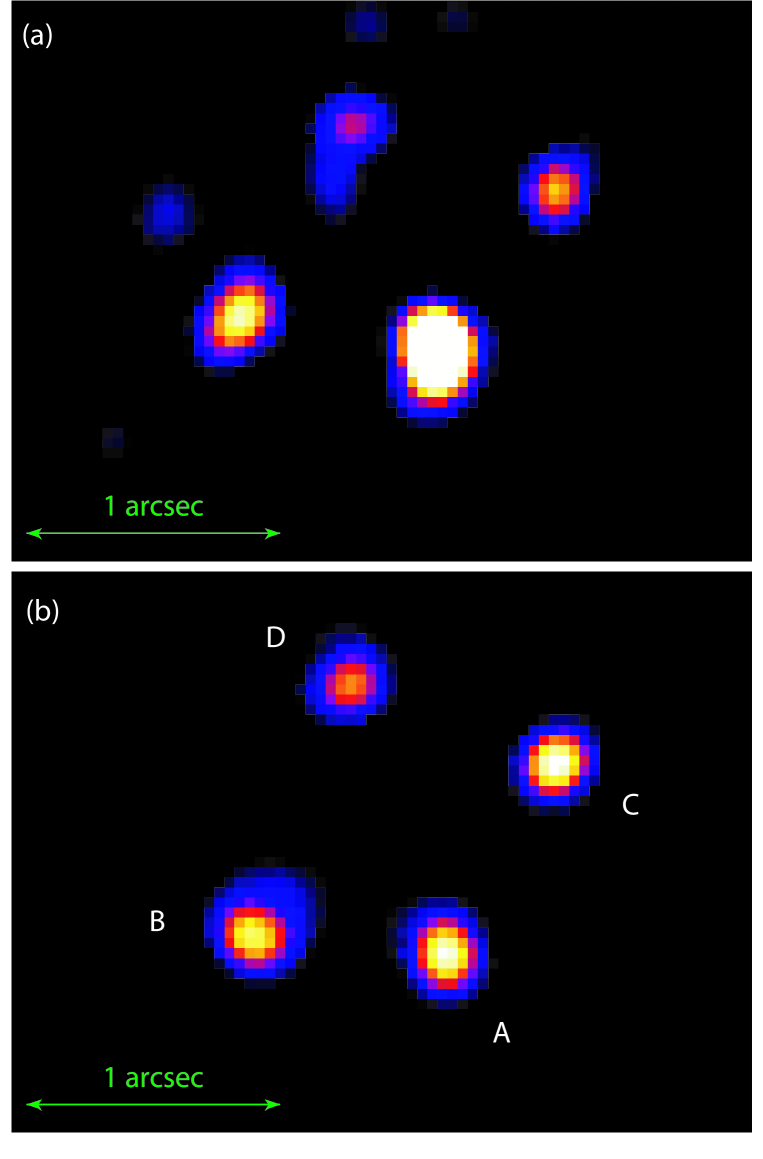
In Figure 1a,b we show the Lucy-Richardson deconvolved images in the 0.2–8 keV
bandpass of the 38 ks and 89 ks Chandra observations, respectively.
We find that the X-ray flux ratios in the full (0.2-8keV) band for the 89 ks observation of H 1413+117 in March 2005 are [B/A]full = 1.02 0.12, [C/A]full = 0.82 0.11, [D/A]full = 0.71 0.09 and the number of detected X-ray events in images A, B, C, and D were 160 13, 163 13, 131 12, and 114 11, respectively. The X-ray flux ratios in the full (0.2-8keV) band for the 38 ks observation of H 1413+117 in April 2000 are [B/A]full = 0.49 0.08, [C/A]full = 0.35 0.07, [D/A]full = 0.37 0.07 and the number of detected X-ray events in images A, B, C, and D were 147 13, 72 10, 52 8, and 54 9, respectively.
For comparison the HST WFPC2 -band flux ratios are [B/A]F702W = 0.87 0.02, [C/A]F702W = 0.77 0.01, [D/A]F702W = 0.72 0.01. The HST WFPC2 -band observations were taken in 1994 December (Turnshek et al. 1997). The HST WFPC2 band is centered at 6919 Å with a bandwidth of 1385 Å and represents a wide -band.
We find that the X-ray flux ratios have varied significantly between the two Chandra observations. The X-ray flux ratios for the 2005 observation of H 1413+117 are consistent with the -band flux ratios. The 0.2-8 keV count-rate of image A decreased by a factor of 2.1 while the 0.2-8 keV count-rates of the other images remained the same within errors between the 2000 and 2005 Chandra observations.
The full-band flux fractions of image A, [A/(B+C+D)], during the 38 ks and 89 ks Chandra observations are 0.83 0.10 and 0.39 0.04. For comparison the flux fraction of image A in the HST WFPC2 -band is 0.42 0.01.
2.2 Spectral Analysis of the Individual Images of the Chandra observation of H 1413+117.
We performed fits to the spectra of individual images of H 1413+117 with a variety of models of increasing complexity. We used events with observed-frame energies lying within the range of 0.4–8 keV. Due to the moderate S/N of the spectra we performed these fits using the Cash statistic which does not require binning of the data. For comparison we also performed the spectral fits using the statistic and found similar results. Our first model consisted of Galactic absorption and a simple power-law. The best-fit parameters of this model are presented in Table 2 (model 1). These fits are unacceptable in a statistical sense and the fit residuals show significant absorption at observed-frame energies of 2–5 keV and emission at observed-frame energies of 1–2 keV.
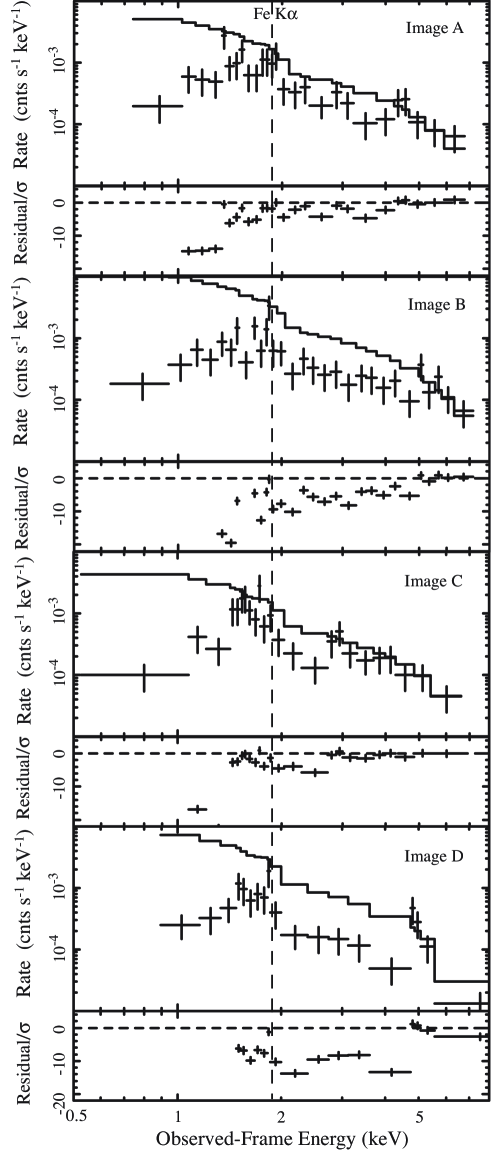
To illustrate better the possible presence of broad absorption features and emission lines we fitted the spectra of the individual images of H 1413+117 in the observed-frame energy bands of 4.5–8 keV for image A, 5–8 keV for image B, 3–8 keV for image C and 4–8 keV for image D, with simple power-law models modified by Galactic absorption and extrapolated these models to lower energies. The fits to the spectra of individual images and the residuals of these fits are shown in Figure 2. We indicate the expected location of the Fe K emission line in these spectra and note that the possible broad absorption extends considerably above this energy. We note that the fits to the high-energy range of the individual spectra are only used to qualitatively show the possible presence of absorption and emission features. The significance of absorption and emission features in the individual spectra is estimated later in this section with fits to the observed-frame energy band of 0.4–8. keV. The spectrum of image D shows an abrupt discontinuity in flux near a rest-frame energy of 15 keV. Background contamination and instrumental effects are ruled out as the origin of this feature for the following reasons: (a) The background event rates in the 0.2–10. and 4.–6. keV bands in the spectrum of image D are 7.2 10-6 and 4.5 10-7, respectively compared to source event-rates of 1.1 10-3 and 1.7 10-4 in these bands. Any background feature would also have to appear in all images due to their close proximity. (b) The ACIS response does not have any significant discontinuities in this energy range and any instrumental effect would have to appear in all images which is not the case. A discontinuity in flux is also detected in the spectrum of image C, near a rest-frame energy of 9 keV. The residual plots also suggest possible Fe K emission lines in the spectrum of image C, near a rest-frame energy of 5.4 keV, in the spectrum of image A at rest-frame energies of 5.4 keV and 6.25 keV and in the spectrum of image D at a rest-frame energy of 5.4 keV. These emission lines are more evident in the combined spectrum of all the images shown in Figure 3.
As a refinement to our model we next included a neutral absorber at the redshift of the source (hereafter referred to as model 2 in Table 2). The fits are significantly improved with the addition of an intrinsic neutral absorber with best-fit column densities ranging between 9 1022 cm-2 for image B and 29 1022 cm-2 for image C (see model 2 in Table 2). The best-fit spectral indices range between = 0.9 for image B and = 1.9 for image C.
Later in the section we provide an estimate of the significance of the absorption and emission features in images C and D suggested in the residual plots of Figure 2. Fits to the spectra of images C and D that model the high-energy absorption above the rest-frame energy of 6.4 keV with an absorption edge or single broad absorption line cannot successfully reproduce the abrupt apparent changes in flux at the rest-frame energies of 9 keV and 15 keV, respectively. We proceeded to model the spectra of images C and D with more complex models motivated by our current understanding of the structure of LoBAL quasars (e.g., Green et al. 2001; Gallagher et al. 2002).
The next model considered (referred to as model 3 in Table 2) consists of Galactic absorption, a power-law continuum modified by intrinsic neutral absorption, a notch representing a saturated high-energy absorption line representing the X-ray BAL, and a Gaussian emission line. The saturated absorption line model assumes absorption centered at energy and within the energy range of /2 the normalized intensity is equal to , where is the covering fraction. 222The covering factor, , effectively represents the fraction of photons from the background source(s) that pass through the absorber. Fits to the spectra of images C and D using model 3 in Table 2 resulted in a significant improvement in fit quality compared to fits using model 2 in Table 2. In particular, the -test indicates that fits to the spectra of images C and D using model 3 in Table 2 resulted in an improvement of the fits compared to fits with model 2 in Table 2 at the 95% and 94% confidence levels, respectively.
We also tried more sophisticated models (referred to as models 4 and 5 in Table 2) that consist of Galactic absorption, direct emission from a power-law modified by intrinsic neutral absorption, a saturated high-energy absorption line to account for the X-ray BALs, scattered emission of a power-law assuming simple Thomson scattering to account for possible scattering of the central source emission from the outflowing wind, and a fluorescent Fe K line from an accretion disk around the black hole. We used Fe K line models that consider accretion onto a non-spinning (e.g., Fabian et al. 1989; model 4 of Table 2) and spinning black hole (e.g., Laor et al. 1991; model 5 of Table 2).
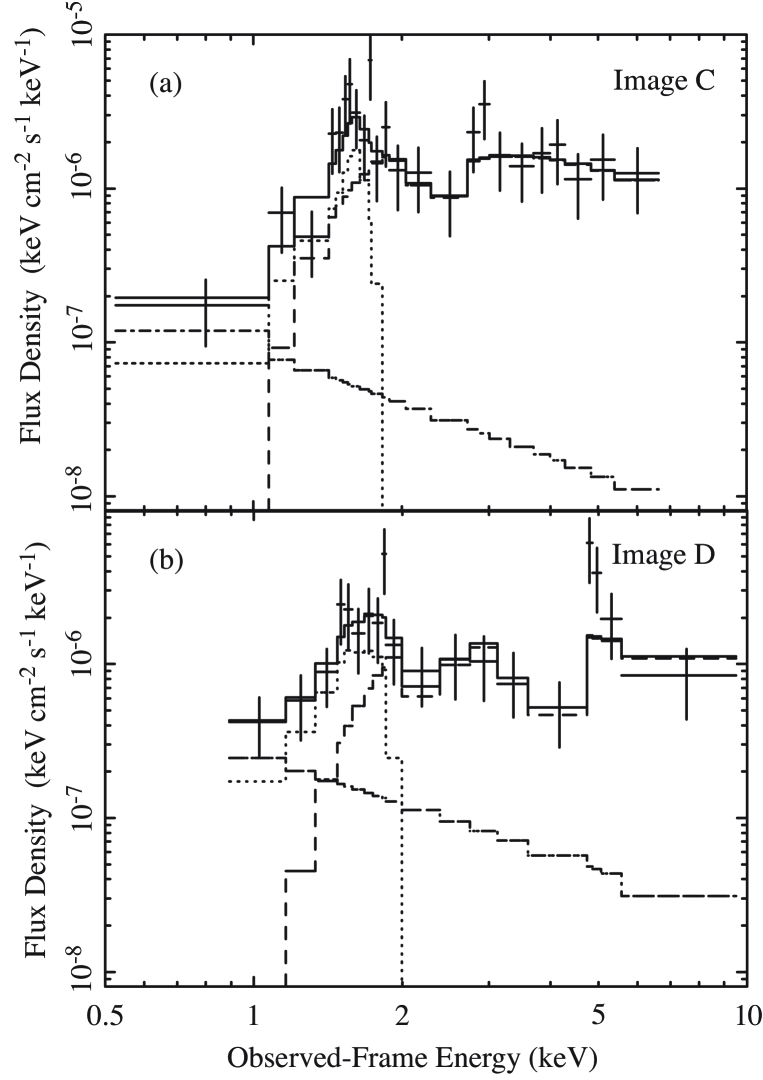
Fits to the spectrum of image C using model 4 in Table 2 did not result in a significant improvement in fit quality compared to fits using model 2 in Table 2 (see Figure 4a). Specifically, the -test indicates a model that included an accretion-disk Fe K line at 6.4 keV and a saturated absorption line centered at a rest-frame energy of 8.5 0.2 keV(68%) with rest-frame width of = 0.5 keV(68%) resulted in a marginal improvement of the fit compared to fits with model 2 in Table 2 at the 82% confidence level. The best-fit parameters are listed in Table 2. Fits to the spectrum of image D using model 4 or model 5 that included an accretion-disk Fe K line at 6.4 keV and a saturated absorption line centered at a rest-frame energy of 14 0.2 keV(68%) with rest-frame width of = 2.3 0.4 keV(68%) resulted in an improvement in fit quality at the 94% confidence level compared to fits using model 2 (see Figure 4b).
2.3 Spectral Analysis of the Combined Images of the Chandra observation of H 1413+117.
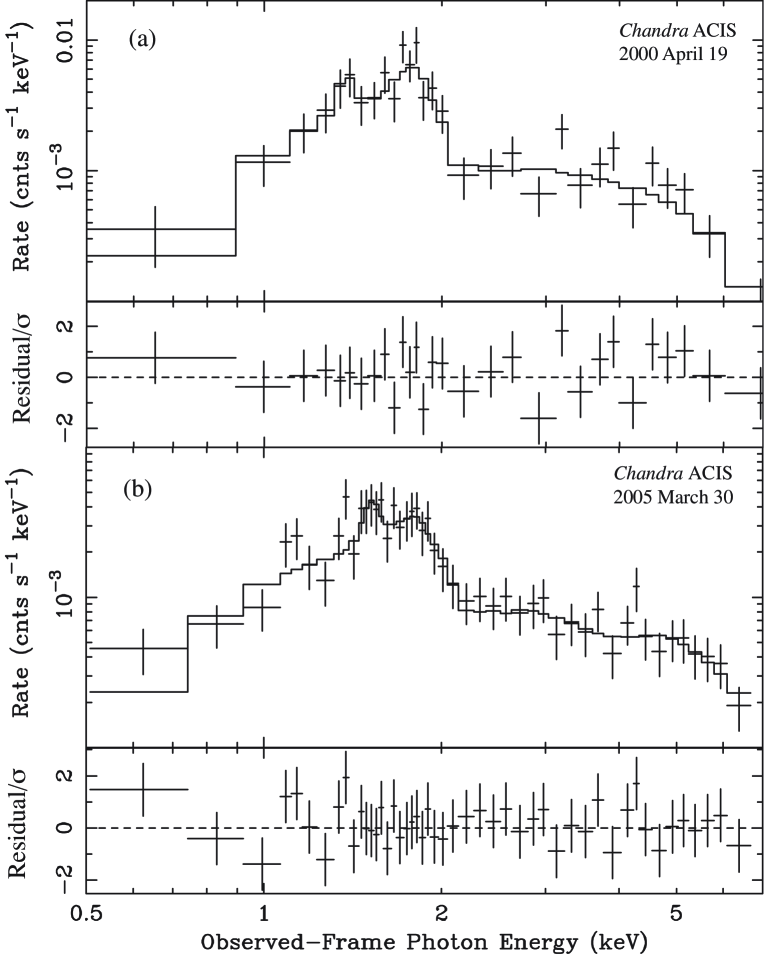
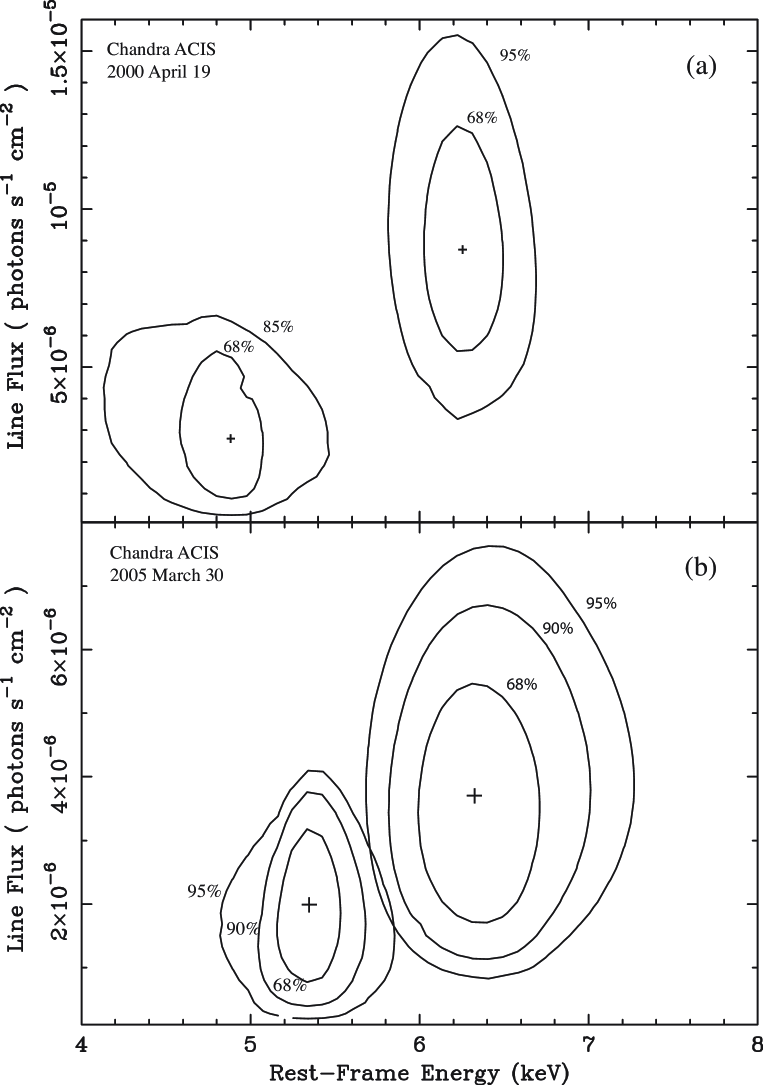
The spectra of the combined images of the 38 ks (2000 April) and 89 ks (2005 March) Chandra observations of H 1413+117 suggest the presence of emission line peaks redshifted with respect to the 6.4 keV energy of Fe K line and absorption bluewards of this energy. Our spectral analysis of the 89 ks Chandra observations of H 1413+117 indicated possible spectral differences between images. In particular, we detected significant differences between the maximum absorption energies in images C and D. We therefore expect that the combined spectrum of the images to average out the high energy absorption structure found in the spectra of the individual image. With this caveat we fitted the combined spectra with models that included a power-law modified by intrinsic neutral absorption, two redshifted Gaussian emission lines and a broad Gaussian absorption line. The spectra and best-fit models for the 38 ks and 89 ks observations are shown in Figures 3a and 3b respectively. These fits indicate the significant presence of emission line peaks at rest-frame energies of Eemis1 = 4.9 keV and Eemis2 = 6.25 0.25 keV for the 38 ks observation and Eemis1 = 5.35 0.23 keV and Eemis2 = 6.3 keV for the 89 ks observation. A conservative interpretation of these peaks based on their energies and the observational fact that Fe K emission lines are common in quasars is that they arise from Fe K emission; Recent spectral analyses (e.g., Porquet et al. 2004; Jimenez-Bailon et al. 2005; Schartel et al. 2005) find significant detections of Fe K emission lines in about half of the quasars in their samples and there are indications of broadening of the lines in about 10% of the quasars.
In Figures 5a and 5b we show the confidence contours between the flux and rest-frame energy of the Fe K emission line peaks detected in the 38 ks and 89 ks observations of H 1413+117. All emission line peaks are detected at 97% confidence level with the exception of the peak at 4.9 keV which is detected marginally at a confidence level of 85%. We notice a statistically significant reduction in the flux of the blue Fe K line peak between these two observations. The red Fe K peak does not appear to vary within errors, however the detection of this peak in the 38 ks observation is marginal, with large error bars on the profile parameters. This decrease in the strength of the blue Fe K line peak is consistent with the microlensing interpretation proposed to explain the anomalous flux ratios in the 38 ks observation of H 1413+117. In particular, as a microlensing caustic traverses the Fe K emission line region we predicted the magnification of the Fe K line to vary. The time separation between the two observations is about five years which is approximately the estimated duration of a microlensing event for this system.
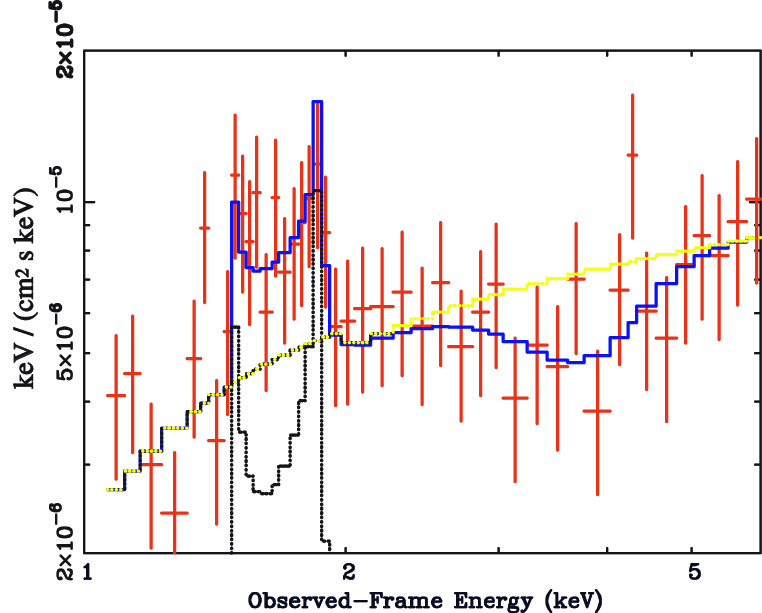
We next fit the combined spectra with a more physically motivated model that consists of Galactic absorption, a power-law modified by intrinsic neutral absorption, a Gaussian absorption line, and a fluorescent Fe K line from an accretion disk around a Schwarzschild black hole (model 2 in Table 3). In Figure 6 we show the unfolded spectrum of H 1413+117 plotted with the best-fit model (model 2 in Table 3). We also performed fits with a model similar to model 2 but with a line from a disk around a Kerr black hole (model 3 in Table 3). The fits using models 2 and 3 in Table 3 were acceptable in a statistical sense, however, because of the low S/N of the data we cannot constrain well the parameters of the models and the solutions are not unique.
2.4 Spectral Analysis of the XMM-Newton Observations of H 1413+117.
XMM-Newton cannot spatially resolve the images of H 1413+117 and therefore we analyzed the combined spectrum of all images.
The spectral analysis of the 38 ks and 89 ks Chandra observations of H 1413+117 presented in Chartas et al. (2004) and in §2.2, respectively indicated significant differences in the spectra of the different images. In particular, we detected significant enhancement of the Fe K line in image A during the 38 ks observation, we found that the broad absorption features extended to different energies blueward of the Fe K line, and inferred significant changes in the relative flux ratios between the two Chandra observations.
Because of the significant spectral differences between the images, the Hydrogen column densities, the Fe K emission line properties, and the broad absorption line properties inferred from fits to the XMM-Newton spectra of H 1413+117 represent average quantities from the four different spectra.
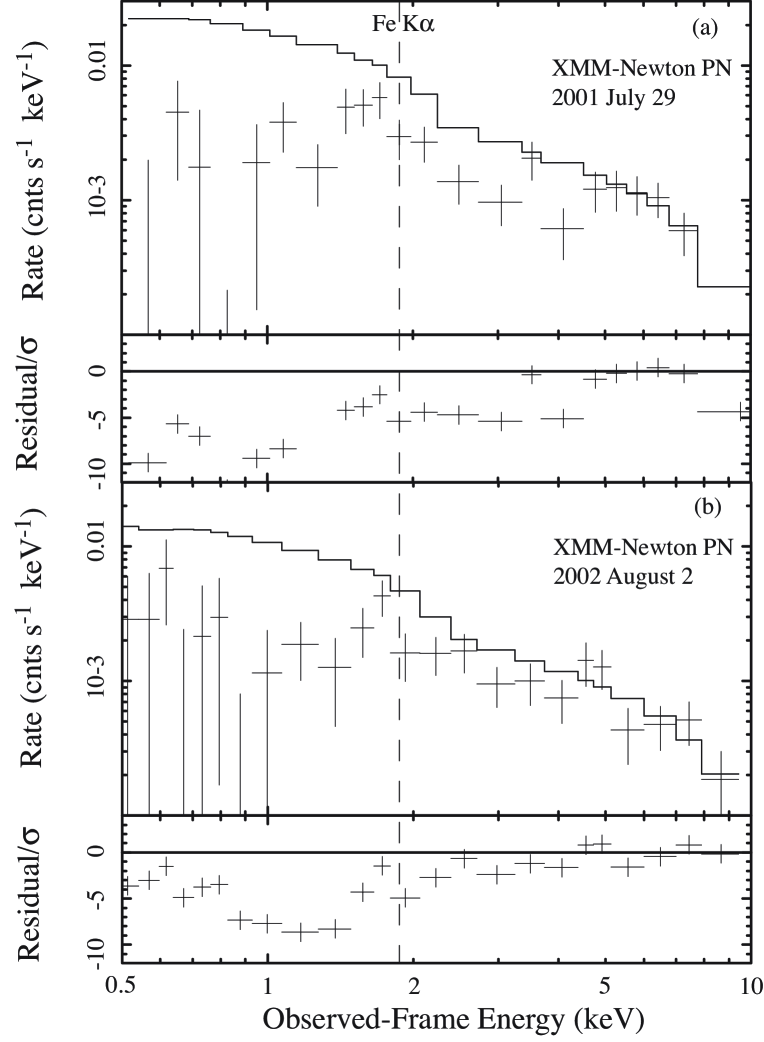
We first searched for broad absorption lines in the XMM-Newton PN and MOS spectra by fitting them in the 4.5–10 keV band with a power-law model (modified by Galactic absorption) and extrapolating this model to lower energies (see Figure 7). The best-fit 4.5–10 keV spectral indices for the 2001 and 2002 observations 1.4 and 1 were not well constrained. For the purpose of comparing the absorption residuals between the two XMM-Newton observations of H 1413+117 we set the spectral index to 1.4. The residuals of these fits in both the PN and combined MOS 1+2 detectors suggest absorption at rest-frame energies of 7–14 keV and possible emission redward of the rest-frame energy of 6.4 keV, however, the present analysis does not provide any useful constraints on the properties of the high energy absorber because of the low S/N of the XMM-Newton data.
We next simultaneously fitted the PN, MOS1 and MOS2 spectra of H 1413+117 at each of the July 2001 and August 2002 observations with a model consisting of a power law modified by Galactic absorption and neutral intrinsic absorption at (model 1 in Table 4). These fits support the presence of an intrinsic absorber with column densities of = 25 1022 cm-2 (68%), and 19 1022 cm-2 (68%) the 2001 and 2002 XMM-Newton observations of H 1413+117 respectively.
To obtain an estimate of the energies of possible Fe emission features we added a Gaussian emission line to our model. The best-fit rest-frame energies of these Gaussian lines for the 2001 and 2002 observations are keV (68%) and keV (68%), respectively. The results from the fits to the XMM-Newton spectra of H 1413+117 are presented in Table 4. For clarity we only show the higher S/N ratio PN data in Figure 7; however, all fits were performed simultaneously using the PN and MOS1+2. The lower panels in Figure 7 show the residuals between the best-fit power-law model and the PN data. Because of the low S/N of these spectra we did not attempt to fit these spectra with more complex models.
In §3.4 we use the X-ray fluxes obtained from the spectral analysis of the XMM-Newton observations of H 1413+117 to infer the time evolution of the microlensing event in image A.
3 DISCUSSION
Our analysis of the Chandra and XMM-Newton observations of H 1413+117 has confirmed the presence of a microlensing event in a previous 38 ks Chandra observation and revealed the presence of redshifted Fe K line peaks and broad absorption features bluewards of Fe K. In 3.1 and 3.2 we investigate possible origins of these features and provide constraints on the kinematic and physical properties of the medium producing them. One of the surprising results of the spectral analysis was the detection of spectral differences between the images. In 3.3 we present plausible interpretations of these differences and suggest an observational strategy for discriminating between these interpretations. In 3.4 we revisit the microlensing interpretation of the magnification event in image A that we provided in Chartas et al. (2004) and infer constraints based on this interpretation.
3.1 Origin of Emission Lines
The emission features detected in the 89 ks Chandra observation of H 1413+117 have energies near the Fe K 6.4 keV line and are reminiscent of the double peaked Fe K line profile with rest-frame energies of 5.3 keV and 6.4 keV recently discovered in the radio-loud quasar PG 1425+267 with XMM-Newton (Miniutti & Fabian 2006). These authors explored two possible origins of the line profile; (a) a single relativistic iron line from the accretion disc whose shape is determined by strong special and general relativistic effects, and (b) the superposition of a narrow 6.4 keV line from material at a large distance from the black hole and a relativistic one.
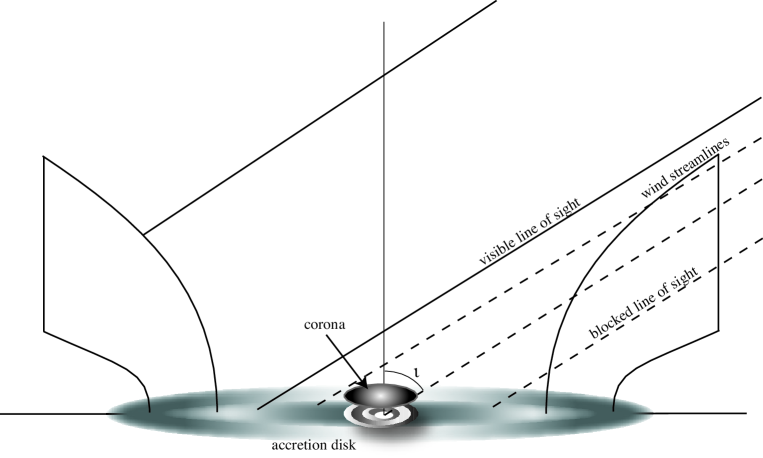
We first consider the following scenario regarding the origin of the Fe K line peaks in H 1413+117: The double-peaked line arises from fluorescence from the far side of the accretion disk and/or outflowing wind. If we assume an outflow geometry for quasars similar to that proposed by Proga et al. (2000) then, at sufficiently high inclination angles, the near side portion of the accretion disk is blocked from our view by the outflowing X-ray absorbing material (see Figure 8). The far side of the accretion disk, interior to the launching radius of the outflow, is less absorbed and visible when the angle between our line of sight and the disk axis is smaller than or equal to the angle between the surface of the outflow and the disk axis. In the case of LoBAL quasars the high levels of UV polarization observed in several cases suggest that our line of sight traverses a large portion of a Compton thick outflow and that the photons reaching the observer are mostly scattered and reprocessed. H 1413+117 has a high level of polarization of (5600 -6400 Å) 2% in the continuum and a significant rise to (4850 -4900 Å) 4.5% in the absorption troughs (Goodrich & Miller, 1995). Goodrich & Miller propose that this difference in polarization levels between the continuum and the absorption troughs implies that the scattered light is less absorbed than emission from a direct line of sight.
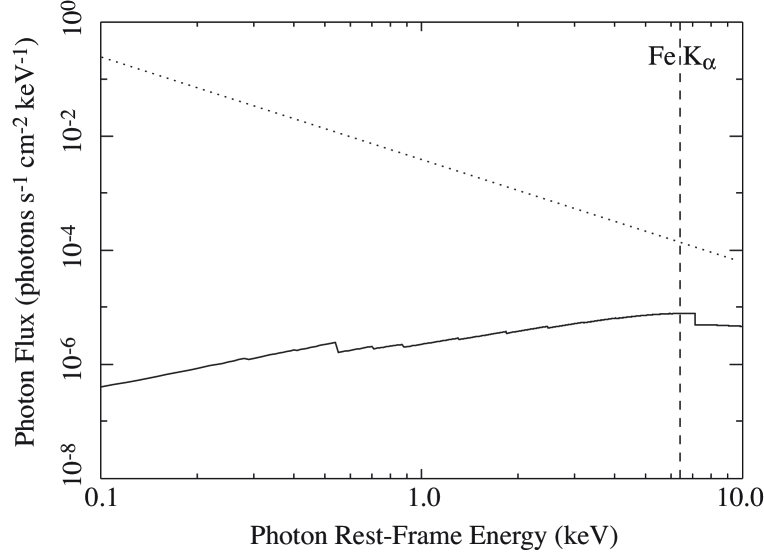
Due to the relatively large observing beam-size (for the ACIS spatial resolution of 05 the observing beam has a diameter of 4 kpc at the redshift of H 1413+117) we expect to detect emission from the far side of the accretion disk and the far side of the outflow. This leads to the following question: Are the observed properties of the emission line peaks in H 1413+117 (energy, energy width and equivalent width) consistent with fluorescence from the far side of the accretion disk and/or the far side of the outflow? Spectral analysis of broad Fe K lines in several Seyfert 1 galaxies indicate that the line emission originates between 6 and 100 (e.g., Nandra et al. 1997), where and is the mass of the black hole. The skewed and asymmetric structure of the Fe K line observed in some Seyfert 1 galaxies is often interpreted as the result of special and general relativistic effects. Based on spectral Model 1 of Table 3 we find the 2–10 keV luminosity of H 1413+117 to be 1.5 1045/ where is the lensing magnification and is expected to range between 20–40 (Chae et al. 1999). Based on observations the expected EW of an Fe K line from the disk of an AGN as luminous as H 1413+117 is 250 eV (e.g., Nandra et al. 1997). We note that the EW of the Fe K line is expected in theory to be a function of the inclination angle of the accretion disk and the spectral slope of the incident power-law spectrum as predicted in Monte Carlo calculations of the interaction of X-rays with dense neutral material in standard disk models (e.g., George & Fabian 1991). Based on our constraints on and from fits to the Chandra spectrum of H 1413+117 these Monte Carlo calculations predict the EW of the Fe K line in H 1413+117 to lie in the range of 150–200 eV for solar abundances (see Figure 14 of George & Fabian 1991). The rest-frame EWs of the Fe line peaks detected in H 1413+117 are poorly constrained to 500 eV and 1000 eV, respectively. In Table 3 we also list the EWs of the line peaks assuming disk line models. These EWs are estimated with respect to the observed continuum. The large equivalent widths of the detected line peaks can be explained if emission from the central source is mostly absorbed. A large fraction of the emission that we observe may be scattered emission from the wind or other scattering medium and fluorescence from the far side of the accretion disk and/or outflow. In Figure 9 we show the scattered emission spectrum, , assuming simple Thomson scattering and associated absorption of the continuum emission from a scatterer that subtends a solid angle of to the central source. We have assumed that the photon flux density of the central source is a power-law of the form , the spectral index is = 1.8, = 0.15 and standard solar abundance values after Wilms, Allen, and McCray (2000). In this simple model the estimated ratio of the incident emission spectrum to that of the scattered emission spectrum at 6.4 keV is / 18.
Based on the simple geometrical model shown in Figure 8 we estimated the EW of the Fe K line for the cases of (a) no significant and (b) significant absorption from an outflowing wind. The of the Fe K line for case (a) of no significant absorption from a wind has the form:
| (1) |
where is the integrated flux of the Fe K line that originates from the disk, and are the flux densities of the reprocessed continuum emission from the disk and the corona respectively, estimated at the energy of the Fe line. The of the Fe K line for case (b) where an absorber blocks the continuum from the corona and partially blocks the continuum from the disk has the form:
| (2) |
where and are defined as the fractions of emission from the disk and corona that manage to penetrate the absorbing wind and be observed, respectively. Since the reprocessed line and continuum are emitted from the same area of the disk we assumed the same fraction () for line and continuum components. According to the geometrical model shown in Figure 8 we also assume that the emission from the corona is completely blocked and therefore 0. The ratio of EWs with and without the Compton thick absorber is then given by the expression:
| (3) |
Typically radio-quiet AGN have 10 (see Figure 12 of George & Fabian 1991). We conclude that the large observed values of the EW of the line can be the result of significant X-ray absorption of the direct emission from the central source. The detection, however, of possible X-ray BALs above 6.4 keV in images C and D of H 1413+117 implies that a fraction of the direct emission apparently makes it through the absorbing wind at rest-frame energies above 6.4 keV.
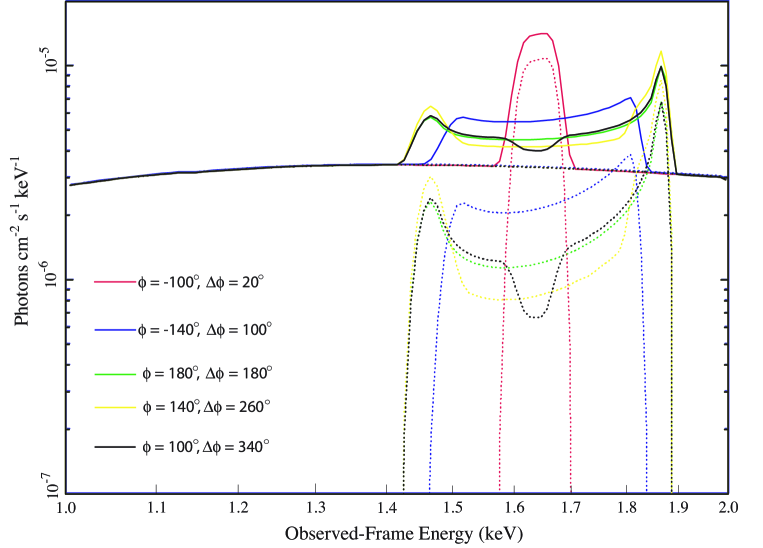
We also modeled the line profile in H 1413+117 assuming emission from a relativistic accretion disk (e.g., Fabian et al. 1989; Laor et al. 1991). As shown in Figure 6 fitting the line with a disk model resulted in an acceptable fit to the spectrum. Because of the low S/N of the spectra the solutions obtained are not unique and the best-fit parameters are not well constrained. In addition we caution that because of the spectral differences between images the best-fit parameters should be considered as averaged quantities between the four different spectra. The best-fit parameters are shown in Table 3. In models 2 and 3 in Table 3 we consider the case of a Schwarzschild and Kerr black hole, respectively. We note that the models that we used assume emission from the entire disk whereas we expect only the far side of the disk would be observed. Thus the observed line profiles would be quantitatively different from the model predictions but they would still be qualitatively similar. To investigate the effects of disk obscuration on the Fe K line profile we used the relativistic accretion disk models developed by Dovciak et al. (2004). We note that the low quality of the Chandra spectrum of H 1413+117 does not allow us to uniquely constrain the parameters of the models, however, the goal of this exercise was to obtain a qualitative estimate of the effects of obscuration on the shape of the Fe K emission line and find a range of model parameters that are consistent with the data. We fitted the Chandra spectrum of H 1413+117 with a model that consists of Galactic absorption, a power-law modified by intrinsic neutral absorption, a Gaussian absorption line, and a fluorescent Fe K line from an accretion disk around a black hole that is obscured over a range of azimuthal angles. (Dovciak et al. 2004) was used to model the relativistic line from an accretion disc around a Kerr black hole in the case of non-axisymmetric disk emission. The inclination angle, and inner and outer radii of the disk emission were fixed to the values of 30 degrees, 14 and 17 , respectively, found from fits to the Chandra spectrum of H 1413+117 using the axisymmetric model . In Figure 12 we show Fe K line profiles originating from five different azimuthal segments of the disk assuming that portions of the disk are obscured by the outflowing wind as illustrated in Figure 8. (units of degrees) is the lower azimuth of non-zero disk emissivity and (units of degrees) is the span of the disk sector with non-zero disc emissivity. Models with degrees degrees, where substantially more than half of the disk emission is obscured by the wind, are not consistent with the data.
We might also expect fluorescent Fe K line emission from the far side of the outflow. In this case the line profiles would also be quantitatively similar to those computed above. The Fe line emission detected in the 38 ks Chandra observation of H 1413+117 was initially interpreted by Oshima et al (2001) as Fe K fluorescence from the far side of the outflow. We note that in a re-analysis of the Cloverleaf observation (Chartas et al. 2004) we found that interpretation to be problematic because of a significant microlensing event in image A. The Fe K line in the 38 ks observation was only significant in image A and any constraints on the properties of the reprocessing medium based on the strength of the Fe K line mentioned in that analysis are thus not reliable.
The present data cannot unambiguously constrain the origin of the Fe K emission. We briefly summarize and discuss the pros and cons of the two proposed interpretations :
(a) Our first interpretation is that the observed line represents fluorescent Fe emission from the far side of the inner accretion disk. The observed profile of the Fe K line is a result of special and general relativistic effects. Supporting evidence for this interpretation are the observed energies and widths of the line peaks. The blue Fe K line peak at 6.3 keV is marginally broad (model 1 in Table 3) which is consistent with an origin near the black hole. As we show in §3.4 the estimated size of the microlensed Fe emission region of the Fe peak at 6.3 keV is 13 . This is consistent with emission near the event horizon of the black hole. The iron line peak at 5.4 keV is significantly redshifted with respect to 6.4 keV implying also an origin near (10’s of ) the black hole. In the context of this scenario, the line-emitting region of the disk must be considerably larger than the source of the continuum (the corona) so that it is not completely obscured by the outflowing wind. The extent, geometrical configuration and kinematics of the hot corona are not well constrained from present observations and there are several competing models for the geometry of the corona. Proposed configurations of the corona include one where the cold accretion disk is surrounded by a hot extended, possibly patchy corona (Haardt & Maraschi 1991, Merloni 2003 ), a point source located above the accretion disk (also referred to as the lamp-post model; e.g., Martocchia et al. 2002), multiple hot flares (Collin et al. 2003; Czerny et al 2004), an aborted jet (Ghisellini et al. 2004), and a spherical central source spatially separate from the accretion disk (Proga 2005). The lamp-post and central spherical corona models would allow for different absorption towards the hot corona and the accretion disk.
(b) Our second interpretation is that the Fe line emission is produced by fluorescence in the far side of the wind. In this scenario the wind would have to be launched near the black hole and the fluorescent Fe emission would have to originate from a narrow enough region to produce the double peaked structure and width of the observed iron line.
3.2 Origin of Absorption Lines
One plausible interpretation of the broad-absorption features detected bluewards of Fe K (with significant detections in the spectra of images C and D) is that they are resonance transitions in highly ionized Fe XXV and/or Fe XXVI in an outflowing wind. Among the most abundant elements of S, Si and Fe, Fe absorption lines have the closest energies to the observed absorption features. Similar high-energy absorption features have been reported in BALQSOs APM 08279+5255 and PG 1115+080 (Chartas et al., 2002, 2003, 2007). Assuming the above identification we infer maximum outflow velocities of 0.29 and 0.67 in the spectra of images C and D respectively based on the maximum energy of the absorption troughs. The rest frame widths of the absorption lines detected in images C and D are = 0.5 keV(68%) and = 2.3 0.4 keV(68%). One plausible interpretation of the observed broadening of the absorption lines is that it results from large velocity gradients in the outflow, along our line of sight.
In the following section we investigate plausible mechanisms to explain the difference in maximum absorption energies between images.
3.3 Multiple Views of the Cloverleaf Quasar
Three plausible interpretations for the spectral differences between images are: (a) Significant inhomogeneities in the outflow properties along the lines of sight corresponding to different images (e.g., Chelouche 2003; Green 2006), (b) Variability of the outflow on time-scales that are shorter than the time-delay between the images, and (c) Microlensing in at least two of the images.
(a) Significant inhomogeneities in the outflow properties along the lines of sight towards different images.
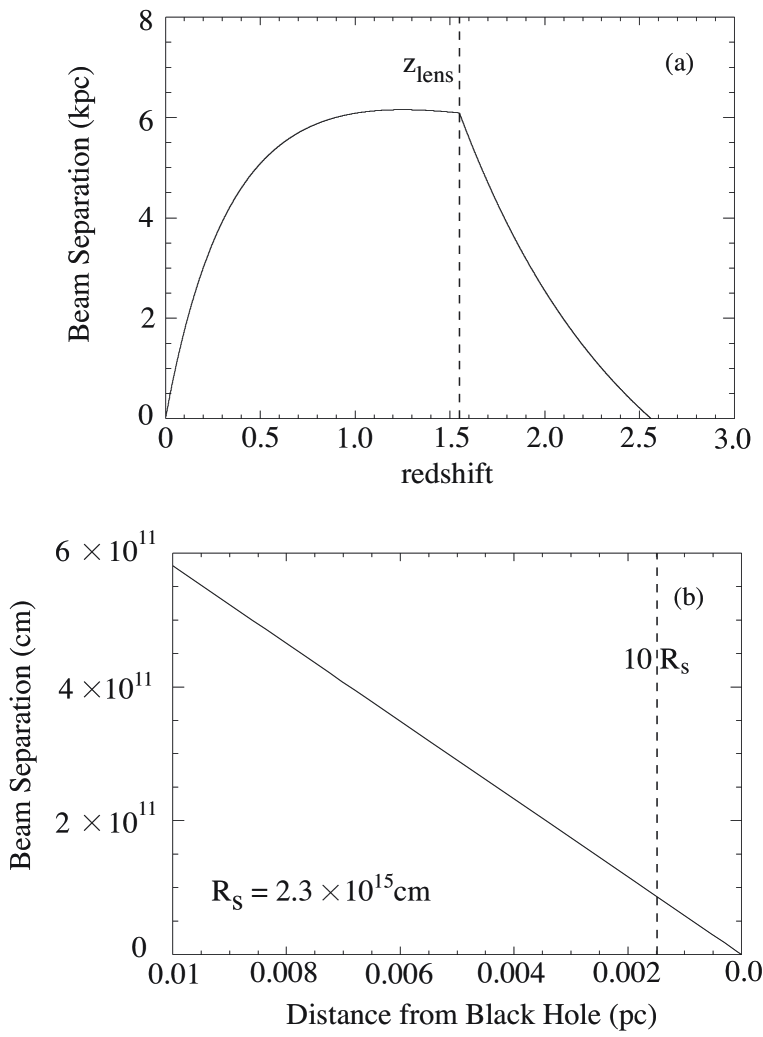
We investigate this interpretation by estimating the linear separation of the lines of sight as a function of the distance to the black hole and compare these separations with the size of the central X-ray source. The comoving linear beam separation is given by :
| (4) |
where D are the angular diameter distances, and the subscripts l, a, s, and o refer to the lens, absorber, source and observer. In Figure 10a we show the linear beam separation as a function of redshift of the observer for an observed image separation of 1 arcsec assuming lens and quasar redshifts of 1.55 and 2.56, respectively. In Figure 10b we show the linear beam separation as a function of distance from the black hole for a lens redshift of . The location of the material producing the high energy absorption is not constrained by the present observations. We note however that similar high energy absorption features have been detected in BAL quasars APM 08279+5255 and PG 1115+080. Based on the detected flux-variability of the X-ray BALs, the inferred outflow velocities of the X-ray absorbing material, and the high ionization state of the detected absorbers in these systems we inferred that they likely originate very close to the black hole with inferred launching radii ranging between 10–100 . For H 1413+117 we estimate 4.5 1014 -1 -1 cm 2.3 1014 cm, where is the lensing magnification, = , is the Eddington luminosity, is the bolometric luminosity and, is thought to range between 0.1 and 1 in quasars. Our estimate of the dependence of the angular beam separation with distance from the black hole shown in Figure 10b indicates that for outflowing absorbers at distances in the range of 10–103 the corresponding linear beam separations at these locations lie in the range of 4.31010 cm – 4.31012 cm. These linear beam separations are significantly less than the size of the central X-ray source (a source size of 10 2.3 1015 cm) and therefore the Chandra beams (i.e., cylinders of sight) corresponding to the different images of H 1413+117 overlap almost completely, thus they sample the same regions of the outflow. We conclude that the observed spectral differences between images cannot be caused by inhomogeneities in the outflow properties along different lines of sight.
(b) Variability of the outflow on time-scales that are shorter than the time-delays between the images.
From a light travel time argument we estimate that the minimum variability time-scale in the observed-frame is = 6(1 + )/ 2 days, where 6 is the radius of the innermost stable circular orbit around a Schwarzschild black hole. We note that the last stable orbit can be even smaller in a Kerr black hole and the disk can extend down to the event horizon. The dynamical time-scale corresponding to motion near the event horizon across the line of sight is = 5 days. The dynamical time-scale is perhaps more plausible than the light crossing-time because it corresponds to physical changes (e.g., motion across the line of sight or internal changes). Variability of the outflow over time-scales that are shorter than the time-delays between images can result in spectral difference between images.
Lens models of H 1413+117 assuming that the lens consists of two galaxies (e.g., Chae et al. 1999) indicate that image C leads images B, A, and D by 15, 18.5 and 22 days, respectively. These values of the time-delays are sensitive to the adopted lens model, however, the two-galaxy lens models and the galaxy cluster lens models considered by Chae et al. (1999) both have C being the leading image and D being the trailing image. We conclude that variability of the outflow can be the cause of the observed spectral differences since is less than the time-delays.
We use the relative time-delays between images C and D to interpret the observed difference in the maximum absorption energies in their spectra. The spectrum of image C shows absorption of up to 9 keV in the rest-frame of H 1413+117 and the spectrum of image D shows absorption of up to 15 keV in the rest-frame. The relative time-delays predicted in the Chae et al. (1999) model imply that the spectrum of image D corresponds to an earlier rest-frame time than that of the spectrum of image C. Assuming that the broad absorption is caused by X-ray absorbing material in an outflow, one plausible interpretation of the observed differences in the maximum absorption energies between the spectra of imagers C and D is a decrease of the apparent velocity of the absorbing material (i.e., the projection of its velocity along the line of sight).
The first detected change in the apparent velocity of an outflow associated with a Seyfert 1 galaxy was recently reported by Gabel et al. (2003) based on HST monitoring observations of NGC 3783. They interpreted this velocity shift as either produced by a radial deceleration of a UV absorbing cloud or caused by the evolution of a continuous flow tube across our line of sight to the emission source. A similar mechanism may be responsible for the differences in maximum absorption energies of the X-ray BALs in images C and D.
The variability interpretation is testable with a follow-up observation of H 1413+117 with comparable exposure. In particular, if the spectral differences between images are due to intrinsic variability of the outflow over time-scales shorter than the time-delay we predict a significant variability in the structure of the high-energy absorption of the same image between Chandra observations in a future campaign.
(c) Microlensing in at least two of the images. Our present spectral and spatial analysis of the 89 ks observation of H 1413+117 indicate that the X-ray flux ratios have become similar to those observed in the optical -band that is thought to be less sensitive to microlensing. The analyses presented in §2.1 and §3.4 indicate that the microlensing event in image A inferred to have occurred during the 2000 observation of H 1413+117 has ended and there is no indication of any anomalous flux ratios in any images during the 2005 observation of H 1413+117. We conclude that microlensing is not the cause of the spectral differences between the images in the 89 ks Chandra observation of H 1413+117.
3.4 Revisiting the Microlensing Interpretation of the Magnification Event in Image A
In our earlier analysis of the 38 ks Chandra observation of H 1413+117 (Chartas et al. 2004) we determined that a microlensing event resulted in a significant enhancement of the Fe K line in image A compared to that in the remaining images. To estimate the evolution of the microlensing event in image A with time we calculate the observed-frame 1–2 keV photon flux of image A. The 1–2 keV region contains the redshifted Fe K emission and a significant amount of continuum emission. A comparison of the best-fit spectral models of the two Chandra observations of H 1413+117 shown in Figure 3 indicates that the Fe line and continuum components in the 1–2 keV band varied in flux between observations by factors of 2.2 and 1.25, respectively. We therefore attribute most of the detected variability in the 1–2 keV band between the two Chandra observations of H 1413+117 to variability of the Fe line. If the corona is compact as in the proposed outflow geometry described in §3.1 we would expect the direct continuum emission from this region to be sensitive to microlensing. Assuming the microlensing interpretation, an obvious question is why the continuum in the 1–2 keV band has not varied as much as the Fe line component in this region. We present two possible explanations :
(a) The X-ray flux variability between the two Chandra observations appears to be energy dependent in the sense that the variability amplitude increases with energy. The ratio of the fluxes of the continuum components between the two Chandra observations in the observed-frame bands of 0.5–1 keV, 1–2 keV, 2–3 keV and 3–4 keV are 0.83, 1.25, 1.3, and 1.65, respectively. This suggests that the direct continuum emission is more absorbed than the scattered continuum at observed-frame energies of 2 keV and perhaps dominates over the scattered continuum emission component at observed-frame energies of 2 keV. The total continuum emission in the 1–2 keV range may consist mostly of scattered emission coming from an extended region and less sensitive to microlensing, whereas, at energies above 2 keV the direct continuum (which originates in a compact source) might begin to dominate as suggested by the possible detection of broad X-ray absorption features at energies above 2 keV.
(b) Another possibility is suggested by the apparent magnification of only the blue Fe line component during the first Chandra observation of H 1413+117. This apparent magnification of only the blue line peak can be explained if during the first Chandra observation the microlensing caustic was located on the approaching side of the accretion disk and it was moving towards the receding side of the disk. If this were the case we would not expect the direct continuum to be significantly magnified by the microlensing caustic during the first Chandra observation. This successive brightening of the double Fe line peaks has been predicted in simulations of microlensing of accretion disks by Popovic et al. (2006).
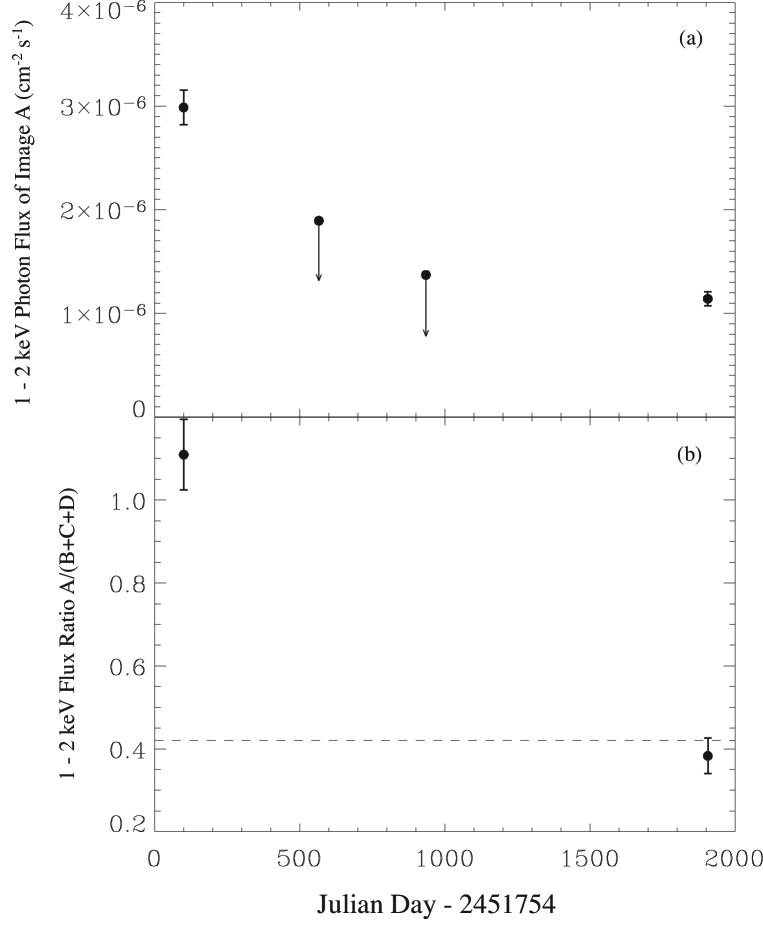
In Figure 11a we show the 1–2 keV photon flux of image A as a function of time for the four observations of H 1413+117. The two XMM-Newton observations do not resolve image A and we therefore provide upper limits for these epochs. We notice a significant decrease in the 1-2 keV photon flux of image A consistent with the conclusion of the microlensing event. In Figure 11b we show the ratio of the 1–2 keV fluxes between image A and images B+C+D for the two Chandra observations of H 1413+117. We have also overplotted with a dashed line the ratio of the -band fluxes between image A and images B+C+D. Since the -band flux ratio is not sensitive to microlensing we interpret the convergence of the 1–2 keV flux ratio to the -band flux ratio as the end of the microlensing event in image A. The time-scale of the decrease of the photon flux in image A implies that the duration of the microlensing event was of the order of 2 103 days.
The sizescale of the source region being microlensed is of the order of = , where, is the timescale of the microlensing event in image A and is the velocity of the caustics in the lens plane (measured in the observer’s time frame) given by equation (B9) in Kayser, Refsdal, & Stabell (1986). If we assume an observer velocity of 280 km/s (this is measured from the CMB dipole), a lens redshift of = 1.55, lens and AGN velocities of 600 km s-1, and sum the three-dimensional velocities in equation (B9) in RMS, we find a typical velocity of a caustic of 180 km s-1 and a typical sizescale of the microlensed region of 3.1 1015 cm 13 .
In general microlensing caustic patterns may be quite complex and clustered depending on the relative redshifts of the lens and source and the density of stars along a particular line of sight. We have assumed that the observed decrease in the magnification of image A is the result of a single caustic crossing whereas the sparse sampling of two Chandra and two XMM-Newton observations as shown in Figure 11 leaves room for multiple microlensing events between the two Chandra observations. We note, however, that shorter microlensing timescales would lead to even smaller sizescales of the X-ray emission region.
4 CONCLUSIONS
Based on our spectral analysis of a 38 ks Chandra observation of H 1413+117 (carried out in 2000 April and presented in Chartas et al. 2004) we had interpreted the strong Fe K emission in the spectrum of image A and the energy-dependent magnification of image A as a result of a microlensing event in this image. We predicted that if the microlensing interpretation was correct we should expect to detect a reduction in the continuum and Fe K emission in image A when the magnification event was complete.
In the follow up 89 ks observation of H 1413+117 performed about five years later we confirm our prediction for the microlensing interpretation. Specifically, the 0.2–8 keV count-rate of image A decreased by a factor of 2.1 while the 0.2–8 keV count-rates of the other images remained the same within errors between the Chandra observations of H 1413+117. The strength of the Fe K line decreased by a factor of 2.3 between observations. As a result of the decrease in the flux of image A the X-ray flux ratios of the images varied significantly between the two Chandra observations of H 1413+117. In particular, we found that the X-ray flux ratios of the 2005 Chandra observation are consistent to the WFPC2 -band (similar to a wide -band) flux ratios which are not significantly affected by microlensing. We therefore conclude that the microlensing event in image A ended by the 2005 Chandra observation.
The observed decrease of the photon flux of image A in the 1–2 keV band and the decrease of the ratio of the 1–2 keV fluxes between image A and images (B+C+D) between the two Chandra observations of H 1413+117 indicates the end of the microlensing event in image A and implies that the duration of the microlensing event was of the order of 2000 days. Assuming this timescale for a caustic crossing we estimate that the sizescale of the microlensed region is of the order of 13.
Our analysis of the 89 ks Chandra observation of H 1413+117 revealed several remarkable features. The spectra of the individual images show high energy broad absorption features between rest frame energies of 6.4–15 keV. These features are especially significant in the spectra of images C and D where they extend from 6.4 keV up to energies of 9 keV and 15 keV, respectively.
If we interpret the X-ray broad absorption features as arising from absorption by outflowing highly ionized Fe XXV the observed maximum absorption energies in images C and D imply outflow velocities of 0.29 and 0.67, respectively. The detection of X-ray broad absorption features suggests that a fraction of the detected X-ray emission must be direct emission from the central source that is heavily absorbed by an outflow.
The available spectra of the individual images cannot provide tight constraints on the properties of the high-energy broad absorption features. However, we found that fits to the spectra of images C and D with models that include a direct, power-law continuum modified by intrinsic neutral absorption, a Thomson scattered power-law continuum, saturated high-energy absorption from the outflowing material and a fluorescent Fe line from an accretion disk provide a significant improvement compared to fits with models that only include a power-law model modified by neutral intrinsic absorption.
We investigated various plausible mechanisms to explain the spectral differences between images. We concluded that variability of the absorber on time scales shorter than the time-delays between images in the most likely cause of these differences. From lens models of this system (Chae et al. 1999) we expect that the spectrum of image D originates at an earlier rest-frame time than that of the spectrum of image C. This ordering would imply a decrease in the maximum observed radial outflow velocity within a time shorter than the time delay between images D and C. The time-delay between images D and C is estimated to be of the order of 22 days. Plausible interpretations of the decrease in the maximum absorption energy include a radial deceleration of the X-ray absorbing material or an evolution of a flow tube across our line of sight to the emission source.
The individual spectra of the images also show emission features redward of the rest-frame energy of 6.4 keV that resemble the skewed and asymmetric structure occasionally detected in the spectra of Seyfert 1 galaxies. In the combined spectrum emission line peaks at 5.35 0.23 keV and keV are detected at the 98% and 99% confidence levels, respectively. The respective equivalent widths of the emission line peaks are eV and eV. In LoBAL quasars we expect that X-ray emission from the central source and the near side of the accretion disk to be significantly absorbed by the outflowing wind (see Figure 8). In H 1413+117 we therefore propose as plausible origins of the emission line peaks fluorescence from the far side of the accretion disk and/or from the far side of the outflowing wind. The large equivalent widths of the line peaks can be explained by the significant absorption of the central continuum source by the outflowing X-ray absorbing material. Unfortunately the present data cannot constrain the column density of this possibly Compton-thick component. We note that the moderate detection levels of the double-peaked Fe K line in the 89 ks observation of H 1413+117 combined with the independent microlensing constraint of the sizescale of the emitting region of 13 and the extreme redshift of the line peak at 5.35 keV provide a convincing case for the relativistic nature of the detected Fe K line.
We modeled the Fe K profile with an accretion disk line model and found an acceptable fit to the spectrum. We note, however, that due to the low S/N of the spectrum we cannot obtain tight constraints on the parameters of such a disk-line model. Additional deeper observations are needed to confirm the origin of the X-ray broad absorption features, determine the cause of the spectral differences between images, determine the origin of the Fe emission line and constrain the parameters of a disk-line model. Constraining the inclination angle of H 1413+117 will allow us to test the unification scheme between BAL and non-BAL quasars. A detection of a small inclination angle (i.e., 50 degrees) would challenge the validity of the orientation model of BAL quasars. On the other hand the detection of a large inclination angle (i.e., 50 degrees) would provide supporting evidence for the unification model, however, additional observations of other BAL quasars would be needed to reject competing BAL models. Specifically, to reject the ”youth” model that proposes LoBALs are quasars at an early stage in their evolution (see for example Voit, Weymann & Korista 1993; Becker et al. 2000; Lacy et al. 2002) we would need several observations of BAL quasars that show that the inclination angle is consistently large whereas the ”youth” model predicts a more uniform distribution of inclination angles. A confirmation of the unification model is very important in cross-checking the frequency of outflows in quasars and by extension establishing their importance in shaping the evolution of their host galaxies and in regulating the growth of the central black hole.
The present detection of disk like Fe K line and highly blueshifted X-ray broad absorption features in H 1413+117 indicate that this is an ideal system to study quasar outflows. The detection of the double-peaked Fe emission line is possible partly due the the significant absorption of the central source resulting in an increased equivalent width and the large flux magnification from lensing expected to be between 20–40.
References
Arnaud, K. A. 1996, ASP Conf. Ser. 101: Astronomical Data Analysis Software and Systems V, 5, 17
Becker, R. H., White, R. L., Gregg, M. D., Brotherton, M. S., Laurent-Muehleisen, S. A., & Arav, N. 2000, ApJ, 538, 72
Braito, V., Della Ceca, R., Piconcelli, E., et al., 2004, A&A, 420, 79
Chae & Turnshek 1999, ApJ, 514 587
Chae, K.-H., Turnshek, D. A., Schulte-Ladbeck, R. E., Rao, S. M., & Lupie, O. L. 2001, ApJ, 561, 653
Chartas, G., Brandt, W. N., Gallagher, S. C., & Garmire, G. P. 2002, ApJ, 579, 169
Chartas, G., Brandt, W. N., Gallagher, S. C., & Proga, D. 2007, accepted in AJ, astro-ph/0701104
Chartas, G., Brandt, W. N., & Gallagher, S. C. 2003, ApJ, 595, 85
Chartas, G., Eracleous, M., Agol, E., & Gallagher, S. C. 2004, ApJ, 606, 78
Chelouche, D. 2003, ApJ, 579, 169
Collin, S., Coupé, S., Dumont, A.-M., Petrucci, P.-O., & Różańska, A. 2003, A&A, 400, 437
Czerny, B., Różańska, A., Dovčiak, M., Karas, V., & Dumont, A.-M. 2004, A&A, 420, 1
Dai, X., Chartas, G., Eracleous, M., & Garmire, G. P. 2004, ApJ, 605, 45
Dai, X., Kochanek, C. S., Chartas, G., & Mathur, S. 2006, ApJ, 637, 53
Dickey, J. M., & Lockman, F. J. 1990, ARA&A, 28, 215
Dovčiak, M., Karas, V., & Yaqoob, T. 2004, ApJS, 153, 205
Elvis, M. 2000, ApJ, 545, 63
Fabian, A. C., Rees, M. J., Stella, L., & White, N. E. 1989, MNRAS, 238, 729
Falco, E. E., Impey, C. D., Kochanek, C. S. et al. 1999, ApJ, 523, 617
Gabel, J. R., et al. 2003, ApJ, 595, 120
Gallagher, S. C., Brandt, W. N., Chartas, G., & Garmire, G. P. 2002, ApJ, 567, 37
Gallagher, S. C., Schmidt, G. D., Smith, P. S., Brandt, W. N., Chartas, G., Hylton, S., Hines, D. C., & Brotherton, M. S. 2005, ApJ, 633, 71
Garmire, G. P., Bautz, M. W., Ford, P. G., Nousek, J. A., & Ricker, G. R. 2003, Proc. SPIE, 4851, 28
George, I. M., & Fabian, A. C. 1991, MNRAS, 249, 352
Ghisellini, G., Haardt, F., & Matt, G. 2004, A&A, 413, 535
Goodrich, R. W., & Miller, J. S. 1995, ApJ, 448, L73
Granato, G. L., De Zotti, G., Silva, L., Bressan, A., & Danese, L. 2004, ApJ, 600, 580
Green, P. J. 2006, ApJ, 664, 733
Green, P. J., Aldcroft, T. L., Mathur, S., Wilkes, B. J., & Elvis, M. 2001, ApJ, 558, 109
Haardt, F., & Maraschi, L. 1991, ApJ, 380, L51
Hopkins, P. F., Hernquist, L., Cox, T. J., Di Matteo, T., Martini, P., Robertson, B., & Springel, V. 2005, ApJ, 630, 705
Hopkins, P. F., Hernquist, L., Cox, T. J., Di Matteo, T., Robertson, B., & Springel, V. 2006, ApJS, 163, 1
Jansen, F., Lumb, D., Altieri, B., et al. 2001, A&A, 365, L1
Jiménez-Bailón, E., Piconcelli, E., Guainazzi, M., Schartel, N., Rodríguez-Pascual, P. M., & Santos-Lleó, M. 2005, A&A, 435, 449
Krolik, J. H. 1998, Active Galactic Nuclei: From the Central Black Hole to the Galactic Environment, by J.H. Krolik. Princeton: Princeton University Press, 1998.
Lacy, M., Gregg, M., Becker, R. H., White, R. L., Glikman, E., Helfand, D., & Winn, J. N. 2002, AJ, 123, 2925
Laor, A. 1991, ApJ, 376, 90
Martocchia, A., Matt, G., & Karas, V. 2002, A&A, 383, L23
Merloni, A. 2003, MNRAS, 341, 1051
Miniutti, G., & Fabian, A. C. 2006, MNRAS, 366, 115
Mori, K., Tsunemi, H., Miyata, E., Baluta, C., Burrows, D. N., Garmire, G. P., & Chartas, G. 2001, in ASP Conf. Ser. 251, New Century of X-Ray Astronomy, ed. H. Inoue & H. Kunieda (San Francisco: ASP), 576
Nandra, K., George, I. M., Mushotzky, R. F., Turner, T. J., & Yaqoob, T. 1997, ApJ, 488, L91
Oshima, T., Mitsuda, K., Fujimoto, R., Iyomoto, N., Futamoto, K., Hattori, M., Ota, N., Mori, K., Ikebe, Y., Miralles, J. M., & Kneib, J.-P. 2001, ApJ, 563, L103
Popović, L. Č., Jovanović, P., Mediavilla, E., Zakharov, A. F., Abajas, C., Muñoz, J. A., & Chartas, G. 2006, ApJ, 637, 620
Porquet, D., Reeves, J. N., O’Brien, P., & Brinkmann, W. 2004, A&A, 422, 85
Proga, D. 2005, ApJ, 630, L9
Proga, D., Stone, J. M., & Kallman, T. R. 2000, ApJ, 543, 686
Reynolds, C. S., & Nowak, M. A. 2003, Phys. Rep., 377, 389
Schartel, N., Rodríguez-Pascual, P. M., Santos-Lleó, M., Clavel, J., Guainazzi, M., Jiménez-Bailón, E., & Piconcelli, E. 2005, A&A, 433, 455
Springel, V., Di Matteo, T., & Hernquist, L. 2005, ApJ, 620, L79
Scannapieco, E., & Oh, S. P. 2004, ApJ, 608, 62
Strüder, L., Briel, U., Dennerl, K., et al., 2001, A&A, 365, L18
Tsunemi, H., Mori, K., Miyata, E., Baluta, C., Burrows, D. N., Garmire, G. P., & Chartas, G. 2001, ApJ, 554, 496
Turner, M. J. L., Abbey, A., Arnaud, M., 2001, A&A, 365, L27
Turnshek, D. A., Lupie, O. L., Rao, S. M., Espey, B. R., & Sirola, C. J. 1997, ApJ, 485, 100
Voit, G. M., Weymann, R. J., & Korista, K. T. 1993, ApJ, 413, 95
Wilms, J., Allen, A., & McCray, R. 2000, ApJ, 542, 914
Wise, M. W., Davis, J. E., Huenemoerder, Houck, J. C., Dewey, D. Flanagan, K. A., and Baluta, C. 1997, The MARX 3.0 User Guide, CXC Internal Document available at http://space.mit.edu/ASC/MARX/
| TABLE 1 | ||||
| Log of Observations of the LoBAL Quasar H 1413+117 | ||||
| Effective | ||||
| Observation | Observatory | Observation | Exposure Timeaafootnotemark: | bbfootnotemark: |
| Date | ID | (ks) | ||
| 2000 April 19 | Chandra | 930 | 38.2 | 8.2 0.5 10-3 |
| 2001 July 29 | XMM-Newton | 0112250301 | 19.2 | 1.1 0.1 10-2 |
| 2002 August 2 | XMM-Newton | 0112251301 | 23.5 | 0.9 0.1 10-2 |
| 2005 March 30 | Chandra | 5645 | 88.9 | 5.6 0.3 10-3 |
aThe effective exposure time is the time remaining after the application of good time-interval (GTI)
tables to remove portions of the observation that were severely contaminated by background flares.
bBackground-subtracted source count rate including events with energies within the 0.2–10 keV band.
The source count rates and effective exposure times for the XMM-Newton observations refer to those obtained with the
EPIC PN instrument.
See §2 for details on source and background extraction regions used for estimating .
| TABLE 2 | |||||
| RESULTS FROM FITS TO THE Chandra SPECTRA OF INDIVIDUAL IMAGES | |||||
| Modela | Parameterb | Values For | Values For | Values For | Values For |
| Image Ac | Image Bc | Image Cc | Image Dc | ||
| 1 | 0.62 0.21 | 0.38 0.21 | 0.55 0.23 | 0.50 0.26 | |
| 433/783 | 496.3/783 | 406.1/783 | 364/783 | ||
| 35.4/25 | 30.9/28 | 39.3/22 | 27.5/16 | ||
| d | 8.1 10-2 | 0.3 | 1.3 10-2 | 3.9 10-2 | |
| 2 | 1.7 | 0.93 | 1.9 | 1.64 | |
| (1022 cm-2 ) | 19 | 9 | 29 | 24 | |
| 412.7/783 | 487/783 | 380/783 | 352/783 | ||
| 20.9/24 | 23.7/27 | 22.9/21 | 17.6/15 | ||
| d | 0.64 | 0.65 | 0.35 | 0.28 | |
| 3 | – | – | 1.5(68%) | 1.7fp | |
| (1022 cm-2 ) | – | – | 25 (68%) | 120 (68%) | |
| (keV) | – | – | 5.6 0.1 (68%) | 5.6 (68%) | |
| (keV) | – | – | 0.24 (68%) | 1.7 (68%) | |
| (keV) | – | – | 8.5 0.2 (68%) | 13.9 0.2 (68%) | |
| (keV) | – | – | 0.5 (68%) | 2.2 0.4 (68%) | |
| – | – | 365/783 | 330/783 | ||
| 12.0/16 | 8.3/11 | ||||
| d | 0.75 | 0.68 | |||
| 4 | – | – | 2.1 0.6 (68%) | 1.6(68%) | |
| (1022 cm-2 ) | – | – | 55 (68%) | 79 (68%) | |
| (keV) | – | – | 6.4fp | 6.4fp | |
| () | – | – | 6 fp | 6 fp | |
| () | – | – | 1000 fp | 1000 fp | |
| – | – | 4fp | 4fp | ||
| (degrees) | – | – | 21 7 (68%) | 27 (68%) | |
| (keV) | – | – | 8.5 0.2 (68%) | 13.9 0.2 (68%) | |
| (keV) | – | – | 0.5 (68%) | 2.3 0.4 (68%) | |
| – | – | 365/783 | 327/783 | ||
| 14.8/16 | 7.8/10 | ||||
| d | 0.54 | 0.64 | |||
| 5 | – | – | 2.9(68%) | 1.7 0.9 (68%) | |
| (1022 cm-2 ) | – | – | 110 (68%) | 78 (68%) | |
| (keV) | – | – | 6.4fp | 6.4fp | |
| () | – | – | 1.47 fp | 1.67 fp | |
| () | – | – | 1.52 fp | 1.69 fp | |
| – | – | 4fp | 4fp | ||
| (degrees) | – | – | 69 1 (68%) | 66 (68%) | |
| (keV) | – | – | 8.6 (68%) | 14.0 0.2 (68%) | |
| (keV) | – | – | 0.5 0.3 (68%) | 2.3 0.4 (68%) | |
| – | – | 362/783 | 328/783 | ||
a Model 1 consists of a power law
Model 2 consists of a power law and neutral absorption at the source.
Model 3 consists of emission of a power-law modified by intrinsic neutral absorption at the source,
saturated high-energy absorption, and a Gaussian emission line.
Model 4 consists of direct emission of a power-law modified by intrinsic neutral absorption at the source,
scattered emission of a power law assuming simple Thomson scattering,
saturated high-energy absorption, and
a fluorescent Fe line from an accretion disk around a Schwarzschild black hole,
where the Fe line model is based on Fabian et al. (1989).
Model 5 consists of direct emission of a power-law modified by intrinsic neutral absorption at the source,
scattered emission of a power law assuming simple Thomson scattering,
saturated high-energy absorption, and
a fluorescent Fe line from an accretion disk around a Kerr black hole,
where the Fe line model is based on Laor et al. (1991).
All model fits include the Galactic absorption toward the source (Dickey & Lockman, 1990).
bAll absorption-line parameters are calculated for the rest frame.
cAll errors are for 90% confidence unless mentioned otherwise with all
parameters taken to be of interest except absolute normalization.
d is the probability of exceeding for degrees of freedom
if the model provides an acceptable description of the data.
| TABLE 3 | ||
|---|---|---|
| RESULTS FROM FITS TO THE COMBINED SPECTRUM OF ALL Chandra IMAGES OF THE 2005 OBSERVATION | ||
| Parametera | Values For | |
| Combined Spectrum b | ||
| Model 1: Two Gaussian Emission Lines and One Gaussian Absorption Linec | ||
| 0.7 0.2 | ||
| (1022 cm-2 ) | 9 | |
| 5.35 0.23 | ||
| 0.15(68%) | ||
| 0.5 | ||
| 6.3 | ||
| 0.5 (68%) | ||
| 1.0 | ||
| 14 2 | ||
| 2.6 (68%) | ||
| 2.4 | ||
| 17.6/20 | ||
| f | 0.6 | |
| Model 2: Disk-Line and One Gaussian Absorption Lined,g | ||
| 0.74 | ||
| (1022 cm-2 ) | 10 | |
| 6.4fp | ||
| () | 15.7 up | |
| () | 15.8 up | |
| 4fp | ||
| (degrees) | 26 | |
| 13 keV | ||
| 3 keV (68%) | ||
| 19.6/22 | ||
| f | 0.6 | |
| Model 3: Kerr Disk-Line and One Gaussian Absorption Linee,g | ||
| 0.8 | ||
| (1022 cm-2 ) | 11 | |
| 6.4fp | ||
| 1.6 | ||
| () | 1.46 up | |
| () | 1.83 up | |
| 4fp | ||
| (degrees) | 70 | |
| 13 keV | ||
| 2.6 keV (68%) | ||
| 22/22 | ||
| f | 0.45 | |
aAll absorption-line parameters are calculated for the rest frame.
bAll errors are for 90% confidence unless mentioned otherwise with all
parameters taken to be of interest except absolute normalization.
c Model 1 consists of a power law, neutral absorption at the source, two Gaussian emission lines at the source and one Gaussian absorption line at the source.
In XSPEC notation this is written as:
wabs*zwabs*(zgauss + zgauss + zgauss + pow).
d Model 2 consists of a power-law modified by intrinsic
neutral absorption, a Gaussian absorption line,
and a fluorescent Fe line from an accretion disk around a Schwarzschild black hole.
In XSPEC notation this is written as:
wabs*zwabs*(diskline + zgauss + pow).
e Model 3 consists of a power-law modified by intrinsic
neutral absorption, a Gaussian absorption line,
and a fluorescent Fe line from an accretion disk around a Kerr black hole.
In XSPEC notation this is written as :
wabs*zwabs*(laor + zgauss + pow).
f is the probability of exceeding for degrees of freedom
if the model provides an acceptable description of the data.
g indicates a parameter is fixed and indicates a parameter
unconstrained.
All model fits include the Galactic absorption toward the source (Dickey & Lockman, 1990).
| TABLE 4 | ||||
| RESULTS FROM FITS TO THE XMM-NEWTON SPECTRA OF H 1413+117 | ||||
| Fit | Modela | Parameter | XMM-Newton Valueb | XMM-Newton Valueb |
| 2001 July 29 | 2002 August 2 | |||
| PL and neutral absorption | 1.7 | 1.1 | ||
| at source | (1022 cm-2 ) | 25 | 19 | |
| (47.5)/43) | (57.0)/(43) | |||
| c | 0.3 | 0.18 | ||
| PL and neutral absorption | 1.4 | 0.9 | ||
| and emission line at source. | (1022 cm-2 ) | 19 | 14 | |
| Eemis | 5.8 keV | keV | ||
| 0.35 keV | keV | |||
| (41.5)/(38) | (47.6)/(38) | |||
| c | 0.32 | 0.14 | ||
aAll model fits include Galactic absorption of = 1.82 1020 cm-2 toward the source (Dickey & Lockman, 1990).
All fits to the XMM-Newton spectra are performed on the PN, MOS1 and MOS2 spectra.
bAll errors are for 68% confidence with all
parameters taken to be of interest except absolute normalization.
c is the probability of exceeding for degrees of freedom
if the model provides an acceptable description of the data.