High resolution imaging of the early-type galaxy NGC 1380: an insight into the nature of extended extragalactic star clusters ††thanks: Table. 4 is only available in electronic form at the CDS via anonymous ftp to cdsarc.u-strasbg.fr (130.79.128.5) or via http://cdsweb.u-strasbg.fr/cgi-bin/qcat?J/A+A/
Abstract
Context. NGC 1380 is a lenticular galaxy located near the centre of the Fornax Cluster, northeast of NGC 1399. The globular cluster system of this galaxy was previously studied only from the ground. Recent studies of similar early-type galaxies, specially lenticular ones, reveal the existence of star clusters that apparently break up the traditional open/globular cluster dichotomy.
Aims. With higher quality photometry from HST/WFPC2 we study the star clusters in NGC 1380, measuring their magnitudes, colours, sizes and projected distances from the centre of the galaxy.
Methods. We used deep archival HST/WFPC2 in the B and V bands. We built colour magnitude diagrams from which we selected a sample of cluster candidates. We also analysed their colour distribution and measured their sizes. Based on their location in the luminosity-size diagram we estimated probabilities of them being typical globular clusters as those found in the Galaxy.
Results. A total of about 570 cluster candidates were found down to . We measured sizes for approximately 200 of them. The observed colour distribution has three apparent peaks. Likewise for the size distribution. We identified the smaller population as being mainly typical globular clusters, while the more extended objects have small probabilities of being such objects. Different correlations between absolute magnitudes, sizes, colours and location were inferred for these cluster sub-populations.
Conclusions. Most extended clusters ( pc) share similar properties to the diffuse star clusters reported to inhabit luminous early-type galaxies in the Virgo galaxy cluster such as being of low surface brightness and fainter than . We also report on a small group of ( pc), , red clusters located near the centre of NGC 1380, which may be interpreted as faint fuzzies.
Key Words.:
Galaxies(individual): NGC 1380 - Galaxies: star clusters1 Introduction
The study of extragalactic star clusters has proven to be one of the key tools for the understanding of the formation and evolution of galaxies. By studying star cluster systems one can constrain the star formation history and the way the galaxies we observe today formed, merged or accreted smaller parts.
NGC 1380 is an S0 galaxy in the Fornax cluster ((m-M)=31.4 eg. Ferrarese et al. fer00 (2000)), whose globular cluster system (GCS) has only been studied from the ground (Kissler-Patig et al. kp97 (1997)). The authors find two old populations of globular clusters (GCs): a blue population ((B-V)=0.65) similar to the halo GCs of the Milky Way, which is spherically distributed around the galaxy; and a red population ((B-V)=0.94) that follows the stellar light in ellipticity and position angle associated with the bulge and disk of NGC 1380.
Globular cluster systems of massive galaxies are now well known to have a bimodal colour distribution, indicating two subpopulations of GCs.(eg. Brodie & Strader bs06 (2006)). These colour differences can be caused by age and/or metalicity differences, due to the well known age-metalicity degeneracy. Recent spectroscopic studies suggest that the colour bimodality is a result of a metalicity difference between two old subpopulations (eg. Strader et al. strader05 (2005)). Their existence indicates at least two major star forming events in the history of most massive galaxies.
Faint Fuzzy Clusters (FFs) were discovered in the nearby lenticular galaxies NGC 1023 and NGC 3384 (eg. Larsen & Brodie lb00 (2000), Brodie & Larsen bl02 (2002)). They are different from normal globular clusters and open clusters in many aspects. While the effective radius () for globular and open clusters is in the range of 2-3 pc, the of FFs range is 7-15 pc. They tend to have moderately rich metalicities [Fe/H] , and luminosities in the range of and are thought to be old. Furthermore it has been shown that the FFs of NGC 1023 lie in a fast rotating ring-like structure within the disk (Burkert, Brodie & Larsen bbl05 (2005)).
Diffuse Star Clusters (DSCs) have been found in Virgo Cluster early-type galaxies (Peng et al. peng06 (2006)). These objects span a wide range in effective radii pc, and have low luminosities (). Their median colours are redder than the red globular cluster subpopulation. They often match the colour of their host galaxy.
In the present work we study the star cluster system of the S0 galaxy NGC 1380 with deep archival Hubble Space Telescope Wide Field Planetary Camera 2 (HST/WFPC2) B and V images. We search for star cluster candidates, obtaining magnitudes, colours and measuring sizes. The paper is organised as follows: In Sect. 2 we describe the observations and the data reduction. In Sect. 3 we present the procedure we followed to obtain the photometry and discuss the colour magnitude diagrams as well as the colour distribution. In Sects. 4. and 5. we describe the procedure applied to obtain sizes and discuss correlations among relevant quantities such as , , (B-V) colour, distance to the centre. In Sect. 6 we present a summary and concluding remarks.
2 Observations and data reduction
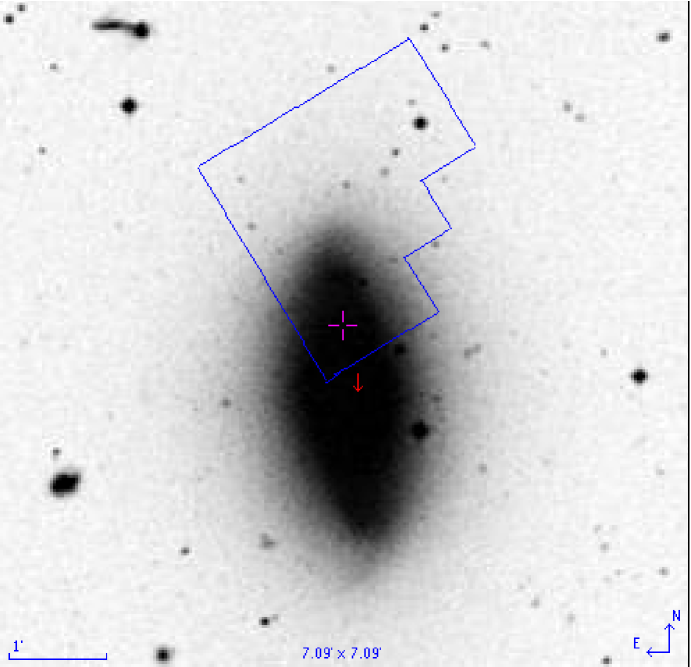
We used archival B and V images from the HST Proposal 5480, taken with the purpose of studying supernovae SN1992A. The images were obtained with the Wide Field Planetary Camera 2 (WFPC2) in the F439W and F555W filters. There is one pointing and 4 exposures for each filter, see table 1. The spatial scale is and the field is of 37″x 37″ for the planetary camera (PC). For the Wide Field Camera (WFC) the scale is , corresponding to a 80″x 80″ field.
| Rootname | Filter | Exposure Time (s) |
|---|---|---|
| U2BB0701T | F439W | 1200 |
| U2BB0702T | F555W | 900 |
| U2BB0703T | F439W | 1200 |
| U2BB0704T | F555W | 900 |
| U2BB0705T | F439W | 1200 |
| U2BB0706T | F555W | 900 |
| U2BB0707T | F439W | 1200 |
| U2BB0708T | F555W | 900 |
In Figure 1 we show the WFPC2 field of view which we were restricted to in the present work.
3 Photometry
After aligning the 4 individual exposures taken with each filter, we combined them with the STSDAS task gcombine. The resulting combined images were almost completely free of cosmic rays. We then used the IRAF DAOPHOT task daofind to detect sources with a threshold of 5 above the background on the V images. Having CCD positions of the detected sources we used the DAOPHOT task phot to perform aperture photometry. We adopted a 2 pixel aperture radius and applied an aperture correction to a 0.5″radius. The aperture corrections were of 0.31 mag (PC) and 0.18 (WFC) for F439W. For F555W the corrections were of 0.39 mag (PC) and 0.19 mag (WFC). These values were based on Table 2 of Holtzman et al. (1995a ). We followed Table 7 of Holtzman et al. (1995b ) to convert the instrumental magnitudes to the standard Johnson-Cousins B,V system, for a gain ratio of 7. We then corrected for galactic extinction adopting the values from Schlegel, Finkbeiner & Davis (sfd98 (1998)), namely and . A total of 823 sources were detected and measured on both images. In Figure. 2 we show the CMD for all these sources. Notice a strong concentration of sources in the range. This locus also spreads out in colour at fainter magnitudes because of the increasing photometric errors.

3.1 Colours
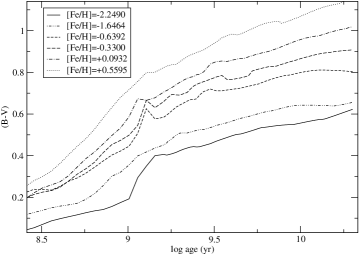
Simple stellar population models (SSPs), such as Bruzual & Charlot (bc03 (2003)), can give us an estimate of the expected range in colour of the star clusters candidates (Figure. 3). We assume a wide range in age of Gyrs; the lower age limit assumes that NGC 1380 has suffered little or no recent star formation. This is consistent with its red colours and gas paucity. We also consider a wide range in metalicity. The corresponding range in colour is . Kissler-Patig et al. kp97 (1997) find that NGC 1380 GCs have , and that objects with are most likely background galaxies. However, recent results indicate that the colours of DSCs or FFs may differ from those of typical GCs. Therefore, a more flexible colour selection is advisable. We cut the sample in colour at and also apply a cut in magnitude at , to prevent objects with excessive photometric errors or spurious sources from contaminating the sample. This colour selection criterion accommodates not only the expected colour range for different SSPs but also the spread caused by photometric errors and the possible existence of significant internal extinction in NGC 1380. With these restrictions we have 570 star cluster candidates. We call these objects as the photometric sample.
In Figure 4 we plot the colour distribution of the photometric sample. Note that there are three peaks at: . The first two peaks may be associated to the two different populations of globular clusters found by Kissler-Patig et al. (kp97 (1997)), one metal poor () and the other metal rich (). The difference in colour between the peaks shown here and those of Kissler-Patig et al. (kp97 (1997)) is . It can be explained by the clear colour gradient in NGC 1380 combined with the different regions studied. We will return to this point in Sect. 5. As for the third and very red peak, we also leave its discussion for latter.
Following Figure 3 one can attempt to constrain the ages and metalicities that correspond to the distinct cluster sub-populations according to their (B-V) colours. However, this analysis is strongly affected by the degeneracy between the effects of varying age and metalicity. For example, the first colour peak with could be a metal rich population ([Fe/H]=) with as well as a sub-solar metalicity population ([Fe/H]=) with . The second and third peaks are definetly due to an old population with super-solar metalicity, perhaps also affected by internal extinction.

4 Sizes
In order to measure sizes of the star cluster candidates we use the ISHAPE code described in Larsen (larsen99 (1999)) and apply it to one of the V images listed in Table 2. This code convolves the point spread function (PSF) with model King profiles in 2 dimensions. The resulting model image is then compared to the two-dimensional profiles of the real star cluster candidates. We have used the same HST/WFPC2 PSF as in Chies-Santos et al. (chies06 (2006)). Comparison of this PSF model to those built from WFPC2 images at other epochs shows that the PSF is stable with time. In order to derive the best fit from ISHAPE we ran the code for King models with three different concentration parameter values: c=5, 30 and 100. We managed to measure sizes for 302 detected sources (out of 823). Applying the previously defined cuts in colour and magnitude yields measured sizes for 198 star cluster candidates. As a rule, successful fits were obtained with the three values of the parameter c. We then adopted for each source the King model which minimised . In most cases this model corresponded to c=100. It is worth stressing that we did not run ISHAPE on the gcombined images; instead we ran it on the single exposure U2BB0708T, see Table 1, even though we loose S/N by doing so. The reason is that, in the process of image combining, we end up degrading the image resolution by broadening the sizes of point sources. This would inevitably lead to over-estimates of the clusters sizes with ISHAPE.
4.1 Galaxy contamination
Our sample of resolved objects (i.e., for which we could measure sizes) should be contaminated by background galaxies. This effect needs to be quantified. The most likely contaminants will be early-type galaxies close to the detection limit of our photometry, since these are more likely to be taken as stellar or nearly stellar objects. We therefore estimate their numbers by scaling down the number of E/S0 galaxies in the morphological sample of Abraham et al. (abraham96 (1996)). These authors provide morphology of galaxies in the Hubble Deep Field down to I=25 (). About E/S0 galaxies are expected within the range, which in turn corresponds roughly to . Scaling to the WFPC2 solid angle, this corresponds to about 40 galaxies in our sample. Interestingly, this is very similar to the number of sources with pc we find, assuming that they are located at the distance of NGC 1380. Thus, such objects are consistent with being background early-type galaxies rather than intrinsically very large clusters belonging to NGC 1380. We therefore cut the sample at pc in order to concentrate on the cluster population. We call this set of objects as the resolved cluster sample. In Figure. 5 we show the on-sky distribution of the resolved cluster sample as well as of the objects identified as background galaxies. Notice that while the former objects display a significant gradient towards the centre of the galaxy (towards the bottom) the later do not show this effect so clearly.

Notice that this approach of removing background galaxies relies on the assumption that they tend to be apparently more extended than stellar clusters. A few very distant early-type galaxies may therefore be still left in our star cluster sample. We also point out that some of the objects with pc could be dwarf galaxies belonging to the Fornax cluster.

In Figure 6 we plot the number ratio of the resolved cluster and background galaxies to the photometric sample, as a function of colour. One can see that this fraction is somewhat smaller for the blue cluster sub-population, in fact resulting in the elimination of the peak seen in Figure. 4. In other words, a larger fraction of blue clusters are unresolved and therefore drop out of the sample with successfully measured sizes. This result points to a size-colour trend in the sense that redder GCs tend to be larger than the bluer ones. This issue will be discussed in more detail latter. Also notice that objects with pc cover a wide colour range, but have a proportionally larger contribution to the very red population of cluster candidates in the range . In the range they account for of the sample.
4.2 Size and luminosities distributions
In Figure 7 we plot the distribution of the 159 resolved clusters (objects with pc) belonging to NGC 1380. This distribution clearly shows distinct peaks. The first peak, at pc, closely matches typical GC sizes, as attested by the solid curve, which corresponds to the distribution of sizes of GCs in the Galaxy (see below). The second peak is at pc; this may be the population of DSCs. There are some objects with pc that could also be the diffuse star clusters reported in Peng et al. (2006) or FFs.

It is very important to characterise the possible families of stellar clusters present in NGC 1380 based on their magnitudes, colours, sizes and spatial location. In particular, one of our goals is to search for possible examples of DSCs or FFs in this galaxy.
Thus, we now compare the available luminosity and size distributions of our clusters with the known distributions of typical GCs as a function of these parameters. We adopt the parametric GC luminosity and size distributions given by Bonatto et al. (bbcps06 (2007)). In this work the authors fit gaussian functions both to the distribution of half-light radii and of absolute magnitudes, , for the whole sample of Galactic globular clusters. They find
for the first and
for the second.
The size distribution fitted by those authors is overplotted to the distribution of NGC 1380 clusters in Figure 7. The curve has been re-normalised to the number of star cluster candidates of NGC 1380. It is clear from the figure that the secondary peaks at pc and pc are not well accounted for by the distribution of Galactic GCs. The pc peak is at the tail of the gaussian and the later peak is well away from it.
In Figure 8 we plot the luminosity distribution of the resolved star cluster sample separated by different intervals in . Overplotted is the luminosity distribution of the galactic globular clusters (Bonatto et al. bbcps06 (2007)) normalised to the number of star clusters of NGC 1380 with pc. It is clear from the figure that the more extended clusters tend to have lower luminosities than those with typical GC sizes ( pc). These latter, which make up the main peak in the size distribution, are likely to be the genuine sample of GCs in this galaxy. Notice that neither distributions shown in the figure are perfectly described by the fit from Bonatto et al. bbcps06 (2007). The GC-like clusters display a more pronounced peak and smaller dispersion relative to the Galactic counterparts. There is also a lack of luminous clusters in these distributions relative to what is seen in the Galaxy. This may be a selection effect due to mass segregation; i.e. the largest, and thus most luminous, clusters should be located towards the centre of NGC 1380 and are therefore not sampled in the image.

We used the available luminosity and size information for our clusters, coupled with the known distribution of GCs as a function of these parameters, in order to estimate the probability of a star cluster candidate being a globular cluster. We adopted the parametric GC luminosity and size distributions given by Bonatto et al. (bbcps06 (2007)).
Thus, under the assumption that the GCs in NGC 1380 follow the same intrinsic distributions, it is then easy to compute a relative probability of each cluster being a GC, , whose value will be for clusters with pc and .
In Figure 9 we plot the as a function of . The 3 distinct peaks seen in the size distribution are also clearly seen here, with noticeable gaps at pc and pc. For small radii, pc, ISHAPE finds somewhat discretized solutions for the sizes. The different symbols indicate different values of . Objects with the greatest probabilities of being a GC, , are located at pc and , as expected. Even though there is no strong correlation between size and luminosity, the upper-limit in luminosity varies as a function of , in the sense that the more extended clusters, with low values, tend to be less luminous. Note that the lower limit in luminosity () is due to the cut at but the upper limits are physical. A slight trend of the clusters concentrating at lower luminosities than typical GCs is also observed and has been discussed before.
Previous studies (eg. Larsen et al.larsen01 (2001), Jordán et al. jordan05 (2005)) have found that the GC bluer population is larger than the red population. This fact has been interpreted as the result of projection effects, mass-segregation or the dependence of stellar lifetimes on metalicity (Larsen & Brodie lb03 (2003), Jordán jordan04 (2004)). In Figure 10 we plot the as a function of (B-V) colour. This apparent trend between size and colour is readily seen from the figure, but seems to be largely due to the contribution of clusters with pc and . Considering all the star clusters with pc, the blue clusters are in fact larger than the red ones. When we separate the sample in size intervals the trend is reversed: for pc the red GCs are larger than the blue ones; for pc the red clusters are larger and from pc the red ones are larger.111The weighted average of the sample split in size bins is the same as the average of the entire sample. However, these differences are not statistically significant,suggestingg that the effect of blue clusters being larger than red ones stems from the fact that they are more common among the extended objects, with low values. The detailed out statistics on the colour-size relation for the NGC 1380 clusters is shown in Table 2, where mean sizes and dispersions around this mean are shown for different colour and size bins. One has to be very cautious when analysing the observed differences due to the small numbers often involved.
We also notice the existence of a separate set of red clusters () with pc, which clearly detaches from the trend just mentioned. We discuss them in the next section.
| Blue: | |||
| (pc) | NP | ||
| all | 4.25 | 3.36 | 87 |
| 1.70 | 1.23 | 45 | |
| 5.23 | 0.83 | 27 | |
| 10.15 | 1.79 | 15 | |
| Red: | |||
| (pc) | NP | ||
| all | 3.38 | 3.23 | 99 |
| 1.78 | 1.13 | 73 | |
| 5.43 | 0.82 | 14 | |
| 10.72 | 1.66 | 12 |
5 Spatial Gradients
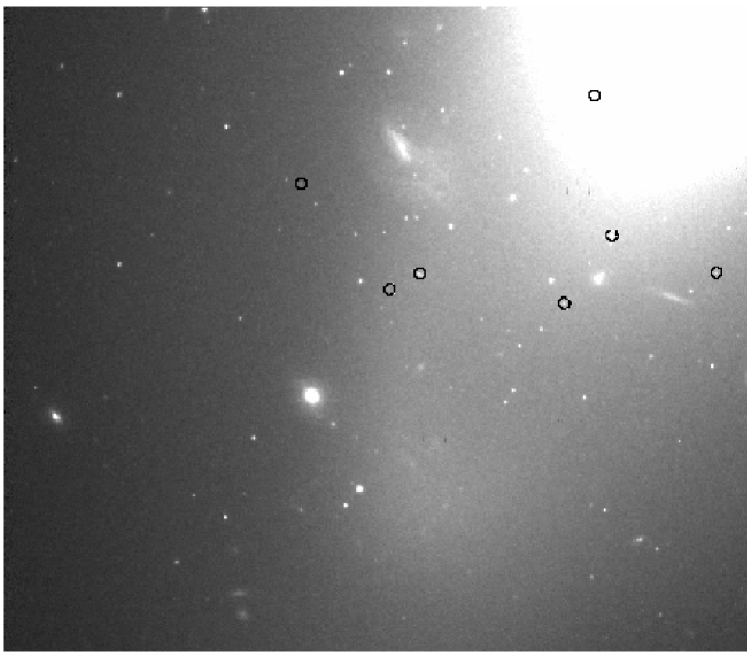
We now consider possible trends in cluster properties as a function of projected galactocentric distance. In Figure 11 we plot the as a function of this parameter. Objects with are slightly more concentrated towards the centrer, whereas clusters with the least probability of being GCs are spread at the outer parts of the galaxy. This might be caused by the fact that smaller clusters are located preferentially towards the centre, as observed in other galaxies (Larsen & Brodie lb03 (2003) and Jordán et al. jordan05 (2005)). Note that there is a general trend in the upper limit of the sizes as a function of galactocentric distance ( kpc) in the sense that the upper size limit increases as we go further out in galactocentric distance. This is what should be expected due to tidal effects. On the other hand there is a group of 7 clusters at the bottom right side of the figure that violate the general trend. Interestingly, they share other common properties: all but one of them are red clusters, seen at the top right part of Figure 10. They are also very near each other in terms of projected distance, falling at the same WFPC2 chip. Their positions on the image are shown in Figure 13.
Finally, in Figure 12 we find a trend between colour and galactocentric distance in the sense that the bluer star clusters are located towards the outer parts of the galaxy. This trend can either reflect a metalicity gradient (inner clusters are more metal rich) or the possibility of star formation occurring later on a disk than on the spheroidal part of the galaxy. The first hypothesis is supported by the fact that many studies of early type galaxies indicate an excess of heavier elements (Fe, Mg) in relation to Hydrogen in the centre (eg. Rickes, Pastoriza & Bonatto rpb05 (2004)). Notice that this colour gradient may go a long way towards explaining the colour differences between our colour peaks and those found by Kissler-Patig et al (kp97 (1997)), since these later use ground based images extending much further away from the centre of NGC 1380, therefore sampling in average bluer objects.
It seems that both the colour and size distributions are bimodal, possibly trimodal. The colour bimodality is well known (e.g Brodie & Strader bs06 (2006)) and likely reflects different events of star formation along the history of the host galaxy. As mentioned earlier, the bimodality in the sizes may be interpreted as evidence of the GC and FF/DSC populations. The later objects tend to be less luminous and more extended. But the two populations are not clearly distinct in terms of colours, although the spread in colours seems larger in the FF/DSC population (low ) than in the GC population (high ) (Figure 12).


6 Summary and concluding remarks
We have analysed deep WFPC2/HST images of NGC 1380 in the B and V filters, from which a sample of about 570 star cluster candidates was drawn. The colour distribution contains three distinct peaks, two of which have been observed in previous works form the ground (Kissler-Patig et al. kp97 (1997)). In order to better characterise these cluster subpopulations we attempted to measure sizes. We also identify three distinct peaks in the resulting size distribution, the main of them being similar to typical globular clusters, whereas the other two corresponding to more extended clusters. We compare both the luminosities and sizes of our sample to the Galactic counterparts: the extended NGC 1380 clusters are not well fit by the Galactic clusters size distribution; the extended clusters also tend to be less luminous than typical GCs in the Galaxy. We assign a probability of each cluster in our sample to be a GC, . We then search for correlations among luminosities, sizes, colours, location and . No strong versus correlation was found although the upper luminosity limit varies as a function of size in the sense that the extended sub-populations rarely reach . As for the size-colour relation we confirm that bluer objects tend to be larger than redder ones. However, this result applies to the entire cluster sample; it ceases to be true when GC-like ( pc) clusters are considered in separate. No size-colour relation is seen when the extended sub-populations are analysed alone. In fact, we observe that a larger fraction of blue GC-like clusters in the photometric sample drop out when sizes are measured, indicating that among GCs an inverse trend (bluer clusters being smaller) should hold.
We also explore correlations with projected galactocentric distance. We observe that GC-like objects () are more concentrated towards the central regions. Also, the observed upper limit in size increases with distance from the centre. These results are consistent with previous studies that find that smaller clusters are preferentially located closer to the centre, something that may result from tidal effects. We also observe a trend of bluer colours with increasing galactocentric distance. This could either reflect a metalicity gradient or an age gradient. The trend is more pronounced for the GC-like objects () whereas for the other sub-populations there is a larger spread in this correlation.
It is very important to interpret our results in light of the new star cluster populations, such as the FFs and DSCs, that have been recently proposed to exist in the literature. In particular we note that most of the extended clusters ( pc) share similar properties as the DSCs found in Virgo early-type galaxies by Peng et al. (peng06 (2006)): they are located at the locus in the vs. diagram. They are also upper bounded in luminosity at . On the other hand, the candidates found here are not necessarily redder than the redder GCs, as has been previously claimed for DSCs (Peng et al. peng06 (2006)).
We also discovered a subset of pc, , clusters located in the inner regions of NGC 1380 ( Kpc), where R is the projected galactocentric distance). These share similar properties as the FFs found in other lenticular galaxies by other authors. Their main properties are listed in Table. 3. The whole sample is presented in Table. 4 available in electronic format.
| RA(deg) | Dec(deg) | V | B | (B-V) | (pc) |
| 54.1171570 | -34.9621773 | 24.325 | 25.328 | 1.020 | 9.94 |
| 54.1123238 | -34.9600945 | 25.196 | 26.636 | 1.458 | 11.70 |
| 54.1128502 | -34.9608421 | 23.344 | 24.982 | 1.656 | 9.55 |
| 54.1206474 | -34.9649086 | 24.643 | 25.966 | 1.340 | 11.30 |
| 54.1172905 | -34.9642792 | 23.288 | 24.355 | 1.084 | 10.42 |
| 54.1082268 | -34.9611702 | 24.749 | 25.285 | 0.553 | 9.75 |
| 54.1145058 | -34.9670792 | 24.809 | 26.070 | 1.277 | 9.42 |
Acknowledgements.
We acknowledge the financial support of CNPq. We thank Charles Bonatto and Eduardo Bica for usefull discussions and the anonymous referee for the report.References
- (1) Abraham, R.G., Tanvir, N. R., Santiago, B.X. Ellis, R.S., Glazebrook K. & van den Bergh, S. 1996, ApJ, 279,L47
- (2) Bonatto, C., Bica, E.D., Chies-Santos A.L., Pastoriza M.G. & Santiago B.X., 2007, MNRAS submitted
- (3) Brodie J.& Larsen S. 2002, AJ, 124, 1410
- (4) Brodie J. & Strader J. 2006, ARA&A, 44, 193
- (5) Burkert A., Brodie J. & Larsen S. 2005
- (6) Bruzual, G. & Charlot S., 2003, MNRAS, 344, 1000
- (7) Chies-Santos, A.L., Pastoriza, M.G., Santiago, B.X. & Forbes, D.A. 2006, A&A, 455, 453
- (8) Holtzman, J. J. et al., 1995 PASP 107, 156
- (9) Holtzman, J. J. et al., 1995 PASP 107, 1065
- (10) Ferrarese, L., Mould, J. R., Kennicutt, R. C., Jr. et al. 2000, ApJ, 529, 745
- (11) Jordán, A., 2004, ApJ, 613, 117
- (12) Jordán, A., Côté, P., Blakeslee, J.P., Ferrarese, L., McLaughlin, D.E., Mei, S. et al. 2005, ApJ, 634, 1002
- (13) Kissler-Patig M., Richtler T., Storm J., and Della Valle M., 1997, A&A 327,503
- (14) Larsen, S. S. 1999, A&AS, 139, 393
- (15) Larsen S. & Brodie J.,2000, AJ, 120, 2938
- (16) Larsen S. & Brodie J. 2003, ApJ, 593 340
- (17) Larsen S.S., Brodie J.P., Huchra, J.P., Forbes, D.A. & Grillmair C.J., 2001, AJ, 121, 2974
- (18) Peng E.W, Côté P., Jordán A., Blakeslee,J.P., Ferrarese,L., Mei, S. et al. 2006, ApJ, 639, 838
- (19) Rickes,M.G., Pastoriza,M.G. & Bonatto, C., 2004, A&A, 419, 449
- (20) Strader,J., Brodie, J.P., Cenarro,A.J.,Beasley,M.A. & Forbes, D.A. 2005, AJ,130,1315
- (21) Schlegel, Finkbeiner & Davis 1998, ApJ, 500, 525