The sizes of disc galaxies in intermediate-redshift clusters
Abstract
We examine how the location of star formation within disc galaxies depends on environment at intermediate redshift. This is achieved by comparing emission-line () and restframe -band () scalelengths for matched samples of 50 field and 19 cluster star-forming, disc galaxies, with and mag. We find that at a given the majority of our cluster galaxies have smaller than those in the field, by 25 percent on average. These results are compared with studies of local galaxies, which find a very similar behaviour. From the relations of and versus -band absolute magnitude () we infer that the difference between the intermediate- cluster and field samples is mostly attributable to variation in at a given , while the versus relation is similar for the two samples.
keywords:
galaxies: clusters: general – galaxies: evolution – galaxies: spiral1 Introduction
The sizes of galaxy discs provide important constraints on a number of aspects of galaxy formation. In the modern paradigm of cold dark matter (White & Frenk, 1991) and the halo model (Cooray & Sheth, 2002), disc sizes are expected to be simply related to the properties of the dark matter halo each inhabits (Mo et al., 1998). Observed differences from this simple expectation provide insight into the details of disc galaxy formation and evolution (e.g., Mao et al., 1998).
The surface brightness profiles of discs, as measured on broadband surface photometry, are ubiquitously found to have exponential profiles (Freeman, 1970; van der Kruit & Searle, 1981, 1982). The scalelengths of these profiles are thus a sufficient descripion of disc sizes (ignoring the truncation at large radii seen in many disc galaxies). These profiles reflect the stellar mass distribution in the discs, modulo variations due to radial trends in the age and metallicity of the stellar population and extinction. Such trends are found in studies of local galaxies (de Jong, 1996), however the variations within individual discs are generally small.
One can also examine the distribution of emission-line flux in galaxies. This may be achieved using narrow-band surface photometry or spatially resolved spectroscopy. Emission line luminosity is proportional to the rate of ongoing star formation (e.g., Kennicutt, 1998). This is particularly true for the H and H lines. The other strong lines are mainly due to forbidden transitions of oxygen, and have a metallicity dependence. While this is fairly weak, it is possible that radial metallicity trends (e.g., Henry & Howard, 1995) play a role in the profiles of the forbidden lines. Herein we assume emission-line flux profiles represent the variation in star formation rate with radius. These profiles are also generally found to be exponential (at least outside of the region dominated by any bulge component), and thus can be well described by a scalelength, .
It has long been known that galaxies in clusters have distributions of properties different from those in the field, in terms of their stellar populations (Dressler et al., 1985). and morphologies (Dressler, 1980). While many of these differences may be an effect of the biased distribution of parent halo masses in dense regions, it appears that at least some aspects are due to rather more recent physical interactions between galaxies and their wider environment. The evolution of cluster galaxy populations with cosmic time has been directly observed, from star formation properties (e.g., Poggianti et al., 1999, 2006) and morphologies (e.g., Dressler et al., 1997). A wealth of studies thus suggest that a substantial fraction of galaxies have transformed from star-forming to passive over the last half of the age of the universe, with such transformations being more frequent in dense regions. While some transformations may also transform disc galaxies to ellipticals, the existence of passive spirals (Koopmann & Kenney, 1998), and prevalence of lenticular galaxies (Dressler, 1980), both preferentially found in clusters, are evidence that many do not involve major mergers. Furthermore, these suggest that the transition is fast ( Gyr); a sudden truncation of star-formation rather than a gradual decline. However, the importance of the various potential transformation mechanisms remains unclear, as is the density at which such environmental effects begin to dominate.
The picture of a rapid transformation from star-forming to passive is supported by studies of the distribution of colour and emission-line strength of nearby galaxies as a function of local galaxy density. In both quantities two distinct populations, star-forming and passive, can easily be identified. However, while the relative proportions vary strongly with environment, the distributions of the individual components do not change significantly, and there is little evidence for an emerging transition population (Balogh et al., 2004; Baldry et al., 2006). These studies suggest that the properties of star-forming galaxies do not change with environment.
There is, however, evidence for some differences between star-forming galaxies in clusters and in the field. These include the findings of Koopmann et al. (2006), that the ratio of emission-line to broadband scale length differs significantly between galaxies in clusters and the field. This is a reflection of the result of Koopmann & Kenney (2004a) that, on average, there is a suppression of star-formation in the outer regions and some enhancement in the inner regions of cluster galaxies. Moss & Whittle (2000) also show that the fraction of disc galaxies with compact, central star-formation increases with both local density and the central density of any encompassing cluster. Koopmann & Kenney (2004a) find that cluster disc galaxies have median star formation rates lower than the field by a factor of two. The opposing finding, a lack of significant variation in the star-forming galaxy H EW distribution, by Balogh et al. (2004) may be because their 3-arcsec fibre spectra do not sample the outer regions of galaxies.
It remains unclear if these limited differences are intrinsic, or whether recent environmental effects are responsible. However, strong support for an environmental interaction in local clusters, particularly with the intra-cluster medium, is supplied by the enhanced fraction of galaxies with truncated H emission (Koopmann & Kenney, 2004b), deficient or truncated HI discs (Vogt et al., 2004), and direct observations of ongoing gas stripping (Crowl et al., 2005).
While recently work has begun to constrain the variation in stellar scalelengths at intermediate redshift (e.g., Barden et al., 2005; Trujillo et al., 2006), the variation of star-formation scalelength has been left largely unstudied. An indication of a difference in the ratio of star-formation to stellar scalelength between galaxies in one cluster and those in the coeval field was found by Milvang-Jensen (2003), using an earlier analysis of part of the data considered in this letter. Beyond this, there has been no attempt to examine evolution in the dependence of the ratio on environment. We consider this further here, using a sample five times larger than previously.
2 Data
We employ VLT/FORS2 (Appenzeller et al., 1998) multi-slit spectroscopy of disc galaxies in the fields of five massive clusters at , supplemented by broadband ground-based and Hubble Space Telescope (HST) imaging. The clusters studied are MS0440, AC114, A370, CL0054 and MS1054, with velocity dispersions – kms-1 (Girardi & Mezzetti, 2001). The target selection is based on a number of aspects related to the likelihood of obtaining emission-line observations suitable for the reliable measurement of rotation velocities and scalelengths. Given the differing prior information for each field the selection is thus somewhat heterogeneous. However, while known cluster galaxies were favoured, there were no other differences in the selection criteria of cluster and field galaxies. The observations therefore provide a basis for fair comparison between the two samples.
From these data we have constructed samples of 19 cluster and 50 field galaxies, with matched redshift () and luminosity ( mag) ranges, and with reliable emission-line () and broadband () scalelengths. The data and construction of the matched samples are described fully in Bamford et al. (2005), where they are used to investigate offsets of the Tully-Fisher relation between clusters and the field, following a pilot study on an earlier analysis of the MS1054 data alone (Milvang-Jensen et al., 2003). Complete data tables, and an earlier version of the analysis in this letter, can be found in Bamford (2006). These data have also been used to investigate differences in the chemical and star-formation properties of intermediate- cluster and field galaxies (Mouhcine et al., 2006a), as well as the redshift evolution of the Tully-Fisher relation (Bamford et al., 2006) and luminosity–metallicity relation (Mouhcine et al., 2006b).
The emission-lines in the 2-dimensional spectra were analysed by a method dubbed elfit2py, whereby model emission lines are iteratively fit to the data to determine the parameter set which best describes the data, in a manner based on the technique of Simard & Pritchet (1999). Several quality criteria, including visual inspection, were used to reject any fits deemed unreliable. The primary quantities thus obtained are the rotation velocity and scalelength of the emission, which is assumed to follow an exponential profile. Note that this method differs from that employed by most other groups (e.g., Böhm et al., 2004) in that we directly compare 2-d spectra of the real and model emission lines, rather than their traces. In this way we can constrain the emission scalelength. As the primary purpose is usually to determine the rotation velocity, most other methods hold the emission-line scalelength fixed at some factor of the broadband scalelength. Note that the we obtain by this method are corrected for the effect of seeing. The emission lines measured are [OII], H, [OIII] and [OIII]. Usually more than one emission line was reliably fit for each galaxy, in which case we take the weighted mean of their parameters, after checking for consistency.
Absolute restframe magnitudes -band were obtained from sextractor (Bertin & Arnouts, 1996) Kron magnitudes, and k-corrected using available colour information to constrain the SED employed for each galaxy. Note that the magnitudes used in this letter do not include a correction for internal extinction (contrary to previous papers using these data), to aid comparison with other studies.
Seeing-corrected, broadband, disc scalelengths were obtained by fitting bulge + disc models to the ground-based and HST imaging using GIM2D (Simard et al., 2002). Only bands close to -band were used, ground-based and HST , or , corresponding roughly to restframe -band at the median redshift of our samples, . HST measurements were preferred, but for 62 percent of our sample only ground-based measurements were available. We have checked that the conclusions of this letter are unaffected by using HST- or ground-based measurements alone, except for a lower confidence due to reduced sample sizes.
Throughout this letter absolute magnitudes and scalelengths are given for a Friedmann-Robertson-Walker cosmology with , and kms-1 Mpc-1.
3 Star-formation versus stellar scalelengths
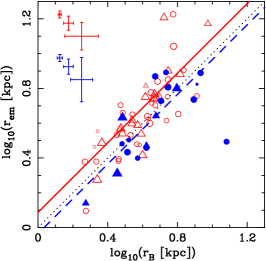
In Fig. 1 we plot (using log axes) the scalelengths of emission-line flux versus broadband light for our matched samples of intermediate- cluster and field disc galaxies. The slopes of the relation for each sample are not particularly well constrained, but show no evidence () of differing from unity. This is consistent with the evidence and usual assumptions at low-. We therefore assume unit slope, i.e. that does not vary with either quantity. We can thus simply compare the distributions of this ratio.
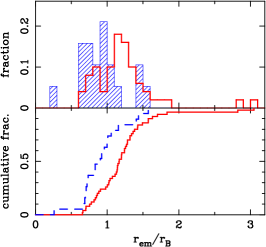
The distributions of , normalised to unit area, are plotted in the top panel of Fig. 2. The distributions appear reasonably Normal given the limited sample sizes. We estimate the average for each sample by simply taking the mean, and compute the uncertainty on the mean by the usual standard error. We also assessed the means and their uncertainites by bootstrap resampling, which gives practically identical results, further supporting the Normality of the distributions. We find and .
To determine the significance of the difference between the sample means we employ Student’s -test. Any process which may change may also affect the intrinsic scatter on , even though the measurement uncertainties on the two samples are similar. We assess this using an -test, which gives the probability of both samples being drawn from Normal populations with the same variance as percent. While not highly significant, unlikely given the small sample size, it suggests there may be a difference, in the sense that the cluster sample distribution shows a lower scatter. We thus apply a -test without the assumption of equal variances, finding a probability that the two samples have the same mean of percent, corresponding to a significance. Excluding potential outliers, by imposing cuts of kpc, does not change our overall conclusions.
We can also examine the difference between the field and cluster samples through their cumulative histograms, as shown in the bottom panel of Fig. 2. A K-S test gives the probability of the two samples being drawn from the same parent distribution as percent.
The data therefore suggest that the galaxies in our cluster sample have, on average, significantly smaller values than the field galaxies. These two samples of disc galaxies have been selected, observed and analysed together in the same way and have been matched in terms of redshift and luminosity. We thus conclude that bright, disc galaxies in intermediate- clusters possess significantly smaller ratios of their emission-line to broadband scalelengths than comparable field galaxies.
As an aside, note that the finding that cluster and field galaxies have different ratios of the emission-line versus broadband scalelengths, both locally and at intermediate-, supports the decision of Bamford et al. (2005) to allow this quantity to vary in their emission line fits. As the adopted scalelength affects the weighting of emission from regions with different line-of-sight velocities, the use of a fixed ratio by other groups may cause systematic differences in the measured rotation velocities of cluster and field galaxies.
Our findings at intermediate- correspond to a very similar result observed locally. Koopmann et al. (2006) measure the ratio of H emission-line () to -band () scalelengths for galaxies in the nearby Virgo cluster ( kms-1, Girardi et al. 1996) and local field. As our intermediate- measurements will be rather radially limited, we can best compare with their results fit over –. They find and for field and cluster galaxies, respectively. Remarkably these are very similar to our intermediate- findings, particularly within the uncertainties. Note that we expect their to be equivalent to our . Their broadband scalelengths are measured in the -band, while ours are approximately restframe -band. However, Barden et al. (2005) find that for local field galaxies the average change in disc scalelengths in going from to -band is only a percent decrease.
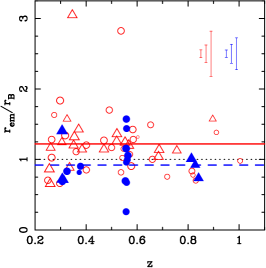
Finally, as our samples span a range in redshift, we can ask whether we can detect any significant evolution within our samples. The ratio is plotted versus redshift in Fig. 3. No evolution is discernable given the scatter and small sample sizes. With the uncertainties on our intermediate- measurements and those at low redshift, as well as the use of different techniques, we cannot quantify any evolution in the emission-line to broadband scalelength ratios for cluster and field galaxies between and today. However, we have presented strong evidence that very similar general behaviour is seen at both epochs.
4 Scalelengths versus luminosity
We now turn our attention to determining the cause of the difference in for the cluster and field disc galaxies in our intermediate- sample. To do this we consider the relations of and versus . This also has the advantage of removing any effect due to differences in the luminosity functions of the cluster and field samples on the result of the previous section.
First we require a well determined, comparable, local relation, at least for versus . To construct this we use data from the Millenium Galaxy Catalogue (MGC: Liske et al., 2003; Driver et al., 2005). This is a modern, large survey with high redshift completeness and good quality -band imaging, complemented by a wealth of additional data from SDSS and 2dFGRS. Allen et al. (2006) performed bulge+disc fits to galaxies in this survey, using GIM2D on -band images. These data are ideal for comparison with our GIM2D fits to restframe -band imaging of intermediate- galaxies. As with our data, the MGC magnitudes are uncorrected for internal extinction. The quantities have been converted to our adopted cosmology. Note that evolution of the luminosity–size relation has been investigated using the MGC to define a local relation by Cameron & Driver (2007), but here we specifically consider disc scalelengths.
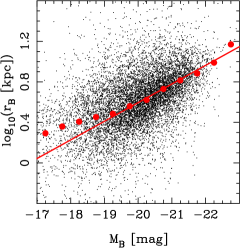
Figure 4 plots the logarithm of disc -band scalelength versus absolute -band magnitude for the disc components of MGC galaxies. Only objects judged by their quality control procedure to be physically real discs are included. In order to fit a relation to these data, we have first plotted the median in bins of width 0.5 in , and then fit a straight line to these points over the magnitude range we are concerned with, . The resulting fit is . This line is very close to the relation obtained using the data from de Jong (1995), in which the scalelengths of nearby galaxy discs were measured using a similar technique.
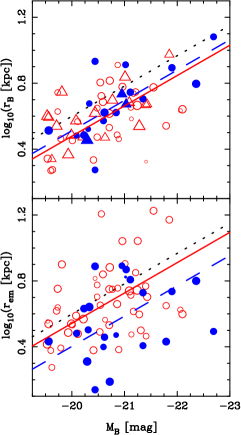
The top panel of Fig. 5 shows the relation between and for our samples of intermediate- field and cluster galaxies, along with the local MGC relation. As the slope of free fits to the intermediate- data are ill-constrained we fix the slope to that of the local MGC data and fit each sample by taking the mean of the residuals from the MGC relation. We obtain offsets from the MGC relation of and for the cluster and field samples, respectively. The field relation is thus different to that locally at a confidence level, with the distant galaxies percent smaller at a given . Though we have not given detailed consideration to selection effects, this agrees well with the results of dedicated studies, such as Barden et al. (2005). There is no significant difference between our intermediate- cluster and field samples ().
The lower panel of Fig. 5 shows versus for our intermediate- samples. The local MGC versus relation is reproduced for reference, and we assume the same slope for fitting the versus relations. As expected from the above findings, the cluster and field samples are offset from one another in this plot. The separation in is 0.14 dex, with cluster galaxies having percent smaller than field galaxies of the same luminosity. An -test shows no evidence for differing variances, so we apply a -test assuming equal variances, determining the significance of the offset between our intermediate- cluster and field samples as percent, corresponding to confidence. Thus nearly all of the difference in between the intermediate- cluster and field samples can be attributed to differences in at a given .
5 Conclusions
We find that, for a given broadband scalelength, cluster galaxies have emission-line scalelengths on average 25 percent smaller than those in the field at intermediate redshifts. This implies that star-formation in the majority of these star-forming, disc, cluster galaxies is significantly more centrally concentrated, with respect to the stellar disc, than in similar field galaxies. Our findings extend to intermediate redshift the behaviour seen in local studies. We do not detect any significant redshift evolution in for cluster or field galaxies.
From the relations of and versus -band absolute magnitude, we infer that the difference between the intermediate- cluster and field samples is mostly attributable to variation in at a given .
Acknowledgments
This work was based on observations made with ESO Telescopes at
Paranal Observatory under programme IDs 066.A-0376 and 069.A-0312, and
on observations made with the NASA/ESA Hubble Space Telescope,
obtained from the data archive at the Space Telescope Institute.
We have made use of the Millenium Galaxy Catalogue,
publicly available from http://www.eso.org/~jliske/mgc.
References
- Allen et al. (2006) Allen P. D., Driver S. P., Graham A. W., Cameron E., Liske J., de Propris R., 2006, MNRAS, 371, 2
- Appenzeller et al. (1998) Appenzeller I., et al., 1998, The Messenger, 94, 1
- Baldry et al. (2006) Baldry I. K., Balogh M. L., Bower R. G., Glazebrook K., Nichol R. C., Bamford S. P., Budavari T., 2006, MNRAS, 373, 469
- Balogh et al. (2004) Balogh M., et al., 2004, MNRAS, 348, 1355
- Bamford (2006) Bamford S. P., 2006, PhD thesis, Univ. Nottingham
- Bamford et al. (2006) Bamford S. P., Aragón-Salamanca A., Milvang-Jensen B., 2006, MNRAS, 366, 308
- Bamford et al. (2005) Bamford S. P., Milvang-Jensen B., Aragón-Salamanca A., Simard L., 2005, MNRAS, 361, 109
- Barden et al. (2005) Barden M., et al., 2005, ApJ, 635, 959
- Bertin & Arnouts (1996) Bertin E., Arnouts S., 1996, A&AS, 117, 393
- Böhm et al. (2004) Böhm A., et al., 2004, A&A, 420, 97
- Cameron & Driver (2007) Cameron E., Driver S. P., 2007, ArXiv:astro-ph/0701419
- Cooray & Sheth (2002) Cooray A., Sheth R., 2002, Phys. Rep., 372, 1
- Crowl et al. (2005) Crowl H. H., Kenney J. D. P., van Gorkom J. H., Vollmer B., 2005, AJ, 130, 65
- de Jong (1995) de Jong R., 1995, PhD thesis, Univ. Groningen
- de Jong (1996) de Jong R. S., 1996, A&A, 313, 377
- Dressler (1980) Dressler A., 1980, ApJ, 236, 351
- Dressler et al. (1997) Dressler A., et al., 1997, ApJ, 490, 577
- Dressler et al. (1985) Dressler A., Thompson I. B., Shectman S. A., 1985, ApJ, 288, 481
- Driver et al. (2005) Driver S. P., Liske J., Cross N. J. G., De Propris R., Allen P. D., 2005, MNRAS, 360, 81
- Freeman (1970) Freeman K. C., 1970, ApJ, 160, 811
- Girardi et al. (1996) Girardi M., Fadda D., Giuricin G., Mardirossian F., Mezzetti M., Biviano A., 1996, ApJ, 457, 61
- Girardi & Mezzetti (2001) Girardi M., Mezzetti M., 2001, ApJ, 548, 79
- Henry & Howard (1995) Henry R. B. C., Howard J. W., 1995, ApJ, 438, 170
- Kennicutt (1998) Kennicutt Jr. R. C., 1998, ARA&A, 36, 189
- Koopmann et al. (2006) Koopmann R. A., Haynes M. P., Catinella B., 2006, AJ, 131, 716
- Koopmann & Kenney (1998) Koopmann R. A., Kenney J. D. P., 1998, ApJ, 497, L75
- Koopmann & Kenney (2004a) Koopmann R. A., Kenney J. D. P., 2004a, ApJ, 613, 851
- Koopmann & Kenney (2004b) Koopmann R. A., Kenney J. D. P., 2004b, ApJ, 613, 866
- Liske et al. (2003) Liske J., Lemon D. J., Driver S. P., Cross N. J. G., Couch W. J., 2003, MNRAS, 344, 307
- Mao et al. (1998) Mao S., Mo H. J., White S. D. M., 1998, MNRAS, 297, L71
- Milvang-Jensen (2003) Milvang-Jensen B., 2003, PhD thesis, Univ. Nottingham
- Milvang-Jensen et al. (2003) Milvang-Jensen B., Aragón-Salamanca A., Hau G. K. T., Jørgensen I., Hjorth J., 2003, MNRAS, 339, L1
- Mo et al. (1998) Mo H. J., Mao S., White S. D. M., 1998, MNRAS, 295, 319
- Moss & Whittle (2000) Moss C., Whittle M., 2000, MNRAS, 317, 667
- Mouhcine et al. (2006a) Mouhcine M., Bamford S. P., Aragón-Salamanca A., Nakamura O., Milvang-Jensen B., 2006a, MNRAS, 368, 1871
- Mouhcine et al. (2006b) Mouhcine M., Bamford S. P., Aragón-Salamanca A., Nakamura O., Milvang-Jensen B., 2006b, MNRAS, 369, 891
- Poggianti et al. (2006) Poggianti B. M., et al., 2006, ApJ, 642, 188
- Poggianti et al. (1999) Poggianti B. M., Smail I., Dressler A., Couch W. J., Barger A. J., Butcher H., Ellis R. S., Oemler A. J., 1999, ApJ, 518, 576
- Simard et al. (2002) Simard L., et al., 2002, ApJS, 142, 1
- Simard & Pritchet (1999) Simard L., Pritchet C. J., 1999, PASP, 111, 453
- Trujillo et al. (2006) Trujillo I., et al., 2006, ApJ, 650, 18
- van der Kruit & Searle (1981) van der Kruit P. C., Searle L., 1981, A&A, 95, 105
- van der Kruit & Searle (1982) van der Kruit P. C., Searle L., 1982, A&A, 110, 61
- Vogt et al. (2004) Vogt N. P., Haynes M. P., Giovanelli R., Herter T., 2004, AJ, 127, 3300
- White & Frenk (1991) White S. D. M., Frenk C. S., 1991, ApJ, 379, 52