The Local Bubble and Interstellar Material Near the Sun
Abstract
The properties of interstellar matter at the Sun are regulated by our location with respect to a void in the local matter distribution, known as the Local Bubble. The Local Bubble (LB) is bounded by associations of massive stars and fossil supernovae that have disrupted dense interstellar matter (ISM), driving low density intermediate velocity ISM into the void. The Sun appears to be located in one of these flows of low density material. This nearby interstellar matter, dubbed the Local Fluff, has a bulk velocity of km s-1 in the local standard of rest. The flow is coming from the direction of the gas and dust ring formed where the Loop I supernova remnant merges into the LB. Optical polarization data suggest the local interstellar magnetic field lines are draped over the heliosphere. A longstanding discrepancy between the high thermal pressure of plasma filling the LB and low thermal pressures in the embedded Local Fluff cloudlets is partially mitigated when the ram pressure component parallel to the cloudlet flow direction is included.
keywords:
ISM: general, ISM: abundances1 Introduction
The existence of an area clear of interstellar material around the Sun, now known as the Local Bubble, was discovered as an underdense region in measurements of starlight reddening (Fitzgerald, 1968). This underdense region is traced by color excess measurements showing mag,111=, where is the attenuation in units of magnitude in the blue (B) and visible (V) bands, respectively. and extends beyond 100 pc in the galactic longitude interval . In the plane of Gould’s Belt, the Local Bubble boundaries (“walls”) are defined by interstellar material (ISM) associated with star forming regions. At high galactic latitudes the Local Bubble boundaries are defined by interstellar gas and dust displaced by stellar evolution, particularly supernova in the Scorpius-Centaurus Association. Supernovae exploding into pre-existing cavities created by massive star winds displace ISM and the interstellar magnetic field into giant magnetized bubbles hundreds of parsecs in extent. The location of the Sun within such a void regulates the interstellar radiation field at the Sun, and the composition and properties of the ISM surrounding the heliosphere.
The Local Interstellar Cloud (LIC), defined by the velocity of interstellar He∘ inside of the heliosphere, is one cloudlet in a low density ISM flow known as the Local Fluff. The Local Fluff has an upwind direction towards Loop I and the Scorpius-Centaurus Association (SCA). This flow, with a best-fit local standard of rest (LSR) velocity of km s-1, appears to be a break-away fragment of the Loop I superbubble shell surrounding the SCA, which has expanded into the low density interior of the Local Bubble (§2.1, Frisch, 1981; Frisch, 1995; Breitschwerdt et al., 2000).
This paper is in honor of Prof. Johannes Geiss, founder the International Space Sciences Institute (ISSI). Many of the contemporary space topics discussed at ISSI meetings, such as the heliosphere, the Local Interstellar Cloud, cosmic ray acceleration and propagation, and the composition of matter, are influenced by the solar location inside of the Local Bubble.
2 Origin and Boundaries of the Local Bubble
2.1 Origin
The Local Bubble void has been created by star formation processes that have occurred during the past 25–60 Myrs in the corotating region of the Milky Way Galaxy near the solar location of today. About 25–60 Myrs ago a blast wave evacuated a low density region at the present location of the Sun, and compressed surrounding molecular clouds to initiate the formation sequence of the massive OB stars now attributed to Gould’s Belt. Gould’s Belt denotes the system of kinematically related massive OB stars within pc of the Sun, which form a localized plane tilted by with respect to the galactic plane. The center of Gould’s Belt is 104 pc from the Sun towards =180∘, and with an ascending node longitude of 296∘ (Grenier, 2004). The Sun is moving away from the center of Gould’s Belt, and is closest to the Scorpius-Centaurus rim. Overlapping superbubbles shape the Local Bubble void (Frisch, 1995; Heiles, 1998; Maiz-Appellaniz, 2001).
Since the formation of Gould’s Belt, the Sun has traveled hundreds of parsecs through the LSR, and the LSR has completed % of its orbit around the galactic center. Molecular clouds disrupted by the initial blast wave now rim Gould’s Belt. Epochs of star formation in the Scorpius-Centaurus Association during the past 1–15 Myrs further evacuated the Local Bubble void, and displaced ISM from the SCA into giant nested Ho shells (de Geus, 1992). One of these shells, Loop I (the North Polar Spur), was formed by a recent supernova ( Myrs ago) and is an intense source of polarized synchrotron and soft X-ray (SXR) emission. A ring-like shadow, caused by foreground ISM, is seen in the Loop I SXR emission. The origin of this ring has been suggested to be the result of Loop I merging with the separate Local Bubble (e.g. Egger and Aschenbach, 1995). The LSR upwind direction of the Local Fluff is at the center of this ring, and polarization data show that the ring is a magnetic loop (Fig. 1). 222In accordance with general practice, here I use the Standard solar apex motion (velocity 19.7 km s-1, towards =57∘ and =22 ∘) to correct heliocentric velocities to the LSR. This gives a Local Fluff LSR upwind direction towards , , and LSR velocity –19.4 km s-1. In Frisch et al. (2002), we instead used an LSR conversion based on Hipparcos data, and found an LSR upwind direction =2.3∘, =–5.2∘ (velocity –17 km s-1), which is directed towards the ISM shadow itself. This difference in the two possible Local Fluff upwind directions reveals an obvious flaw in comparing a dynamically defined direction with a statically defined diffuse object such as the more distant SXRB shadow.
2.2 Boundaries
The locations of the Local Bubble boundaries have been diagnosed with a range of different ISM markers, including color excess (Lucke, 1978), ultraviolet observations of interstellar Ho lines in hot stars (York & Frisch, 1983, Paresce, 1984), radio Ho 21-cm and optical Na∘ data (Vergely et al., 2001), extreme ultraviolet (EUV, A) emission of white dwarf and M-stars (Warwick, 1993), measurements of polarization of starlight (Leroy, 1999), and the trace ionization species Na∘ (Sfeir et al., 1999, Lallement et al. 2003). These studies differ in sampling densities and spatial smoothing methods. Each marker is an imprecise tracer of the total ISM mass density, since the ISM is highly inhomogeneous over the scale lengths of the Local Bubble and small scale structure is poorly understood. I focus here on the reddening data.
An accessible measure of starlight reddening is color excess, , which measures the differential extinction of starlight in the blue versus visual bands, and is sensitive to interstellar dust grains (ISDG) of radii m. Interstellar gas and dust are generally well mixed, so that the threshold reddening for the Local Bubble walls found from data is consistent with the locations found from gas markers. The exception is that dust is found in both neutral and ionized regions, while the commonly available gas markers (Ho, Na∘) are weighted towards neutral regions.
Grains and gas are well mixed partly because both populations couple to the interstellar magnetic field () in cold and warm clouds. In cold clouds with density (H)=100 cm-3 and temperature K, the m dust grain with density 2 g cm-3 will sweep up its own mass in gas in Myrs. If the same grain has charge Z=20, the gyrofrequency for a magnetic field of strength B=2.5 G is yrs. For a warm neutral cloud ((H) cm-3, T K), the grain accumulates its own mass in Myrs. In both cloud types, grains couple to . Gas also couples to , since elastic collisions couple neutrals and ions over time-scales of years, and minimum ionization levels of bind gas to (Spitzer, 1978).
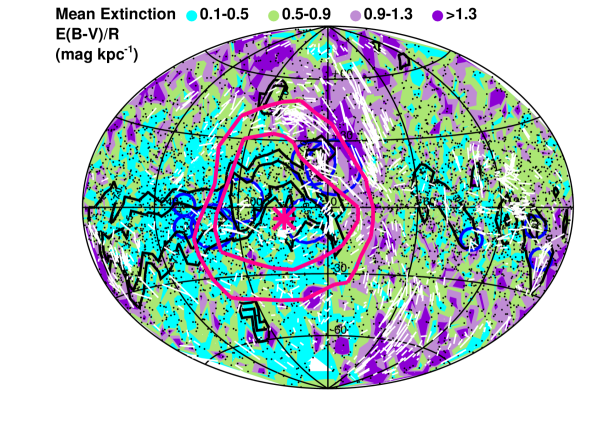
In Fig. 1, the reddening per unit distance, /, where is the star distance in kpc, is shown on an Aitoff projection for O, B, and A stars within 500 pc. values are based on Hipparcos photometric data (Perryman et al., 1997). The lowest mean ISM densities in the galactic plane are between longitudes of and are evident. Star groups (blue circles) in the low density sightlines include Sco OB2, Vela OB2, and Trumpler 10 (de Zeeuw et al., 1999). The lowest mean densities in this data set, outside of the Local Fluff, correspond to atoms cm-3. At the galactic poles, , the edges of the Local Bubble, where mag (or approximately log (H) cm-2),333The ratio /(Ho) varies in sightlines with low mean extinctions because of variations in both mean grain sizes and hydrogen ionization. are at 80–95 pc towards both the north and south poles.
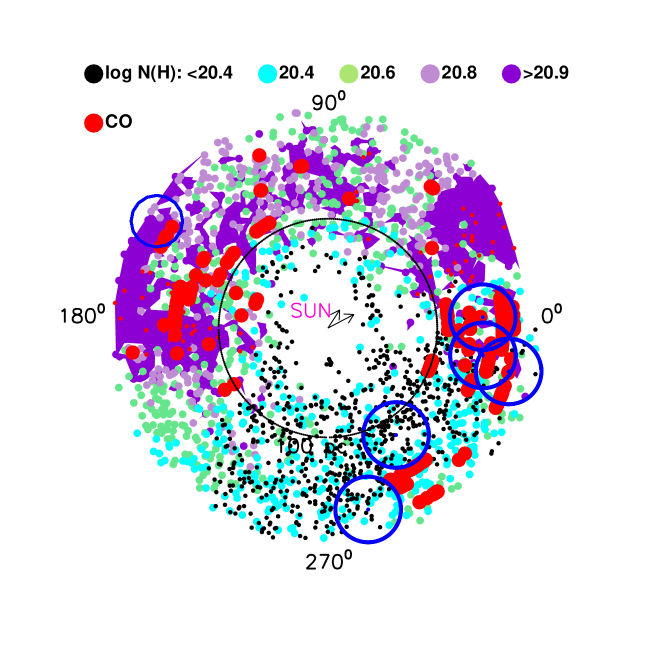
The LB boundaries in the galactic plane are shown in Fig. 2, for O, B, and A stars within pc and of the galactic plane, using a threshold cumulative value of log (H) cm-2 corresponding to mag when (H)/ cm-2 mag-1 K. This gas-to-dust ratio is good to within factors of for mag and for mag (Bohlin et al., 1978). Note the well known deficiency of ISM out to distances beyond 200 pc in the third and parts of the fourth galactic quadrants (Frisch and York, 1983). For cloudy sightlines (high mean values), the fraction of the H atoms in H2 () rises above % at mag. The classic term “intercloud” refers to low column density sightlines with relatively little H2 (%). Molecular clouds of CO and H2 are also shown, and are plotted as filled red circles (Dame et al., 2001). Well-known molecular clouds at the rim of the Local Bubble include dust in Scorpius (, d pc), Taurus (, d pc), and Chameleon (, , d pc).
The mean value of /((Ho)+2(H2)) varies by % between sightlines with low and high fractions of H2 (Bohlin et al., 1978), because of variations in the mean grain size and radiation field. The A radiation field depends on location with respect to the Local Bubble walls (§4.1), and the 912-1108 A radiation field capable of photodissociating H2 should behave in a similar fashion.
3 Loop I and the Local Magnetic Field
3.1 Loop I and the High-Latitude Limits of the Local Bubble
Above the galactic plane in the galactic-center hemisphere, , the LB walls are established by neutral gas of the Loop I superbubble. The interval is encircled by high-latitude nested shells of gas and dust. Loop I is in radius and centered 120 pc away at , for the neutral gas (Berkhuijsen 1971; Heiles, 1998; de Geus, 1992). The central regions of these evacuated shells are deficient in ISM, creating the extension of the Local Bubble towards (Fig. 2).
3.2 Magnetic Field
Loop I dominates the magnetic field structure near the Sun, and is a source of intense radio continuum and soft X-ray emission. The Loop I magnetic field, comprised of components parallel () and perpendicular () to the sightline, is traced by polarized synchrotron emission, starlight polarization caused by magnetically aligned dust grains, Faraday rotation, and Zeeman splitting of the Ho 21-cm line. Fig. 1 shows the starlight polarization vectors (from Heiles, 2000). Magnetically aligned interstellar dust grains (ISDGs) are birefringent at optical wavelengths, with lower opacities found for the polarization component parallel to . The Loop I magnetic field direction is shown by the gradient in the rotation angle of the optical polarization vectors, which follows the interaction ring feature. Comparisons between the optical polarization data (tracing ) and synchrotron emission (tracing ), indicate that is nearly in the plane of the sky in Loop I (Berkhuijsen, 1972, Heiles & Crutcher, 2005).
The closest measured strengths are towards Loop I. Heiles et al. (1980) found a volume averaged field strength of G in a tangential direction through the shell (extending pc towards , ). Faraday rotations of extragalactic radio sources indicate that is small, with an average value of G from rotation measure data (Frick et al., 2001). Magnetic pressure dominates in the neutral shell gas. In the ionized gas producing the radio continuum emission, the magnetic, gas, and cosmic ray pressures are all significant. Loop I is a decelerated shock generated by sequential epochs of star formation in SCA (de Geus, 1992)
3.3 The LIC and the Magnetic Field at the Sun
The LIC is very low density, (H) cm-3. Magnetic fields in high density ISM show evidence of flux freezing; however in low density ISM appears uncorrelated with density (Heiles & Crutcher, 2005). Pulsar dispersion measures indicate that the uniform component of the magnetic field near the Sun is G, with correlation lengths of pc (Rand & Kulkarni, 1989). In general, structure functions created from data on radio continuum polarization near 21 cm show that magneto-ionized structures in interarm sightlines must be very large (e.g. pc, Haverkorn et al., 2006). This would indicate that the uniform component is appropriate for the low density (similar to interarm) region around the Sun.
The physical conditions of the LIC have been modeled by developing a series of radiative transfer models that are constrained by observations of He∘ and pickup ion and anomalous cosmic ray data inside of the heliosphere, and observations of the LIC towards CMa. These models are discussed in detail in Slavin and Frisch (this volume, and 2007, hereafter SF07a,b). The best of these models give (H∘) cm-3, (e) cm-3, (He∘)=0.015 cm-3, for cloud temperatures 6300 K. If the magnetic and gas pressures are equal in the LIC, then the LIC field strength is G. This value is also consistent with the interface magnetic field strength of 2.5 G, adopted in the best model (model 26). However, it is somewhat above the strength of the uniform component of . Since the ISM flow past the Sun has an origin associated with the breakaway of a parcel of ISM from the Loop I magnetic superbubble (Frisch, 1981), perhaps at the Sun is stronger and perturbed compared to the uniform field, but at lower pressure than the confined parts of the Loop I bubble.
Very weak interstellar polarization caused by magnetically aligned dust grains has been observed towards stars within pc (Tinbergen, 1982). The polarization was originally understood to arise in the Local Fluff, since the polarization region coincides with the upwind direction of the flow where column densities are highest. More recently, the polarization properties were found to have a systematic relation to ecliptic geometry. The region of maximum polarization is found to be located at ecliptic longitudes that are offset by from the large dust grains flowing into the heliosphere, and from the gas upwind direction (Fig. 3, Frisch et al., 1999). Stars with high polarizations also show consistent polarization angles, and in general polarization is higher for negative ecliptic latitudes. These polarization data are consistent with the interpretation that polarizing grains are trapped in as it drapes over the heliosphere (Frisch, 2005, 2006). When magnetically prealigned (by ) grains approach the heliosphere, the gas densities are too low to collisionally disrupt the alignment, and polarization should indicate the direction of at the heliosphere. If the alignment mechanism is sufficiently rapid, the alignment strength and direction will also adjust to the interstellar magnetic field direction as it drapes over the heliosphere. Although this interpretation of the polarization data is not confirmed, it fits the physics of dust grains interacting with the heliosphere. Small charged grains such as those that polarize starlight ( m) couple to and are excluded from the heliosphere, while large grains enter the heliosphere where they are measured by various spacecraft (Krueger, this volume). The characteristics of such polarization may vary with solar cycle phase.
4 Radiation Environment of the Local Bubble
4.1 Inhomogeneous Radiation field and Local Fluff Ionization
The interstellar radiation field (ISRF) is key to understanding the physical properties of the LIC and Local Fluff. The sources of the ISRF at the Sun include plasma emission from the Local Bubble interior and supernova remnants, stellar radiation, including from hot white dwarf stars, and emission from a conductive interface between the local fluff and the hot plasma. The spectrum of this field at the surface of the LIC is shown in Slavin and Frisch (this volume).
The spectrum of the ISRF is inhomogeneous because of the energy-dependent opacity of the ISM. For instance, radiation with A (584 A) determines the ionizations of H (He). Energetic photons capable of ionizing Ho (He∘) require (Ho) (17.7) cm-2 to reach an opacity . The dependence of on (Ho) drives the need for LIC photoionization models to determine the heliosphere boundary conditions. Stars within pc (e.g. Wood et al. 2005) show local column density variations of log (Ho) cm-2 dex (assuming log D/H). This yields a range locally of , and shows that ionization must vary between the individual cloudlets comprising the Local Fluff. This variation is confirmed by N+ data, which are excellent tracers of H+ through charge-exchange. Stars within 70 pc show N+/N∘ (SF07a,b). Our LIC radiative transfer models indicate that in the LIC Ho ionization provides % of the cloud heating, and the LIC is % ionized (SF07a,b).
Another example of the inhomogeneous ISRF is provided by the photon flux at A, which TD-1 satellite data show depends on position in the Local Bubble (Gondhalekar et al., 1980). The ISRF at 1565 A is dominated by hot stars, B or earlier. Radiation at A regulates the photoionization rate of interstellar Mg∘, and is an important parameter for the Mg+/Mg∘ diagnostic of the interstellar electron density. The ISDG albedo at A is . Figure 1 shows the flux of 1565 A photons at the Sun, plotted as black contours. The brightest regions of the sky at 1565 A are in the third and fourth galactic quadrants, , where the mean extinction in the interior of the Local Bubble is low, mag kpc-1.
The fact that the 1565 A radiation field is enhanced near the galactic plane for is relevant to our understanding of the more energetic photons associated with the soft X-ray background (SXRB). Isolated bright SXRB regions are seen, such as the Orion-Eridanus and Loop I enhancements, however no regional enhancement in the SXRB flux is seen corresponding to the bright A regions.

4.2 Diffuse Soft X-Ray Background
The diffuse soft X-ray background (SXRB) is significant both as an ionizing and heating radiation field, and as a fossil that traces the supernovae that formed the Local Bubble.
The spectrum of the soft X-ray background (SXRB) emission determined using broadband sounding rocket observations at energies keV revealed an excess of count rates at low energies in the galactic plane, compared with the spectrum predicted by an absorbed K plasma. This effect was interpreted as indicating a local X-ray plasma with less than cm-2 of foreground hydrogen (Juda et al., 1991). The complex SXRB spectrum includes this local hot plasma, inferred to fill the LB, along with contributions from absorbed galactic halo emission, extragalactic emission, and absorbed local supernova remnants such as Loop I which dominates the northern hemisphere sky.
Fast-forwarding to the present, the LB contributions to the SXRB have been found from broadband ROSAT data (0.18 – 0.3 keV) and XMM Newton spectra of dark clouds that help isolate the LB flux from foreground and background fluxes, combined with SXRB models that include foreground contamination from charge-exchange between the solar wind and neutral interstellar or geocoronal gas (e.g. Robertson and Cravens, 2003; Snowden et al., 2004; Bellm and Vaillancourt, 2005; Henley et al. 2007; Lallement, this volume ). The contribution of CEX to the SXRB is significant above keV, and is limited by the SXRB flux that does not anticorrelate with (Ho). Models of the contributions of heliospheric charge exchange to the SXRB measured by ROSAT indicate that % of the SXRB in the galactic plane and % at high galactic latitudes may arise from CEX, depending on the adopted model for CXE fluxes, the solar cycle phase, and ecliptic latitude of the look direction. LB plasma models with depleted abundances predict approximate consistency between the ROSAT and sounding rocket SXRB data. Comparisons between XMM Newton spectra acquired while pointing on and off of a dark cloud in principle allow the removal of foreground heliospheric CEX. For a solar abundance plasma model, based on recent values (Asplund, this volume), the radius of the cavity filled with plasma is pc, with plasma density (e)=0.013 cm-3, pressure cm-3 K, a cooling time of 17 Myrs, and a sound-crossing time of 1.2 Myrs. The LB plasma properties are a topic of ongoing research because the foreground contamination from CEX and contributions to the SXRB spectra contributed by the halo and disk gas are poorly understood.
The LIC ram pressure, , may be important for the pressure equilibrium between the LIC and LB plasma. At the Sun, the SF07 LIC models find a total density of (Ho+H+) atoms cm-3, and (e) cm-3, for K, giving a static LIC pressure of cm-3 K (including He). For a relative LIC-LB velocity of km s-1, cm-3 K, so that helps offset the high LB thermal pressure in one dimension. However, for the LIC ram pressure to remove the longstanding mystery about the pressure equilibrium between the LIC and LB plasma, additional pressure contributions (e.g. from magnetic and cosmic ray) are required for directions perpendicular to the relative LIC-hot gas velocity vector.
5 The LIC and the ISM Flow Past Sun
5.1 Kinematics of Local Fluff
The LIC is part of an localized ISM flow that has been denoted the Local Fluff, or Cluster of Local Interstellar Clouds (CLIC). The best fitting heliocentric flow vector for ISM within pc is km s-1, from the direction , (Frisch et al. 2002). In the LSR, the upwind direction is towards the center of Loop I (footnote 2, §2.1). The flow is decelerating; in the rest frame of the flow velocity, the fastest components in the upwind and downwind directions are blue-shifted by over 10 km s-1. Individual cloudlets contribute to the flow, including the LIC, the “G-cloud” within 1.3 pc in the upwind direction, and the Apex cloud within 5 pc in the upwind direction and extending towards . These cloudlets have the same upwind directions to within , indicating a common origin for the cloudlets comprising the Local Fluff. Alternate interpretations using Local Fluff kinematics and temperatures have parsed the flow into spatially distorted components (Linsky, this volume). However, velocity components towards stars in the sidewind direction can not clearly distinguish between individual clouds because of velocity blending.
5.2 Interstellar Abundances
The abundance pattern of elements in interstellar gas is characterized by abundances that decrease with increases in the mean gas density ((H)) or elemental condensation temperature (). Most depletion studies are based on long sightlines with blended velocity components. Our LIC radiative transfer models derive elemental abundances corrected for ionization, for a single low density cloud in space (SF07a,b). For the best models in SF07b, LIC abundances are O/H=295-437 ppm, compared to solar abundances 460 ppm (Asplund, this volume), and N/H=40–66 ppm, compared to solar values 61 ppm. The LIC S/H ratios are 14–22 ppm, compared to solar values 14 ppm. If the LIC has a solar composition, as indicated by anomalous cosmic ray data for 22Ne and 18O (Cummings, this volume), then Asplund solar abundances are preferred over earlier values. Carbon is found to be overabundant by a factor of compared to solar abundances, which helps maintain the LIC cloud temperature near the observed temperature of 6300 K through C fine-structure cooling. The C-abundance anomaly appears to be due to the destruction of carbonaceous grains by interstellar shocks. The carbon overabundance is consistent with the deficit of small carbonaceous grains causing the 2200 A bump and far-ultraviolet rise in the ultraviolet extinction curves in some regions.
Acknowledgements: I thank the organizers of the Geiss-fest for a stimulating meeting, and ISSI for recognizing long ago that the interaction of local ISM and the heliosphere is a fascinating topic. NASA grants NNG05GD36G, NNG06GE33G, and NAG5-13107 supported this work. The Hipparcos data-parsing tool was developed by Prof. Philip Chi-Wing Fu, under the auspices of NASA grant NAG5-11999.
References
- [Bellm & Vaillancourt(2005)] Bellm, E. C. & Vaillancourt, J. E. 2005, ApJ, 622, 959
- [Bohlin et al.(1978)Bohlin, Savage, & Drake] Bohlin, R. C., Savage, B. D., & Drake, J. F. 1978, ApJ, 224, 132
- [Breitschwerdt et al.(2000)Breitschwerdt, Freyberg, & Egger] Breitschwerdt, D., Freyberg, M. J., & Egger, R. 2000, A&A, 361, 303
- [Dame et al.(2001)Dame, Hartmann, & Thaddeus] Dame, T. M., Hartmann, D., & Thaddeus, P. 2001, ApJ, 547, 792
- [de Geus(1992)] de Geus, E. J. 1992, A&A, 262, 258
- [de Zeeuw et al.(1999)de Zeeuw, Hoogerwerf, de Bruijne, Brown, & Blaauw] de Zeeuw, P. T., Hoogerwerf, R., de Bruijne, J. H. J., Brown, A. G. A., & Blaauw, A. 1999, AJ, 117, 354
- [Egger & Aschenbach(1995)] Egger, R. J. & Aschenbach, B. 1995, A&A, 294, L25
- [Fitzgerald(1968)] Fitzgerald, M. P. 1968, AJ, 73, 983
- [Frick et al.(2001)Frick, Stepanov, Shukurov, & Sokoloff] Frick, P., Stepanov, R., Shukurov, A., & Sokoloff, D. 2001, MNRAS, 325, 649
- [Frisch(1981)] Frisch, P. C. 1981, Nature, 293, 377
- [Frisch(1995)] Frisch, P. C. 1995, Space Sci. Rev., 72, 499
- [Frisch(2005)] Frisch, P. C. 2005, ApJ, 632, L143
- [Frisch(2006)] Frisch, P. C. 2006, ApJ, submitted
- [Frisch et al.(1999)Frisch, Dorschner, Geiss, Greenberg, Grün, Landgraf, Hoppe, Jones, Krätschmer, Linde, Morfill, Reach, Slavin, Svestka, Witt, & Zank] Frisch, P. C., Dorschner, J. M., Geiss, J., et al. 1999, ApJ, 525, 492
- [Frisch et al.(2002)Frisch, Grodnicki, & Welty] Frisch, P. C., Grodnicki, L., & Welty, D. E. 2002, ApJ, 574, 834
- [Frisch & York(1983)] Frisch, P. C. & York, D. G. 1983, ApJ, 271, L59
- [Gondhalekar et al.(1980)Gondhalekar, Phillips, & Wilson] Gondhalekar, P. M., Phillips, A. P., & Wilson, R. 1980, A&A, 85, 272
- [Grenier(2004)] Grenier, I. A. 2004, ArXiv Astrophysics e-prints
- [Haverkorn et al.(2006)Haverkorn, Gaensler, Brown, Bizunok, McClure-Griffiths, Dickey, & Green] Haverkorn, M., Gaensler, B. M., Brown, J. C., et al. 2006, ApJ, 637, L33
- [Heiles(1998)] Heiles, C. 1998, ApJ, 498, 689
- [Heiles(2000)] Heiles, C. 2000, AJ, 119, 923
- [Heiles et al.(1980)Heiles, Chu, Troland, Reynolds, & Yegingil] Heiles, C., Chu, Y. ., Troland, T. H., Reynolds, R. J., & Yegingil, I. 1980, ApJ, 242, 533
- [Heiles & Crutcher(2005)] Heiles, C. & Crutcher, R. 2005, ArXiv Astrophysics e-prints
- [Henley et al.(2007)Henley, Shelton, & Kuntz] Henley, D. B., Shelton, R. L., & Kuntz, K. D. 2007, ArXiv Astrophysics e-prints
- [Juda et al.(1991)Juda, Bloch, Edwards, McCammon, Sanders, Snowden, & Zhang] Juda, M., Bloch, J. J., Edwards, B. C., et al. 1991, ApJ, 367, 182
- [Lallement et al.(2003)Lallement, Welsh, Vergely, Crifo, & Sfeir] Lallement, R., Welsh, B. Y., Vergely, J. L., Crifo, F., & Sfeir, D. 2003, A&A, 411, 447
- [Leroy(1999)] Leroy, J. L. 1999, A&A, 346, 955
- [Lucke(1978)] Lucke, P. B. 1978, A&A, 64, 367
- [Maíz-Apellániz(2001)] Maíz-Apellániz, J. 2001, ApJ, 560, L83
- [Paresce(1984)] Paresce, F. 1984, AJ, 89, 1022
- [Perryman(1997)] Perryman, M. A. C. 1997, A&A, 323, L49
- [Rand & Kulkarni(1989)] Rand, R. J. & Kulkarni, S. R. 1989, ApJ, 343, 760
- [Robertson & Cravens(2003)] Robertson, I. P. & Cravens, T. E. 2003, Journal of Geophysical Research (Space Physics), 108, 6
- [Sfeir et al.(1999)Sfeir, Lallement, Crifo, & Welsh] Sfeir, D. M., Lallement, R., Crifo, F., & Welsh, B. Y. 1999, A&A, 346, 785
- [Slavin & Frisch(2006)] Slavin, J. D. & Frisch, P. C. 2007, A&A, in preparation
- [Snowden et al.(2004)Snowden, Collier, & Kuntz] Snowden, S. L., Collier, M. R., & Kuntz, K. D. 2004, ApJ, 610, 1182
- [Spitzer(1978)] Spitzer, L. 1978, Physical Processes in the Interstellar Medium (John Wiley & Sons, Inc.)
- [Tinbergen(1982)] Tinbergen, J. 1982, A&A, 105, 53
- [Vergely et al.(2001)Vergely, Freire Ferrero, Siebert, & Valette] Vergely, J.-L., Freire Ferrero, R., Siebert, A., & Valette, B. 2001, A&A, 366, 1016
- [Warwick et al.(1993)Warwick, Barber, Hodgkin, & Pye] Warwick, R. S., Barber, C. R., Hodgkin, S. T., & Pye, J. P. 1993, MNRAS, 262, 289
- [Wood et al.(2005)Wood, Redfield, Linsky, Müller, & Zank] Wood, B. E., Redfield, S., Linsky, J. L., Müller, H.-R., & Zank, G. P. 2005, ApJS, 159, 118