H in the Integrated Light of Galaxies: What Are We Actually Measuring?
Abstract
We present a cautionary study exploring the reliability of the H line in the integrated spectra of galaxies for determining galaxy ages. Our database consists of the observed integrated spectra of 120 early-type galaxies, of 7 metal-rich globular clusters in M31 and the Galactic globular cluster 47 Tuc, and of the open cluster M67. We have measured H using index definitions designed to assess contamination from the CN molecule in and around H by choosing combinations of bandpasses that both avoid and include a region of CN molecular lines redward of H. We find systematic differences in the ages derived from H measurements among the various definitions when extracting ages from H in old stellar populations with enhanced CN bands due to non-solar abundance ratios. We propose that neighboring CN lines have a strong effect on pseudocontinuum and central bandpass levels. For stellar populations which have non-solar abundance ratios in C and/or N, population synthesis models that do not account for abundance ratio variations cannot reproduce accurately the CN 4216 Å band, which leads to a corresponding inaccuracy in reproducing the various H indices. Hence, caution must be used when extracting galaxy ages from the H line in old stellar populations with significant non-solar abundance ratios.
1 Introduction
To derive luminosity weighted mean ages from the integrated light of galaxies, the standard method is to measure the strengths of hydrogen Balmer lines and compare them to stellar population synthesis models. Balmer lines are used as age indicators because they are sensitive to the temperature of main sequence turn-off stars. Balmer lines are most pronounced in A stars and hence peak in the integrated light of a stellar population once O and B stars have ended their evolution. For ages older than 0.5–1 Gyr, Balmer lines decrease in strength as a stellar population gets older. This is because turnoff stars become dimmer, thus contributing less to the integrated light, and cooler so that Balmer lines become weaker in their spectra.
The redder region of the studied spectrum, which includes the Balmer line H, has been extensively studied, as the strongest absorption lines are relatively uncrowded compared to regions blueward making them less difficult to measure. In particular, the Lick/IDS index system (Faber et al., 1985; Gorgas et al., 1993; Worthey et al., 1994) concentrate on prominent features that lie in this red region (Worthey et al., 1994). Consequently, H has been widely used as an age indicator. It is only slightly contaminated by metallic lines and hence relatively insensitive to the age/metallicity degeneracy and to abundance ratio affects (Worthey et al., 1994; Tripicco & Bell, 1995; Trager et al., 2000) compared to the more crowded Balmer lines in the blue. These characteristics establish it as well-suited for age diagnostic purposes. In the past two decades, indices bluer than 4500 Å have received attention as well, and age studies have been expanded to include higher order Balmer lines (Rose, 1985, 1994; Jones & Worthey, 1995; Vazdekis & Arimoto, 1999; Vazdekis et al., 2001; Caldwell, Rose, & Concannon, 2003). Recent studies have included newer Lick-style indices defined in Worthey & Ottaviani (1997) (hereafter WO97) that focus on the higher order Balmer lines H and H (Vazdekis, 1999; Schiavon et al., 2002). In addition, Vazdekis & Arimoto (1999) and Vazdekis et al. (2001) have investigated specifically tuned indices for H, and Rose(1985, 1994) has introduced line ratio indices for comparing Balmer lines with neighboring metal lines in galaxies.
Higher order Balmer lines, especially H, become necessary for studies at significant lookback times, since H is redshifted into an increasingly problematic night sky spectrum at even modest redshift. H and other higher order Balmer lines are also important for breaking the degeneracy between age and horizontal branch morphology (and other hot star population) effects (Leonardi & Rose, 2003; Schiavon et al., 2004b), and to distinguish single age populations from multi-population scenarios (Schiavon, 2006). In other words, to move beyond establishing simply a luminosity-weighted mean age and metallicity of a galaxy from its integrated spectrum requires the more subtle undertaking of comparing the strengths of different Balmer lines with population models based on different star formation histories. Additionally, higher order Balmer lines are less affected than H by line core fill-in due to emission from ionized gas (WO97). The primary drawback of using higher order Balmer lines is the crowded blue region of the spectrum in which they lie, making measurements of these lines, uncontaminated by neighboring features, difficult.
Although H appears in some respects to be the cleanest of the higher order Balmer lines, it is still at risk for contamination, especially in older populations where the feature is weak. In the pseudocontinuum regions near the H feature there are several Fe absorption lines which create sensitivity to metallicity, hence increasing the age/metallicity degeneracy. Moreover, several studies have mentioned the possibility for nearby CN molecular lines affecting the H measurements. WO97 note the overlap of CN absorption on the H feature, but show no effect on the measured abundances. More recently, Schiavon et al. (2002) addressed the influence of CN and CH lines on indices in the blue and suggested that CN lines could have affected previous age estimates for giant elliptical galaxies. Dressler et al. (2004) also noted a depression in the integrated red continuum near H in models with increased CH and CN lines.
The possibility of CN molecular lines overlapping with the H passbands causes concern for studies of intermediate age and old stellar populations, where CN-strong giant branch stars contribute significantly to the integrated light. Because most stellar population synthesis models rely on solar abundance ratio isochrones and stellar spectral libraries (see, however, Korn et al. (2005)) and massive ellipticals in general exhibit non-solar abundance ratios (Worthey et al., 1992; Kuntschner, 2000, and references therein), CN molecular lines may not be modelled accurately in these stellar populations. Evidence for the impact of CN lines on blue absorption line indices has recently been provided by Prochaska et al. (2005), in a study of the Ca4227 index. They found a notable difference in calcium abundance estimates for early-type galaxies when using an index definition with only a red continuum passband, Ca4227r, as opposed to the conventional Lick style index. This effect is due to a depression of the blue pseudocontinuum of the Ca4227 index, caused by the presence of a CN bandhead in the pseudocontinuum window. This CN bandhead, located at 4216, is avoided in the Ca4227r measurement, which makes this newly defined index relatively more immune to the effect of CN contaminination and therefore a cleaner indicator of calcium abundance. Although the CN molecular band is most pronounced at the bandhead located at 4216 Å, it extends blueward to the H feature. Thus, a similar effect is possible for H measurements.
This paper provides a cautionary study that characterizes the influence of non-solar abundance ratios on H-derived ages in the integrated light of early-type galaxies. We measure H using a variety of index measurements designed to assess contamination from CN molecular lines in and around the H feature. In §2, we introduce the data and models. We discuss the region of H and our index definitions in §3. In §4 we explain the measurements of indices used in this paper. In §5 we present our results on the reliability of H as an age indicator, and in §6 we briefly examine the implications of the results, providing cases where this study is most relevant and pointing toward possible solutions.
2 Observational Data and Models
2.1 Observations
The observational data used in this paper consist of integrated spectra of 119 early-type galaxies, seven metal-rich globular clusters in M31, the open cluster M67, and the Galactic globular cluster 47 Tucanae. The spectra come from the following sources:
Spectra for the 119 early-type galaxies, including M32, come from the work of Caldwell, Rose, & Concannon (2003) (hereafter CRC03) and are fully described in that paper. Here we briefly summarize the observational setup. The spectra were obtained with the 1.5m Tillinghast Telescope, FAST spectrograph, and a Loral 512 x 2688 pixel CCD (Fabricant et al., 1998) at the F. L. Whipple Observatory. The spectra have a dispersion of 0.75 Å/pixel and a resolution of 3.1 Å FWHM, and cover the wavelength region 3500-5500 Å. Young galaxies (EWH 3.0) and high H emission galaxies (H emission correction 0.3 Å in EW, see § 4.2) were removed from the original CRC03 sample of 175 galaxies.
Spectra for globular clusters in M31 were acquired with the Hectospec multi-fiber spectrograph (Fabricant et al., 2005) on the MMT at Mt. Hopkins, AZ. The wavelength range covered is 3700-9150 Å, at a dispersion of 1.2 Å/pixel and a resolution of 4.5 Å FWHM. Seven old, metal rich star clusters were randomly selected from a large sample of clusters observed for another project.
The integrated spectrum of the open cluster M67 comes from Schiavon et al. (2004a). Briefly, the integrated spectrum of M67 was constructed from individual spectra of cluster members at representative locations in the color-magnitude diagram. The spectra were obtained with the same observational setup as for the CRC03 galaxy spectra above. Details of how the individual spectra were weighted and then combined into a representative integrated spectrum of M67 are given in Schiavon et al. (2004a).
The integrated spectrum of the metal-rich Galactic globular cluster 47 Tuc comes from the Schiavon et al. (2005) library of integrated spectra of Galactic globular clusters. The integrated spectra were acquired with the R-C spectrograph on the Blanco telescope at the Cerro Tololo Inter-American Observatory and a Loral 3Kx1K CCD. The wavelength coverage is 3360-6430 Å, at a dispersion of 1.0 Å/pixel, and a spectral resolution of 3.1 Å. To obtain a representative integrated spectrum of 47 Tuc, the slit was trailed over the central core diameter of the cluster, as is further described in Schiavon et al. (2005).
2.2 Population Synthesis Models
To extract the ages, as well as abundances of Fe and other elements, from integrated light requires comparison of the observed line strengths in integrated spectra to the predictions of a grid of stellar population synthesis models covering a range in age and chemical composition. In this paper we use the population synthesis models of Vazdekis (1999) which are fully described in that paper 111Vazdekis models are available at http://www.iac.es/galeria/vazdekis/. In this paper, we used the Vazdekis model spectral energy distributions (SED’s) based on the stellar library of Jones (1998) and computed for a Kroupa Revised power law IMF with an exponent equal to -1.3, in an age range where SED’s are considered reliable. The spectral resolution of Vazdekis model SED’s is 1.8 A (FWHM). The result is a set of output integrated spectra covering a range in age and metallicity, which can then be smoothed to match the resolution of the observational data.
2.3 Synthetic Spectra with CN Abundance Anomalies
It is well known that massive early-type galaxies are characterized by enhanced CN abundances in their spectrum, as compared to stars with solar abundance ratios (Trager et al., 1998; Worthey, 1998). Spectral libraries from which population synthesis models are based, such as those mentioned in the previous section, lack stars with a CN enhancement similar to that found in early-type galaxies. To investigate the behavior of CN molecular lines in the region of H, it is therefore necessary to turn to spectrum synthesis based on highly developed model atmospheres and a complete database of atomic and molecular data.
In the present investigation, we use the synthetic spectra computed by Bruno Castilho (see Schiavon et al., 2002, for a discussion). These spectra were computed using the Kurucz model atmospheres and an accurate and complete list of absorption line wavelengths and opacities. The computations were performed at very high resolution (0.04 Å FWHM) and the spectra were later rebinned and gaussian convolved to the dispersion and resolution of the Vazdekis models. The stellar parameters considered were those of typical red giant (Teff=4750 K, log=2.5), turnoff (6000 K, 4.0), and subgiant (5250 K, 3.0) stars in the globular cluster 47 Tuc. The spectra were computed for an overall metallicity of [Fe/H]=-0.5, using two different abundance patterns: one for solar chemical composition (scaled to [Fe/H] = -0.5 dex) and the other for the abundance pattern of CN-strong/CH-weak stars in metal-rich Galactic globular clusters, specifically, [C/Fe]=-0.2 and [N/Fe]=0.8. In the case of metal-rich Galactic globular clusters, the abundance pattern is characterized by a high nitrogen abundance and a mild carbon underabundance, rather than an overabundance in both C and N, such as might be expected in early-type galaxies. The net effect, however, is to enhance the opacity due to the CN molecule (since N is fractionally increased at a higher level than C is decreased), thus producing the desired result.
3 Measurements of the H Line Strength
3.1 The Spectral Region Around H
In the most straightforward approach to measuring the strength of absorption lines in integrated light, an equivalent width index for a spectral feature (or a magnitude equivalent of it) is constructed from the pseudocontinuum flux (determined from bandpasses to the blue and red end of the feature of interest) and from the flux in a bandpass centered on the feature itself. We refer to the resulting index as a pseudo-equivalent width measurement, because only a pseudocontinuum is measured in the two sidebands; the true continuum is usually impossible to locate at the spectral resolution typically used in galaxy integrated spectroscopy. For the same reason, it is impossible to avoid blending effects in the index bandpass. Thus, in designing index definitions of this style, it is important to isolate, to the extent possible, the relevant feature from other nearby features that could overlap in the bandpass of the feature itself or contaminate the equally important pseudocontinuum bandpasses.
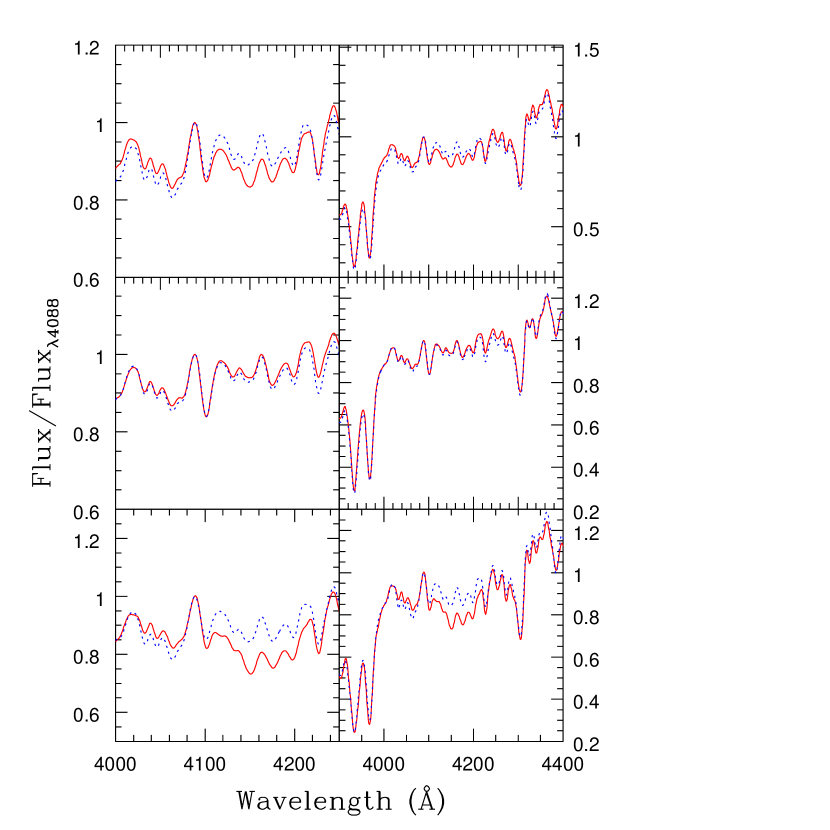
Because it is located in a very crowded spectral region, the H line (4101 Å) is difficult to isolate from nearby lines, especially in the spectra of older populations where H is weaker compared to neighboring metal lines. The middle and bottom panels of Fig. 1, which show stellar spectra from the Indo-US Library of Coude Feed Stellar Spectra 222The Indo-US Library of Coude Feed Stellar Spectra can be found at http://www.noao.edu/cflib/ for a late G giant and a K dwarf respectively, illustrate this difficulty. Fe lines are apparent in the spectra, most notably at 4045, 4063, 4072, 4119, 4132, and 4144 Å (Thomas et al., 2004). These Fe lines produce absorption in the continuum sidebands or in the feature bandpass itself, and thereby contribute to a metallicity sensitivity in the H index. A result is the well-known age-metallicity degeneracy effect that complicates stellar population synthesis studies (e.g. Worthey 1994). In principle, if the ‘contamination’ of other features in either the sidebands or central bandpass of an H index is properly accounted for in stellar population modelling, then reliable ages and metallicities can indeed be extracted from a comparison of the observed integrated spectrum of a galaxy with spectral indices generated in population models. However, it has been found that the stellar abundance patterns in early-type galaxies frequently differ from the solar neighborhood stars on which the models are based. In particular, massive, early-type galaxies are enhanced in elements, such as Mg, as compared to Fe (Worthey et al., 1992; Davies et al., 1993; Trager et al., 2000; Kuntschner, 2000, and references therein). Studies of globular clusters in the Galaxy indicate that most clusters contain substantial numbers of CN-strong stars and in most cases an enhancement of elements relative to Fe (or perhaps more correctly stated, an underabundance of Fe relative to elements)(Worthey, 1998). Thus, the integrated spectra of most globular clusters show both enhanced CN and element features. In this regard, the fact that the CN molecular band at 4216 Å, that is prominent in cool, low gravity stars, is very strong in the integrated spectra of old stellar populations presents a more significant problem than the contribution from Fe lines. The CN 4216 Å molecular band consists of a spectral feature that covers more than 100 Å blueward of the bandhead at 4216 Å. The band is indicated by the wedge in the middle panel of Fig. 1. The most obvious difficulty there is the extension of the band right up through the redward wing of H, thus making it unavoidable that the redward pseudocontinuum sideband for any H index will contain a contribution from CN. This situation is further illustrated in Fig 2, where we plot the spectrum of the old metal-rich elliptical galaxy NGC 821, and compare it to the spectrum of a metal-rich globular cluster in M31, which we will later show has exceedingly strong CN. The spectra of a G dwarf and a K giant are also plotted as a reference. A striking aspect of the galaxy and M31 globular cluster spectra is that while there is a prominent pseudocontinuum peak blueward of H, no such peak is seen to the red of H (as was pointed out by Dressler et al. 2004). The fact that the pseudocontinuum redward of H is also supressed in the K giant spectrum, which has a prominent CN 4216 band, while there is a well-developed red pseudocontinuum peak in the G dwarf, which has little contribution from CN, certainly suggests that the the depression of the redward pseudocontinuum peak in the galaxy spectrum is primarily the result of the CN band. We clarify this further in § 5.4.
As mentioned above, CN-contamination of the pseudocontinuum redward of H does not make the definition of a useful H index necessarily impossible, since the effect of CN is in principle accounted for in the population synthesis models. However, the fact that elliptical galaxies are frequently found to exhibit non-solar abundance ratios makes accurate modeling quite problematic. In fact, creating population synthesis models that include the accurate representation of non-solar C/Fe and N/Fe ratios proves a difficult task. To supplement stellar libraries with stars of enhanced CN molecular lines, it is necessary to use stellar atmosphere models which require enormous complexity to include molecular lines. Until such models are widely available, it is important to be aware of the complicating effect of CN lines on H measurements, as we have previously shown in the case of the Ca4227 line (Prochaska et al., 2005), which has CN contamination in the blue pseudocontinuum bandpass. Indeed, the effect of CN on H indices is the main concern of this paper.
Finally, the top panel in Fig. 1 shows the spectrum of an A star that is characteristic of light which dominates the flux in young (1 Gyr old) stellar populations. For these populations, the effect of metal line contamination is much less severe than in the older populations we are concerned with in this study. Thus for the remainder of this study we primarily concern ourselves with measuring and modeling H in old stellar populations.
3.2 H Index Definitions
The chosen width for the index passband depends on several considerations. As mentioned in the previous section, it is important to have a sufficiently narrow index passband to isolate the feature of interest. For example, a narrow index definition can minimize the effect of the metallicity dependence caused by Fe line contamination. However, narrow indices are more sensitive to velocity broadening effects in which the flux is redistributed from the core into the wings. Additionally, as can be seen in the top panel of Fig. 1, hot (A type) stars have extensive pressure-broadened wings. A wide index passband is thus important for measuring the entire H feature in spectra of young galaxies in which upper main sequence stars dominate the integrated light. On the other hand, the bottom two spectra of Figs. 1 and 2 are more characteristic of light from older populations. Consequently, WO97 defined two Lick-style indices for H. H uses wide passbands to include the extended wings of A stars appropriate for young stellar populations. The narrower passbands of H are designed to measure galaxies whose integrated light is dominated by later-type stars in older populations. For convenience, these definitions are given in Table 1.
To estimate the impact of CN molecular lines on H index measurements, we modify the WO97 H and H indices, defining 2 variations for each one. In the first variation, we define modified H and H indices that only use the blue continuum bandpass for measuring the continuum flux. We refer to these indices as H and H ( for blue). For comparison, we also define 2 indices that use only the red continuum passband for the continuum flux (H and H). This approach has been utilized previously for defining variations on the Lick Ca4227 index in Prochaska et al. (2005). Naturally, we also measure the original H and H definitions. The index definitions that only use one passband to define the continuum flux in effect assume a flat continuum in the region of H. Hence the measurement is essentially a mean flux ratio between the line and continuum bandpasses but defined in terms of an equivalent width. The point of this approach is to have index definitions that both avoid and include the region of CN molecular lines redward of H. We have defined in a similar manner variations of the H index as a test of our method (see §5.2), with Hb using only the blue continuum bandpass of H, and Hr using only the red continuum bandpass.
To find an index definition that best measures the H feature and with the benefit of higher resolution spectra than available for WO97, we have defined a set of new H indices of varying bandpass widths and placements. The new indices are defined with the same set of variations as for the WO97 H and H indices above: using blue only, red only, and both continuum bandpasses to define the continuum level. The new index definitions with the most extreme passband widths (H, HN, and H for the narrowest bandpasses and H, HW, and H for the widest), as well as the H and WO97 H and H bandpasses, are listed in Table 1. These are also shown in Fig. 3 (top panel shows WO97 index definitions, bottom panel shows new index definitions), where index bandpasses (solid lines indicate narrow passbands, dotted lines indicate wide passbands) are overplot on the spectrum of an early-type galaxy. These indices are also included in Table 1.
4 Spectral Index Measurements and Errors
All indices used in this study are measured using a modified version of the LECTOR program made publicly available by Alexander Vazdekis333http://www.iac.es/galeria/vazdekis/models.html. The measured indices for each galaxy in our sample, M67, 47 Tuc and the seven M31 globular clusters, along with the 1 uncertainties in the indices, are given in Table 2.
The spectra used in this study were taken at a variety of resolutions. The lowest resolution spectra are the MMT/Hectospec multi-fiber spectra of star clusters in M31, taken at a resolution of 4.5 Å FWHM. On the other hand, the CRC03 early-type galaxy spectra, although taken at 3.1 Å FWHM resolution, have all been smoothed to a common velocity broadening of =230 km s-1 , which at the 4101 Å wavelength of H corresponds to a resolution of 8.0 Å FWHM. Whenever spectral indices were derived from the data, all galaxy and cluster data were first smoothed to a common spectral resolution as specified by the Lick IDS resolution specific for each index (Worthey & Ottaviani, 1997).
4.1 Lick Indices
In this paper we use several key spectral line indices (H, Fe4383, and Mg b) that are defined in the Lick system by Worthey et al. (1994) and in WO97 (H and H) in addition to the newly defined indices for H and H. It is important to note that the Lick style indices used here are not entirely on the standard Lick system. The true Lick system originated with the IDS detector, in which the spectral resolution varies with wavelength (as described in WO97) and the spectra are on the instrumental response of the IDS. The data used in this study are flux calibrated and originally acquired at a variety of spectral resolutions. To compare the data and models, it is necessary to smooth them to a common resolution. As noted in the previous section, we have performed smoothing on the data specific to each spectral feature being measured in order to place the data closer to the Lick system. For example, before measuring Fe4383, all data and models were gaussian smoothed to a resolution of 9.3 Å FWHM, the Lick resolution at 4383 Å. By working at the specified Lick resolution for each feature, we bring our data substantially closer to the original Lick system. However, we do not adjust our flux-calibrated spectra and models to the Lick/IDS spectral response.
4.2 Emission Line Fill-In
Balmer emission, due to HII regions (as well as diffuse HII in the galaxy), active galactic nuclei, and/or planetary nebulae, fill in the underlying Balmer absorption lines, causing spuriously older age estimates from the measured spectra (Trager et al., 2000; Dressler et al., 2004). The H index measurements in this study have not been corrected for emission. However, our present study is aimed at looking for a difference in ages for different H line index definitions, and the presence of emission in H is unlikely to influence differential ages. Regardless, we expect only a small amount of emission line fill in at H, since the CRC03 sample was itself restricted to galaxies which have only weak emission, and since H is less afflicted than lower order Balmer lines due to the steep Balmer decrement in emission (Osterbrock, 1989; Worthey & Ottaviani, 1997). To ensure that emission plays no role in our results, we have removed from the original CRC03 sample of 175 galaxies those with H emission correction (from CRC03) in excess of 0.3 Å in equivalent width. The determination of H emission is described in CRC03.
4.3 Continuum Slope Effect
Our study examines differences in derived ages among various index definitions, some of which are formulated using only one continuum bandpass. While Vazdekis (1999) showed that B-V colors measured in the Jones spectra did not exactly match the known B-V colors of the Jones stars, he suggests that the flux calibration quality is acceptable for spectral regions smaller than 3̃00 Å. Therefore, this effect has little influence on the present study as the pseudocontinuum and index passbands are relatively close to one another. Nevertheless, it is important to consider that blue continuum indices may give different derived ages than those using the red continuum indices if there are systematic differences in continuum slopes between the data and models. A difference in slope could arise from flux calibration errors and reddening effects, as well as deficiencies in the models.
To estimate and correct for the effect of differing continuum slopes on H measurements, we have adjusted the slope of the observed spectra to have the same continuum slope as that of the appropriate model. Observed spectra were matched to model spectra with similar H and Fe4383 measurements. The ratio of each observed spectrum and corresponding model was fit to a line using the curfit routine in IRAF, then divided into the original observed spectrum to yield an observed spectrum with the same continuum slope as the model spectrum. Because ages are derived by overplotting data onto model grid lines, any difference in H measurements of various definitions caused by the continuum slope will match the difference of the models. As a result, there should be no systematic effects on derived ages due to slope effects. All indices in this study were measured on observed spectra with adjusted slope. We further explore the possibility of continuum slope errors on the spectral indices in §5.3.
4.4 Errors in Spectral Indices
Uncertainties in the spectral indices used here are in principle already determined by CRC03 for the early-type galaxy sample. However, since we have recalculated the Lick Fe4383 and WO97 H and H indices after smoothing to the Lick resolution specified in WO97 and have calculated new versions of H and H indices, we determined the new 1 uncertainties by calculating the r.m.s scatters in the Lick indices in multiple exposures for a subsample of the CRC03 galaxies. From this subsample we determined an overall correction factor from the published CRC03 index uncertainties to those in our index definitions carried out at the Lick resolution. This approach was carried out for each index definition used in our study. In the case of 47 Tuc, M67, and the M31 globular clusters, where multiple exposures were not available, we calculated the uncertainties in the Lick indices from the signal to noise ratio per pixel integrated over the specified bandpass (or used, in the case of M67, uncertainties derived in Schiavon et al. (2004a)) and applied the above correction factor to other index definitions.
5 Results
5.1 Ages Derived from Worthey & Ottaviani H Indices
The primary goal of this paper is to evaluate the reliability of using H for determining galaxy ages. In principle, if H based ages are reliable, then the derived ages should not be highly sensitive to the exact definition of the H line index. On the other hand, if the derived ages change substantially depending upon the exact bandpasses used in the index, then it is likely that one or more bandpasses contain a feature that is not being properly modelled, perhaps due to the presence of non-solar abundance ratios in the galaxy spectra. As mentioned before, we are especially concerned about the effect of the CN 4216 molecular band on the red continuum side of H. Thus we have defined modifications of the WO97 H and H indices which utilize the continuum on only the blue or the red side of H.
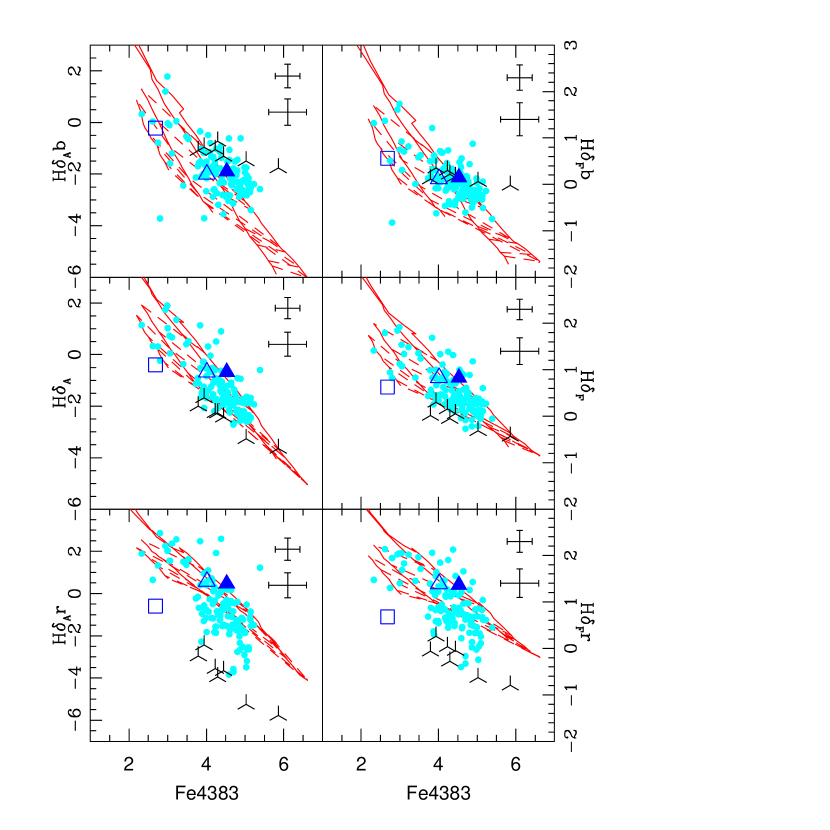
A common procedure to break the age-metallicity degeneracy in integrated SED’s of old stellar populations is to plot a primarily age sensitive index against a primarily metallicity sensitive index. Model grid lines are then overlaid to determine the age and metallicity of the population. We follow this procedure with the WO97 H and H indices, which are plotted versus the metallicity sensitive Fe4383 index in Fig. 4. The original WO97 indices, which utilize both blue and red pseudocontinuum bandpasses, are plotted in the middle panels, with H on the left and H on the right. The CRC03 early-type galaxy data, as well as additional points for the M31 globular clusters, the integrated spectrum of M67, and that of 47 Tuc and of M32, are all plotted along with the model grid lines. The constant age and constant metallicity grid lines do show a useful degree of separation. However, they are far from orthogonal, which is presumably due mostly to the large amount of metal-line contamination in both the H central and continuum bandpasses. In the top and bottom panels of Fig. 4 we plot the newly defined H and H (top left and right panels) and H and H (bottom left and right panels) indices versus Fe4383. To recap, the top panel indices use only the blue continuum bandpass, while the bottom panels use only the red continuum bandpass. If [C/Fe] and [N/Fe] abundance ratios in the CRC03 galaxies are basically solar, then we would expect the CN bands to be properly accounted for in the population synthesis models, in which case H derived ages should be the same in all panels. Instead, there is a large offset in derived ages, with the H and H ages being systematically older than those from the standard WO97 H and H ages. In fact, for the H and H indices, most of the galaxies lie completely outside of any reasonable age expectation for these galaxies. Note that the metal-rich M31 globular clusters show the effect at an even more extreme level than for the CRC03 galaxies. The Galactic globular cluster 47 Tuc is also significantly impacted. On the other hand, the open cluster M67 shows no age discrepancy between the two indices. As well, the low-mass elliptical galaxy M32 shows only a modest discrepancy in age between the two indices. A similar figure substituting Fe5270 for Fe4383 gives an equivalent result.
A natural explanation for the age discrepancies that are found between the two H index measurements is that the red pseudocontinuum bandpass is affected by the strength of the CN molecular feature and that [CN/Fe] is enhanced in the bulk of the CRC03 galaxies and in the M31 globular clusters, such that the Vazdekis models, based on solar abundance ratios, do not adequately model the depression in the red pseudocontinuum bandpass that appears in the observed spectra. This conjecture is in accord with the finding that more reasonable ages are derived when the blue pseudocontinuum bandpass is included (with the WO97 form of the indices). There is compelling evidence that carbon and nitrogen are, in fact, overabundant in early-type galaxies (Trager et al., 1998; Worthey, 1998; Schiavon, 2006) and in M31 globular clusters (Burstein et al., 1984; Tripicco, 1989; Beasley et al., 2004), although Sanchez-Blazquez et al. (2003) have found that those effects are less pronounced in cluster ellipticals. In fact, dramatic overabundances in N have been found in M31 globular clusters, while C appears to be normal (Ponder et al., 1998; Burstein et al., 2004). Further support for CN as the culprit in the age discrepancies between indices lies in the fact that the open cluster M67 is known from spectroscopy of its giants to have essentially normal C and N abundances, while integrated light studies of M32 indicate only modest departures from mean solar abundances (Worthey, 2004; Schiavon et al., 2004a; Rose et al., 2005), with [N/Fe] essentially solar in M32 (Boulade et al., 1988).
If we now assume that all the damage caused by CN overabundances is contributed in the red pseudocontinuum bandpass of the WO97 H indices, it is then to be expected that both younger and more reliable ages would be obtained if only the blue pseudocontinuum bandpass is used. However, while inspection of the top panels in Fig. 4 does reveal that younger ages are obtained from the blue-bandpass-only definition for H, the ages are unreasonably young, this time falling outside the model lines to the unreasonably young side. Interestingly, the most reliable ages appear to be obtained when both blue and red pseudocontinuum bandpasses are used, as in the original WO97 definitions.
5.2 Ages Derived From H Indices
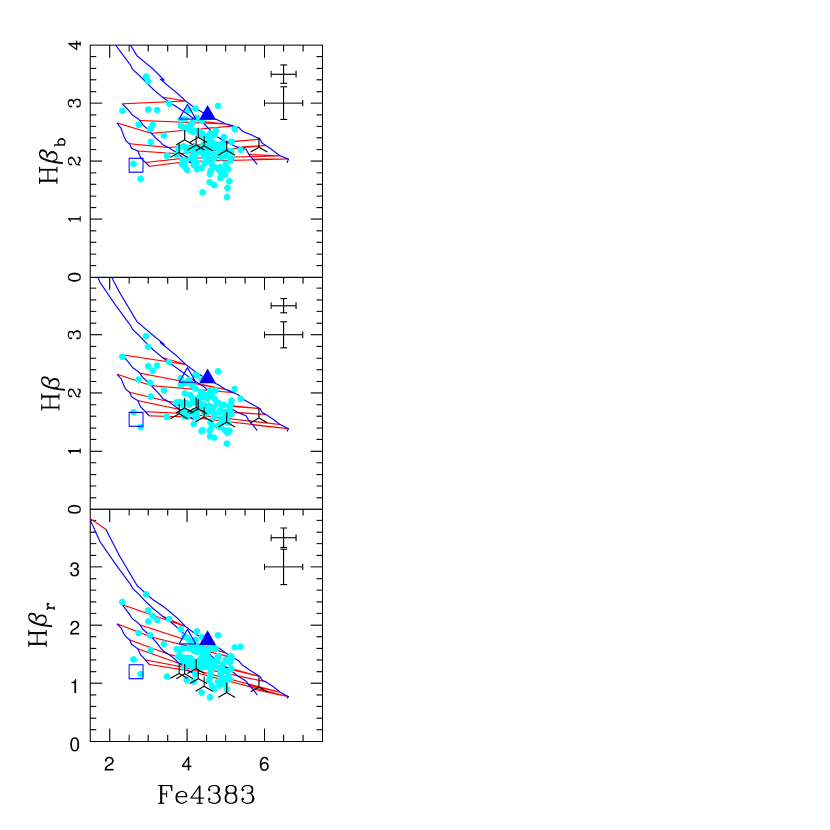
Before further investigating why both blue-only and red-only continuum bandpass definitions of H produce such unreasonable age results, we first demonstrate that the same effect is not apparent in the Lick H index. Since neither the pseudocontinuum nor the central bandpasses of the H index are contaminated by any very strong lines, the expectation is that ages derived from H should be independent of whether a blue only or red only pseudocontinuum bandpass, or both bandpasses, are used in the index definition. As seen in Fig. 5, indeed H-extracted ages are largely independent of which pseudocontinuum bandpass is used. There is some tendency for the M31 globular clusters to exhibit systematically older ages with the red bandpass only (bottom panel of Fig. 5), and younger with the blue bandpass only (top panel), but the effect is far smaller than with H. Otherwise, H ages appear robust, regardless of pseudocontinuum bandpass selection. Thus the large age variations seen in the different H indices is specific to H itself, and not simply an artifact of our single continuum bandpass approach.
5.3 Continuum Slope Revisited
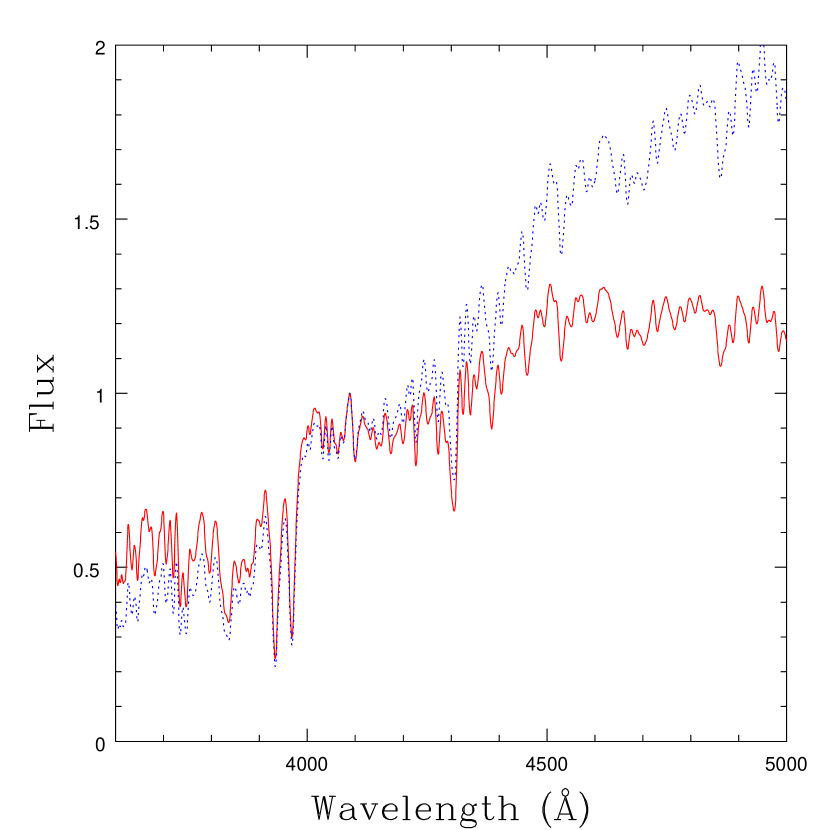
Although we have previously adjusted the continuum slope of our data, as discussed in § 4.3, to match that of the model spectra which they are compared to, it is important to be confident that the age discrepancies between different continuum bandpass definitions seen in Fig. 4 are not caused by an effect that an error in continuum slope could have on our single continuum bandpass approach. Therefore, we perform a final test by adjusting the slope of our original early-type galaxy data in increments until the single-continuum-bandpass index measurements (H, H, H and H) give a consistent age with that of the original WO97 index measurements. The original WO97 indices and their variations are measured on the slope adjusted data at each increment and then plotted onto a figure similar to Fig. 4. From this, we determine that the version of the data with a 40% increase in slope over the 4400-5500 Å baseline, i.e., a 0.37 mag change in B-V color, gives a consistent age for all indices, which in effect, represents the degree of continuum slope error necessary to produce the result we find in Fig. 4 on slope error alone. We show in Fig. 6 an early type galaxy spectrum adjusted to have a 0.37 mag increase in B-V color overlaid on the original spectrum, both normalized to unity just blueward of H. It is clear that such a large shift in continuum slope due to spectrophotometric errors is unlikely. Furthermore, we removed that possibility when we flattened our galaxy spectrum continua to match those of the model spectra before performing our analysis. It is only when the galaxy continuum is 40% different from the model continuum that the problem arises.
5.4 Synthesis of the CN 4216 Molecular Band Using Spectrum Synthesis From Model Atmospheres
We now return to the puzzling result that the most reasonable H ages result from using both pseudocontinuum bandpasses, when in fact our expectation is that only the red bandpass is profoundly affected by CN abundance anomalies. The fact that blue bandpass only H definitions yield ages that are substantially too young can result from CN contamination of the central H bandpass. Unfortunately, to test this hypothesis directly using observed stellar spectra from the Solar Neighborhood is not possible, since the solar neighborhood is populated by stars with normal CN abundance ratios. As a result, we have resorted to investigating the effects of CN on H indices by computing synthetic spectra in the wavelength region of H, based on model atmospheres and a comprehensive database of atomic and molecular data. We have described the synthetic spectra in § 2.3.
Computing reliable synthetic spectra from model atmospheres of cool stars is a very daunting task, as accurate determinations of thousands of oscillator strengths are required to determine the strengths of individual lines. . This difficulty is further exacerbated in the blue, where atomic lines are significantly crowded. An additional difficulty associated with computing synthetic spectra of early-type galaxies is knowing the correct abundances of carbon and nitrigen. For early-type galaxies, the individual carbon and nitrogen abundances generally are poorly constrained. Consequently, the correct mixture of carbon and nitrogen to input to synthesis models for early-type galaxies is not known. However, in this study we are concerned with differential effects, namely, the influence of changes in CN-band strengths on the H feature, which is possible to investigate using spectrum synthesis from model atmospheres.
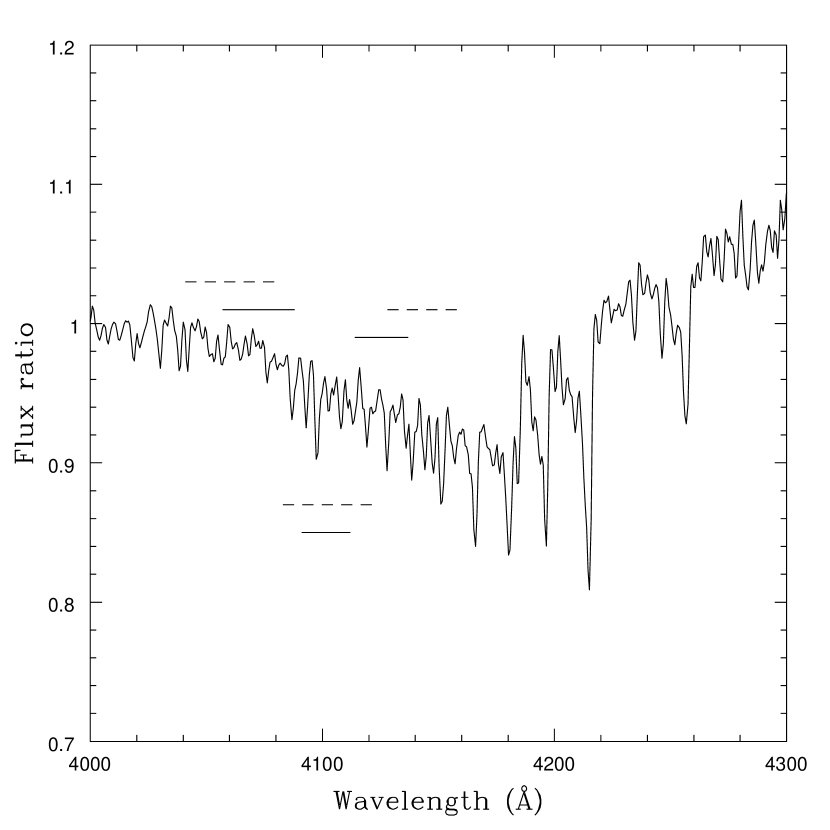
To briefly recap § 2.3, synthetic spectra were calculated using two different abundance patterns, one with solar chemical composition (scaled to [Fe/H] = -0.5 dex) and one with the abundance of CN strong/CH weak stars in metal-rich Galactic globular clusters ([C/Fe] = -0.2 and [N/Fe] = 0.8). Note that these abundance ratios were originally chosen to mimic the abundances of 47 Tuc, as determined by Cannon et al. (1998). However, the larger N enhancement ratio than C depletion factor will lead to CN enhancement, which is the desired effect. In Fig. 7 we plot the ratio of the two synthetic spectra such that the resultant spectrum essentially isolates the effect of CN abundance enhancement on the spectrum of a giant branch star.
The most notable effect in Fig. 7 is indeed a pronounced depression in the continuum just blueward of the 4216 Å CN bandhead that was previously illustrated by the wedge in Figs.1 and 2. The depression is highly structured, due to individual rotational transitions, as well as showing an overall trend of weakening towards the blue. While the overall continuum depression has clearly decreased at the wavelength of H, when compared to near the molecular bandhead, there is still a significant effect at H itself. More importantly, there is a noticeable line just blueward of H, which falls within the WO97 H and H central bandpasses. To better see the effect, the WO97 central bandpass and blue and red pseudocontinuum bandpasses have been marked on Fig. 7 for both H and H indices. In fact, the central H bandpass contains two significant CN lines in the case of H, and several lines in the case of H. This fact represents a key setback for finding a clean definition of H, since a substantial CN molecular line falls within 5 Å of H itself. With the typical velocity broadening of early-type galaxies, the CN line will blend with H, making the contamination unavoidable.
To summarize what is evident in Fig. 7, CN most dramatically affects the red pseudontinuum bandpasses of the WO97 H indices, partially contaminates the central bandpasses, and has virtually no effect on the blue pseudocontinuum bandpasses. Accordingly, the strange behavior of H derived ages in Fig 4 can be qualitatively explained by non-solar CN abundance ratios in the CRC03 early-type galaxies and in the M31 globular clusters. Specifically, one would expect artificially old ages to be derived from the red continuum bandpass only H definitions, since the red bandpass is more heavily afflicted with CN than the central bandpass. On the other hand, H ages derived from the blue continuum bandpass only should produce spuriously young ages, since the central bandpass itself does suffer significant CN contamination, while the blue bandpass is relatively clean. Interestingly, the original WO97 index definitions will produce the most reasonable ages, since the low CN contamination of the blue pseudocontinuum bandpass partially offsets the high contamination of the red bandpass. The resultant average roughly matches the CN depression in the central bandpass, yielding the most reliable ages. Nevertheless, the exact degree of cancellation is uncertain and may vary for different population ages, thus causing age determinations from H to be uncertain.
5.5 Comparison Between Observed and Model Galaxy Spectra
In the above section we saw that CN molecular lines prominent in giant stars indeed fall into bandpasses of H indices, which could in principle compromise H indices if the CN is not correctly modeled. But does the integrated light of early-type galaxies actually have strong enough CN 4216 bands to affect flux levels in the red and central bandpasses? To evaluate this, we overplot a Vazdekis (1999) model spectrum (as used in Fig. 4 and 5) against an early-type galaxy spectrum of the same age and metallicity (determined from Fe4383 and H index measurements and confirmed by visual inspection). As described in § 4.3, the galaxy spectrum has been adjusted to have the same general slope as the model spectrum. The top left panel of Fig. 8 shows the spectrum of an early-type galaxy, NGC 821 in red, and a 10 Gyr, solar metallicity model spectrum overplotted in blue in the region of H. The model clearly diverges from the data redward of H where the red continuum bandpass lies. In the top right panel, we plot the same two spectra over a larger wavelength region. It is clear that the model and galaxy spectra coincide along all other regions of the spectrum, indicating that the cause of the divergence redward of H is likely from CN band contamination.
Additionally, we show spectra of M67 and the M31 globular cluster in the middle and bottom panels of Fig. 8, respectively, overplotted with corresponding models (again chosen from matching Fe4383 and H). In Fig. 4, we measured consistent ages of M67 regardless of the continuum bandpass used. This result was anticipated from the known solar abundance ratios of M67, and so we would also expect the corresponding model spectrum and M67 spectrum to be nearly indistinguishable. This is clearly the case in the middle panels of Fig. 8. On the other hand, the M31 globular cluster diverges from the corresponding model redward of H. The divergence in the bottom panels is even more extreme than in the top panels, presumably from the large N abundances in M31 globular clusters found by Ponder et al. (1998) and Burstein et al. (2004).
5.6 Additional Index Definitions
To eliminate the possibility that the above results are specific to the widths and placements of the WO97 HA and HF definitions, we have defined new indices of varying bandpass widths and placements, as mentioned in § 3.2. Although the degree of change in derived age differs among these new indices, the overall trend remains consistent regardless of the chosen bandpass widths and placements: we derive younger ages when using H indices that use the blue shoulder to define the continuum and older ages when using the red shoulder. The fact that we were unable to find a satisfactory H index definition is not suprising, since in § 5.4 we found that CN lines contaminate H itself, as well as the red continuum side.
5.7 H Revisited
We previously demonstrated that while H ages vary substantially, depending on which of the red and/or blue continuum passbands are used, in the case of H the derived ages are far more self-consistent. As noted in §5.3, however, there is a slight tendency for ages derived from the integrated spectra of the M31 globular clusters to be older when using the red continuum bandpass only and younger when only the blue continuum is used. While the effect is subtle, it may signal a small discrepancy between the models and the M31 metal-rich globular clusters. As pointed out in Schiavon et al. (2004a), the Lick H index and its continuum sidebands cover a spectral region in which a TiO band found in M giants is rapidly changing in depth. Due to the great strength of the TiO feature in upper RGB/AGB stars, we suggest that any inaccuracy in how these advanced stages of stellar evolution are covered in the model isochrones could thus have an impact on the predicted H index strength. We also note that in Schiavon et al. (2002) it was indeed found that the model isochrones do appear to underpredict the number of RGB stars above the HB level, by a factor of 2.
6 Discussion
To summarize, we have found that ages derived from the integrated spectra of early-type galaxies and M31 metal-rich clusters based on measurements of the H line are highly dependent on how the continuum is defined from blue and/or red bandpasses. In contrast, ages derived from the H feature are robust, regardless of the chosen continuum bandpasses. We attribute the behavior of H-derived ages to the impact of CN molecular lines on the red continuum bandpass and on H itself. Specifically, the synthetic spectrum of a CN-enhanced red giant star, when compared to that of a CN-normal giant, shows that CN lines are prominent redward of H, are present as well in even narrowly defined bandpasses centered on H itself, and are substantially weaker in the blue pseudocontinuum of the HF and HA indices. While CN absorption is naturally included in population synthesis models, early-type galaxies and M31 globular clusters are known to exhibit enhanced CN features resulting from non-solar abundance ratios. It is the non-solar behavior of CN in early-type galaxies that results in the problematic modelling of H. On the other hand, we find that H ages are well behaved in both the integrated spectrum of the open cluster M67 and in the low-mass elliptical galaxy M32, both of which are known to have primarily solar abundance element ratios. Thus a consistent picture has emerged in which H ages must be carefully evaluated when old metal-rich stellar systems with non-solar abundance ratios are encountered, i.e., massive early-type galaxies at low redshift.
Unfortunately, there is no simple way to avoid the CN problem, since a significant CN molecular line falls within a few Å of the line center of H. For a typical galaxy velocity dispersion of 200 km s-1 , H and the CN line are not resolved. Thus the only solution is to eventually model non-solar abundance ratios with sufficient accuracy that the population synthesis models fully account for the effects of non-solar CN. The difficulties associated with this task were discussed in §5.4. Such an effort is beyond the scope of this paper. Once such models exist, and unless non-solar CN is found to be highly correlated with easily measured elements such as Mg, it will be necessary to independently measure C and N abundances, which require observations of CH at 4300 Å and the NH molecular feature at 3360 Å, a major undertaking. The compensating effect of CN lying in both the index itself and the nearby continuum is similar in form to the blending of Fe lines with H, so that the question arises of whether a method similar to Vazdekis & Arimoto (1999)’s solution with H can be used in the case of H. However, while this is an interesting approach for H, defining an index definition for H of the same style is severely compromised by the inability to accurately measure both C and N abundances in early-type galaxies.
While CN contamination of H derived ages has been shown to be a major issue for old stellar populations, it will have little effect on studies of young populations. In young populations the main sequence turnoff is both bright and blue, which means that the integrated main sequence spectrum is dominated by hot early-type stars that have strong H features and little or no CN absorption. Moreover, the main sequence component in young populations dominates over the contribution from late-type CN-strong RGB stars. Hence in young populations the effect of CN on H age determinations is not an issue. For example, non-solar abundance ratios should not influence H ages in studies of k+a galaxies (a common use of the H index) due to their relatively young luminosity-weighted ages. Without detailed modelling of non-solar abundance ratio populations, it is impossible yet to assess at what age the population is young enough to avoid the CN problem. However, certainly for populations 2 Gyr and younger, there is little to worry about. In the case of M32, with a luminosity-weighted mean age of 3-4 Gyr, and of M67, with a similar age, we also do not see a problem with H ages. However, both of these systems do not exhibit substantial non-solar element abundance ratios, thus they do not supply a critical test.
The difficulty in obtaining reliable ages from H has two major implications. First, much interest in H is associated with using it as the primary age indicator for higher redshift studies, at which H has been redshifted into difficult regions of the night sky emission spectrum. However, unless the galaxy being studied is at sufficient lookback time that the luminosity-weighted age is quite small, then CN issues will clearly hamper the use of H as an age indicator. Naturally, the emphasis can shift to H-derived ages, but H can be followed to significantly higher redshift. Second, while obtaining a luminosity-weighted mean age for a galaxy is certainly a valuable first step, in the case when the mean age is found to be relatively young, the next step is to determine whether the integrated spectrum is the composite of a young and an old age population, with uniquely constrained ages. To do so requires the use of at least two age-sensitive indices, sufficiently separated in wavelength that the degeneracy between a single mean age population and two (or more) populations with distinct ages can be overcome. The effect of CN on H ages clearly needs to be taken into consideration if H is to be used for such a subtle distinction.
Finally, the recognition that the H line itself is affected by CN may well clarify a puzzle regarding the integrated spectra of metal-rich Galactic globular clusters reported by Rose (1985) and Rose & Tripicco (1986). Using line ratio indices that form the ratio in residual central intensities of neighboring absorption lines, they found that the integrated spectra of metal-rich Galactic globular clusters form a two-parameter family in their line ratio index system. Specifically, clusters with the same value of the H/Fe I4045 index (which compares the relative central intensities of H and the Fe I4045 line) show a spread in indices that measure CN and Sr II4077. Their result is that the strength of Sr anti-correlates with that of CN. This is particularly puzzling since the ionized strontium line is gravity-sensitive in the same way as CN. The result can be understood if the H/Fe I index is affected by the same CN overabundance that produces overly strong CN. The net effect is to displace the cluster in the diagram of SrII/FeI versus H/FeI, making the cluster appear to be Sr-weak when in fact it is actually H-strong due to the contamination from CN in the H line center. An implication of this finding is that using Sr II as a gravity indicator in the integrated light of early-type galaxies is risky in the case of those galaxies with non-solar abundances in CN. Note that this concern does not apply to the case of M32.
In summary, we warn that when measuring H in composite spectra of old metal-rich stellar systems with non-solar abundance ratios, an uncertainty in the derived ages will exist as a result of unaccounted for CN contamination. Thus for low redshift metal-rich galaxies, H and H might be preferred as age diagnostics until future work can produce population synthesis models which fully account for non-solar abundancees of CN. CN abundance issues will not affect H ages for galaxies dominated by young populations, or for metal-poor systems in which the CN band at 4216 Å is weak.
This study was partially funded by NSF grant AST-0406443 to the University of North Carolina. H.M. acknowledges support from grant HST-GO-104007.01-A.
References
- Beasley et al. (2004) Beasley, M. A., Brodie, J. P., Strader, J., Forbes, D. A., Proctor, R. N., Barmby, P., & Huchra, J. P. 2004, AJ, 128, 1623
- Boulade et al. (1988) Boulade, O., Rose, J. A., & Vigroux, L. 1988, AJ, 96, 1319
- Briley et al. (1994) Briley, M. M, Hesser, J. E., Bell, R. A., Bolte, M., & Smith, G. H. 1994 AJ, 108, 5
- Bruzual & Charlot (2003) Bruzual, A. G. & Charlot, S. 2003, MNRAS
- Burstein et al. (1984) Burstein, D., Faber, S. M., Gaskell, C. M., & Krumm, N. 1984, ApJ, 287, 586
- Burstein et al. (2004) Burstein, D. et al. 2004, ApJ, 614, 158
- Caldwell, Rose, & Concannon (2003) Caldwell, N., Rose, J. A., & Concannon, K. D. 2003, AJ, 125, 2891 (CRC03)
- Cannon et al. (1998) Cannon, R. D., Croke, B. F. W., Bell, R. A., Hesser, J. E., Stathakis, R. A. 1998, MNRAS, 298, 601
- Davies et al. (1993) Davies, R. L., Sadler, E. M., & Peletier, R. F. 1993, MNRAS, 262, 650
- Dressler et al. (2004) Dressler, A., Oemler, A. Jr., Poggianti, B. M., Smail, I., Trager, S., Shectman, S. A., Couch, W. J., & Ellis, R. S. 2004, ApJ, 617, 867
- Faber et al. (1985) Faber, S. M., Friel, E. D., Burstein, D., & Gaskell, C. M. 1985, ApJ, 57, 711
- Fabricant et al. (1998) Fabricant, D., Cheiments, P., Caldwell, N., & Geary, J. 1998, PASP, 110, 79
- Fabricant et al. (2005) Fabricant, D., et al. 2005, PASP, 117, 1411
- Gorgas et al. (1993) Gorgas, J., Faber, S. M., Burstein, D., Gonzalez, J. J., Courteau, S., & Prosser, C. 1993, ApJS, 86, 153
- Jacoby et al. (1984) Jacoby, G. H., Hunter, D. A., & Christian, C. A. 1984, ApJS, 56, 257
- Jones (1998) Jones, L. A. 1998, Ph.D. thesis, Univ. North Carolina, Chapel Hill
- Jones & Worthey (1995) Jones, L. A. & Worthey, G.1995, ApJ, 446, 31
- Kauffmann et al. (2003) Kauffmann, G., et al. 2003 MNRAS, 341, 33
- Korn et al. (2005) Korn, A. J., Maraston, C., & Thomas, D. 2005, A&A, 438, 685
- Kuntschner (2000) Kuntschner, H. 2000, MNRAS, 315, 184
- Leonardi & Rose (2003) Leonardi, A. J. & Rose, J. A. 2003, AJ, 126, 1811
- Osterbrock (1989) Osterbrock, D. E. 1989, Astrophysics of Gaseous Nebulae and Active Galactic Nuclei (Mill Valley: University Science Books)
- Pickels (1998) Pickels, A. J. 1998, PASP, 110, 863
- Ponder et al. (1998) Ponder, J., et al. 1998, AJ, 116, 2297
- Prochaska et al. (2005) Prochaska, L. C., Rose, J. A., & Schiavon, R. P. 2005, AJ, 130, 2666
- Rose (1985) Rose, J. A. 1985, AJ, 90, 10
- Rose (1994) Rose, J. A. 1994, AJ, 107, 206
- Rose et al. (2005) Rose, J. A., Arimoto, N., Caldwell, N., Schiavon, R. P., Vazdekis, A., & Yamada, Y. 2005, AJ, 129, 712
- Sanchez-Blazquez et al. (2003) Sanchez-Blazquez, P., Gorgas, J., Cardiel, N., & Cenarro, J. 2003, ApJ, 590, L91
- Schiavon (2006) Schiavon, R. P. 2006, ApJS, submitted
- Schiavon et al. (2004a) Schiavon, R. P., Caldwell, N., & Rose, J. A. 2004, AJ, 127, 1513
- Schiavon et al. (2002) Schiavon, R. P., Faber, S. M., Castilho, B. V., & Rose, J. A. 2002, ApJ, 580, 850
- Schiavon et al. (2004b) Schiavon, R. P., Rose, J. A., Courteau, S., & MacArthur, L. A. 2004, ApJ, 608, 33
- Schiavon et al. (2005) Schiavon, R. P., Rose, J. A., Courteau, S., & MacArthur, L. A. 2005, ApJS, 160, 163
- Thomas et al. (2004) Thomas, D., Maraston, C., & Korn, A. 2004, MNRAS, 351, 19
- Trager et al. (1998) Trager, S. C., Worthey, G., Faber, S. M., Burstein, D., & Gonzalez, J. J. 1998, ApJS, 116, 1
- Trager et al. (2000) Trager, S. C., Faber, S. M., Worthey, G., & Gonzalez, J. J. 2000, AJ, 119, 1645
- Tripicco (1989) Tripicco, M. J. 1989, AJ, 97, 735
- Tripicco & Bell (1995) Tripicco, M. J.,& Bell, R. A. 1995, AJ, 110, 6
- Vazdekis (1999) Vazdekis, A. 1999, ApJ, 513, 224
- Vazdekis & Arimoto (1999) Vazdekis, A. & Arimoto, N. 1999 ApJ, 525, 144
- Vazdekis et al. (2001) Vazdekis, A., Salaris, M., Arimoto, N., & Rose, J. A. 2001, ApJ, 549, 274
- Worthey et al. (1992) Worthey, G., Faber, S. M., & Gonzalez, J. J. 1992, ApJ, 398, 69
- Worthey et al. (1994) Worthey, G., Faber, S. M., Gonzalez, J., & Burstein, D. 1994, ApJS, 94, 687
- Worthey & Ottaviani (1997) Worthey, G. & Ottaviani, D. L. 1997, ApJS, 111, 377 (WO97)
- Worthey (1998) Worthey, G. 1998, PASP, 110, 888
- Worthey (2004) Worthey, G. 2004, AJ, 128, 2826
| Index | Central Passband | Pseudocontinua |
|---|---|---|
| H | 4041.600-4079.750 | 4083.500-4122.250, 4128.500-4161.000bbBandpass definitions are from Worthey & Ottaviani (1997). |
| H | 4041.600-4079.750 | 4083.500-4122.250bbBandpass definitions are from Worthey & Ottaviani (1997). |
| H | 4041.600-4079.750 | 4128.500-4161.000bbBandpass definitions are from Worthey & Ottaviani (1997). |
| H | 4057.250-4088.500 | 4091.000-4112.250, 4114.750-4137.250bbBandpass definitions are from Worthey & Ottaviani (1997). |
| H | 4057.250-4088.500 | 4091.000-4112.250bbBandpass definitions are from Worthey & Ottaviani (1997). |
| H | 4057.250-4088.500 | 4114.750-4137.250bbBandpass definitions are from Worthey & Ottaviani (1997). |
| H | 4827.875-4847.875 | 4847.875-4876.625, 4876.625-4891.625aaBandpass definitions are from Worthey et al. (1994). |
| H | 4827.875-4847.875 | 4847.875-4876.625aaBandpass definitions are from Worthey et al. (1994). |
| H | 4827.875-4847.875 | 4876.625-4891.625aaBandpass definitions are from Worthey et al. (1994). |
| Fe4383 | 4370.375-4221.625 | 4360.375-4371.625, 4444.125-4456.625aaBandpass definitions are from Worthey et al. (1994). |
| H | 4093-4106 | 4083-4091 |
| H | 4091-4113 | 4040-4088 |
| H | 4093-4106 | 4083-4091, 4120-4140 |
| H | 4091-4113 | 4040-4088, 4120-4165 |
| H | 4093-4106 | 4120-4140 |
| H | 4091-4113 | 4120-4165 |
| Galaxy ID | H | H | H | H | H | H | H | H | H | Fe4383 |
|---|---|---|---|---|---|---|---|---|---|---|
| 47Tuc | -0.22 | -0.40 | -0.59 | 0.56 | 0.63 | 0.68 | 1.93 | 1.55 | 1.20 | 2.68 |
| 1 | 0.02 | 0.02 | 0.03 | 0.02 | 0.01 | 0.02 | 0.02 | 0.01 | 0.02 | 0.29 |
| M67 | -2.01 | -0.68 | 0.57 | 0.12 | 0.83 | 1.39 | 2.81 | 2.27 | 1.76 | 4.01 |
| 1 | 0.15 | 0.14 | 0.17 | 0.10 | 0.08 | 0.09 | 0.11 | 0.09 | 0.12 | 0.19 |
| M31 Globular Clusters | ||||||||||
| 171-222 | -0.95 | -1.67 | -2.43 | 0.35 | 0.30 | 0.26 | 2.37 | 1.75 | 1.16 | 3.94 |
| 1 | 0.32 | 0.29 | 0.37 | 0.23 | 0.18 | 0.20 | 0.19 | 0.15 | 0.20 | 0.32 |
| 163-217 | -1.05 | -2.25 | -3.55 | 0.30 | 0.16 | 0.03 | 2.28 | 1.75 | 1.25 | 4.23 |
| 1 | 0.40 | 0.37 | 0.47 | 0.28 | 0.23 | 0.24 | 0.23 | 0.18 | 0.25 | 0.39 |
| 112-174 | -1.50 | -3.26 | -5.24 | 0.06 | -0.31 | -0.63 | 2.19 | 1.50 | 0.84 | 5.03 |
| 1 | 0.44 | 0.40 | 0.51 | 0.30 | 0.25 | 0.26 | 0.23 | 0.18 | 0.25 | 0.48 |
| 150-203 | -1.09 | -1.99 | -2.95 | 0.11 | 0.02 | -0.06 | 2.15 | 1.64 | 1.17 | 3.79 |
| 1 | 0.57 | 0.52 | 0.67 | 0.41 | 0.33 | 0.35 | 0.34 | 0.27 | 0.36 | 0.58 |
| 193-244 | -0.73 | -2.27 | -3.95 | 0.22 | -0.05 | -0.28 | 2.41 | 1.73 | 1.08 | 4.29 |
| 1 | 0.58 | 0.53 | 0.67 | 0.41 | 0.33 | 0.35 | 0.33 | 0.26 | 0.35 | 0.56 |
| 143-198 | -1.31 | -2.43 | -3.64 | 0.17 | 0.05 | -0.04 | 2.27 | 1.59 | 0.95 | 4.44 |
| 1 | 0.35 | 0.32 | 0.41 | 0.25 | 0.20 | 0.21 | 0.20 | 0.16 | 0.22 | 0.34 |
| 189-240 | -1.77 | -3.65 | -5.77 | -0.02 | -0.43 | -0.79 | 2.24 | 1.57 | 0.94 | 5.86 |
| 1 | 0.89 | 0.81 | 1.03 | 0.61 | 0.50 | 0.53 | 0.46 | 0.37 | 0.50 | 0.78 |
| CRC03 Early Type Galaxies | ||||||||||
| A00368p25 | -1.34 | -1.24 | -1.16 | 0.33 | 0.63 | 0.85 | 2.07 | 1.66 | 1.29 | 4.12 |
| 1 | 0.42 | 0.38 | 0.49 | 0.25 | 0.20 | 0.22 | 0.14 | 0.11 | 0.15 | 0.30 |
| A10025 | -2.33 | -1.91 | -1.48 | -0.08 | 0.44 | 0.85 | 1.96 | 1.65 | 1.36 | 4.45 |
| 1 | 0.22 | 0.20 | 0.25 | 0.13 | 0.11 | 0.11 | 0.07 | 0.06 | 0.08 | 0.15 |
| A15572p48 | -1.05 | -0.28 | 0.44 | 0.51 | 0.86 | 1.14 | 2.26 | 1.83 | 1.44 | 3.91 |
| 1 | 0.42 | 0.38 | 0.49 | 0.25 | 0.20 | 0.22 | 0.14 | 0.12 | 0.16 | 0.30 |