Spatially resolved spectroscopy of early-type galaxies over a range in mass
Abstract
Long-slit spectra have been obtained with the Keck telescope for a sample of 11 early-type galaxies covering a wide range in luminosity and hence mass. Rotation velocity and velocity dispersions, together with 19 Lick line-strength gradients have been measured, to, on average, two effective radii. Stellar population models taking into account the effect of the non-solar chemical composition have been used to derive ages, metallicities and /Fe abundances along the radius. We find that line-strength gradients are due, mainly, to variations of the total metallicity with the radius. One galaxy out of 11 shows very strong age gradients, with a young central component, while the age gradient for the rest of the sample is very shallow or consistent with zero. We also find small variations in the [/Fe] ratio with radius. Contrary to what is expected in simple collapse models, galaxies show both positive and negative [/Fe] profiles. This rules out a solely inside-out, or outside-in, formation mechanism for all early-type galaxies. We do not find a correlation between the metallicity and the [/Fe] gradients, and the local metallicity is not correlated with the local velocity dispersion for all the galaxies of our sample, which rules out scenarios where the delay in the onset of the galactic winds is the only mechanism producing the metallicity gradients. We found that metallicity gradients are correlated with the shape of the isophotes and the central mean age and metallicity of the galaxies, for galaxies younger than 10 Gyr. We show that the correlation between the gradients and the central values is not due to the correlation of the errors and indicates that the same process that shaped the gradient, also modified the structural parameters of the galaxies and triggered star formation in their centres. This strongly supports the merger scenario for the formation of these systems, where the degree of dissipation during those mergers increases as the mass of the progenitor galaxies decreases. Finally, we also find a dichotomy in the plane grad[/Fe]-[/Fe] between galaxies with velocity dispersions below and above 200 km s-1, which requires confirmation with larger samples.
keywords:
Galaxies – galaxies: abundances – galaxies: elliptical and lenticular, cD – galaxies: evolution – galaxies: formation – galaxies: kinematic and dynamics1 Introduction
The formation and evolution of massive, early-type galaxies constitutes a long-standing and crucial problem in cosmology. In all hierarchical clustering models within a -dominated Cold Dark Matter (CDM) cosmology, the massive early-type galaxies seen now are expected to have formed through the merger of smaller galaxies over time (e.g. White & Frenk 1991; Somerville & Primack 1999; Cole et al. 2000; de Lucia et al. 2006). These models have found strong support in the recent studies based on the COMBO-17 and DEEP2 surveys which show that the number density of red galaxies has increased since redshift (Bell et al. 2004; Faber et al. 2005). This is true even for the more massive galaxies on the red sequence (although see Cimatti, Daddi & Renzini 2006 for another point of view).
However, most of the studies of the evolution of the Fundamental Plane and colour magnitude relation with redshift are compatible with an epoch of formation of the stars in these galaxies at 2 and a passive evolution since then (e.g. Kelson et al. 2000; Gebhardt et al. 2003; Fritz et al. 2005), at least for the brightest galaxies. Fainter galaxies may have formed a large percentage of their stars at later times (di Serego Alighieri et al. 2005; van der Wel et al. 2005; Holden et al. 2005). If, as usually assumed in the hierarchical models, mergers between galaxies trigger star formation, we would expect elliptical galaxies to show a spread in their ages, and, therefore, in their colors, spreading the scatter of the color-magnitude and fundamental plane correlations, contrary to what it is observed. This problem for the models may be partially solved if any new stars formed are more metal-rich, as both, an increase in age and metallicity produce a reddening of the colors (see., e.g. Faber et al. 1992; Ferreras et al. 1999). Furthermore, in the last few years there have been several studies showing that that mean age (as derived with single stellar population models) of more massive early-type galaxies is larger than the one in the less massive ones (e.g., Caldwell et al. 2003; Nelan et al. 2005; Sánchez-Blázquez et al. 2006b) which would indicate an anti-hierarchical formation of the stars in the galaxies. Again, the anti-hierarchical formation of stars can be reconciled with the hierarchical formation of structures decoupling the epoch of the star formation from the epoch of the mass assembly. In this scenario, there is a systematic decrease, with increasing mass, of the relative amount of dissipation (and, therefore, star formation) experienced by the baryonic mass component when they assemble (e.g. de Lucia et al. 2006).
Moreover, a successful scenario of galaxy formation must reproduce, not only the photometric properties of the galaxies, but also, their structural parameters. Normal and low-luminosity elliptical galaxies rotate rapidly, are nearly isotropic, show discy-distorted isophotes and cuspy inner profiles. On the contrary, giant ellipticals are essentially non-rotating, show anisotropic dynamics, core inner profiles, and boxy isophotes (Kormendy & Bender 1996). The properties of the former can be explained in dissipational mergers, while the latter are recovered successfully with dissipationless mergers.
One way to test this prediction is to study the stellar population gradients in early-type galaxies. The stellar population gradients do not only give information about the formation epoch of the stars in the galaxies, but also about the formation process, as gas dissipation and mergers affect the gradients in different ways (e.g. Larson 1975; White 1980; Mihos & Hernquist 1994; Angeletti & Giannone 2003; Kobayashi 2004). The correlation of the derived stellar population parameters (age, metallicity, abundances ratios) with other global galaxy properties could offer, in principle, invaluable information to determine how the formation and subsequent evolution of early-type galaxies has occurred.
For example, in the classical models of monolithic collapse (Eggen et al. 1962; Larson 1974a; Carlberg 1984; Arimoto & Yoshii 1987; Gibson 1997), stars form in all regions during the collapse and remain in their orbits with little movement inward, whereas gas dissipates into the centre, being continuously enriched by the evolving stars. Therefore, stars formed in the centre are predicted to be more metal rich than those in the outer regions. On the other hand, as a consequence of the continuous enrichment by evolving stars, the centres are predicted to be less -enhanced than the external parts, unless the collapse is extremely short in time. To obtain the hight central values of /Fe measured in early-type galaxies, the duration of the collapse is limited to 1 Gyr (Arimoto & Yoshii 1987; Thomas 1999), therefore, null or very small age gradients are expected within this picture. As the the degree of dissipation in these models is controlled by the potential well, a strong correlation between the metallicity gradient and the mass of the galaxies is also predicted. Supernova-driven galactic winds, also may help to shape the abundances gradients (Mathews & Baker 1971; Larson 1974b; Arimoto & Yoshii 1987; Gibson 1997; Franx & Illingworth 1990; Martinelli, Matteucci & Colafrancesco 1998). These winds, initiated when the energy injected by supernovae into the interstellar medium matches that of the binding energy of the galaxies, act to evacuate the galaxy of gas, thereby eliminating the fuel necessary for star formation. As external parts have shallower potential wells, galactic winds develop earlier than in the central regions, where the star formation and the subsequent chemical enrichment last longer. This mechanism would also lead to positive /Fe gradients (Martinelli et al. 1998; Pipino, Matteucci & Chiappini 2006).
Predictions of the resultant metallicity gradient of a merger remnant are more complicated, as those depend on a large number of free parameters. In general, numerical simulations suggest that dissipationless mergers lead to a flattening of metallicity gradients (White 1980). However, numerical simulations with gas suggests that during the merger a significant gas fraction migrates toward the central regions of the merging galaxies resulting in a starburst (Barnes & Hernquist 1991). These episodes of star formation can also produce metallicity and age gradients (Mihos & Hernquist 1994). If star formation is triggered in the centre of the galaxy due to the merger, [/Fe] gradients can be both, positive or negative depending on the duration of the burst and the original abundance pattern of the gas (see, e.g. Thomas, Greggio & Bender 1999; Pipino & Matteucci 2006). On the other hand, the degree of dissipation and the ratio between the masses of the two merging systems produce differences in the kinematics, shape of the isophotes and other properties of the final remnants (see, e.g. Bekki & Shioya 1997; Naab, Jesseit & Burkert 2006).
Several authors have investigated the variation in the colours (e.g. Vader et al. 1988; Peletier et al. 1990; Silva & Bothun 1998; Tamura et al. 2000; Saglia et al. 2000; Tamura & Ohta 2000,2003; Hinkley & Im 2001; Idiart, Michard & de Freitas Pachecho 2002; Menanteau et al. 2004; La Barbera et al. 2004, 2005; Wu et al. 2005; de Propris et al. 2005) and line-strength indices (e.g. Spinrad et al. 1971; Cohen 1979; Gorgas, Efstathiou & Aragón-Salamanca 1990; Franx & Illingworth 1990; Davidge 1992; Carollo, Danziger, & Buson 1993; Davies, Sadler & Peletier 1993; Fisher et al. 1996; González 1993; Mehlert et al. 2003; Proctor et al. 2005; Sánchez-Blázquez et al. 2006c; Kuntschner et al. 2006) with radius in early-type galaxies, and the results so far appear to be contradictory in many cases: For example, Peletier et al. (1990) found that, for galaxies brighter than M the colour gradient gets flatter with luminosity, while the contrary is seen for galaxies fainter than this magnitude. However, Tamura & Otha (2003) found the opposite trend in the relation of their colour gradients with magnitude.111The colour analysed by Peletier et al. (1990) was U-R while Tamura & Otha (2003) present their results using B-R. Carollo et al. (1993) found a correlation between the Mg2 gradient and the magnitude, central velocity dispersion and mass, but only for faint galaxies, while this correlation has not been confirmed by other studies (e.g. Kobayashi & Arimoto 1999). Other uncertain results include the existence of a correlation between the line-strength index gradients and central values found by some authors (e.g. González & Gorgas 1985; Sánchez-Blázquez et al. 2006c, Kuntschner et al. 2006) but not by others (e.g. Kobayashi & Arimoto 1999; Mehlert et al. 2003).
The lack of agreement between studies is partially due to the high signal-to-noise ratio (S/N) necessary to measure metallicity gradients with accuracy. In this paper we make the first attempt to overcome this limitation, presenting very high quality data allowing for the determination of line-strength gradients in a sample of 11 early-type galaxies spanning a wide range in luminosity. In Sec. 2 we introduce the sample and the observations, together with a description of the data reduction. Sec. 3 presents the rotation curves and the velocity dispersion () profiles. Sec. 4 and 5 describe the measurement of the spectroscopic indices and the transformation of those into age, metallicity and -enhancement gradients respectively. In Section 6, we perform a brief analysis of the central indices. Sections 7.1, 7.2, and 7.3 show the analysis of the age, metallicity and [E/Fe] gradients, and their correlation with other global parameters of the galaxies. Section 8 presents the correlation between the local metallicity and the local , while in Sec. 9 we discuss our results.
2 The Sample: Observations and Data Reduction
The sample consists of 11 galaxies, covering a wide range in luminosity, extracted from the field, poor groups, and the Virgo cluster. Table 1 summarises the main properties of the sample and appendix A includes an enhanced discussion of each galaxy’s properties.
| Galaxy | Type | MB | Profile | Ref. | (v/)* | (a4/a)100 | Env | |
|---|---|---|---|---|---|---|---|---|
| (arcsec) | (mag) | |||||||
| NGC 1600 | E3 | 47.5 | core | 1 | field | |||
| NGC 1700 | E4 | 13.7 | power/core | 1/4 | group | |||
| NGC 2865 | E3-4 | 11.7 | field | |||||
| NGC 3377 | E5-6 | 33.7 | power, power | 1/2 | Leo I group | |||
| NGC 3379 | E1 | 35.2 | core | 1 | Leo I group | |||
| NGC 3384 | SB0 | 24.9 | power | 1/3 | Leo I group | |||
| NGC 4387 | E5 | 15.4 | power | 1 | Virgo cluster | |||
| NGC 4458 | E0-1 | 26.7 | power/core | 1/4 | Virgo cluster | |||
| NGC 4464 | E3 | 5.3 | power | 1 | Virgo cluster | |||
| NGC 4472 | E2/S0 | 104.0 | core | 1/3 | Virgo cluster | |||
| NGC 4551 | E | 17.7 | power | 1 | Virgo cluster |
2.1 Observations and data reduction
2.2 Observations
The observations were made using Low Resolution Imaging Spectrograph (Oke et al. 1995) in long-slit mode on the Keck II telescope. All 11 galaxies were observed on a two-night run in 2005 February 8–9. Two 600s exposures were taken for each galaxy except for NGC 4472 where two exposures of 600 and 300s were taken. The slit was 175-arcsec long and 1.5-arcsec wide, and was oriented along the major axis of the galaxies. We use the 400 line mm-1 grism blazed at 3400 Å. This instrumental setup gives a spectral resolution of 8.0 Å (FWHM) and a dispersion of 1.09 Å/pixel. The total wavelength coverage is 3110–5617 Å. A total of 5 stars belonging to both the Lick/IDS stellar library (Gorgas et al. 1993; Worthey 1994) and MILES library (Sánchez–Blázquez et al. 2006d) were observed. These stellar templates though, we observed with a different grating than the galaxies and, therefore, were only used to measure the seeing during the observations and to flux-calibrate the spectra.
2.3 Data reduction
The standard data reduction procedures (bias subtraction, flat-fielding, cosmic-ray removal, wavelength calibration, sky subtraction and flux calibration) were performed with Reduceme (Cardiel 1999). This reduction package allows a parallel treatment of data and error frames and, therefore, produces an associate error spectrum for each individual data spectrum. After the bias subtraction, the pixel-to-pixel sensitivity variations were removed (using flat-field exposures of a tungsten calibration lamp).
Prior to the wavelength calibration, arc frames were used to correct from geometrical distortions along the spatial direction (C-distortion) in the images. This correction guarantees alignment errors to below 0.1 pixel. Spectra were converted to a linear scale using typically 50 arc lines fitted by 3th-5th order polynomial with RMS-residuals of 0.1 Å. The spectra were also corrected for geometrical distortions along the spectral direction (S-distortion). To do that we use a routine that finds the maximum corresponding to the centre of the galaxy as a function of wavelength and fits these positions with a low-order polynomial. The spectra are then accordingly displaced using a technique that minimizes the errors due to the discretization of the signal. The typical error in the centring of the object is very small, 0.1 pixel (see Cardiel 1999 for details).
Atmospheric extinction was calculated using the extinction curve from the CFHT Bulletin, number 19, p16 (1998) available through http://www.jach.hawaii.edu/UKIRT/astronomy/exts.html. To correct for the effect of interstellar extinction, we used the curve of Savage & Mathis (1979), and values of the colour excess, , from NED.
Some of the reduction steps, such as sky subtraction, can have a significant impact on the derived gradient. Since galaxy light levels are usually only a few per cent of the sky signal in the outer parts of the galaxies, this process constitutes one of the most important potential sources of systematic errors (see Cardiel, Gorgas & Aragón-Salamanca 1995). Fortunately, our observations were performed in dark time, which reduce the variability of the sky during the exposures and, therefore, improve the accuracy of the correction. One of the main problems to perform a proper sky subtraction is that some of the galaxies are large enough to fill a large part of the data frames, so that a sky spectrum measured at the edges of the frame is contaminated by light from the galaxy. In order to avoid this problem, we offset the centre of the slit from the galaxy centre. This ensures a lower level of contamination, at least in the sky measured at one of the edges of the frames. The sky level was measured at the end of the slit and subtracted from the whole image. To test the error in the sky-subtraction we selected the galaxy with a larger effective radii of our sample, NGC 4472 and measured the number of counts that the galaxy contributed in the sky regions. This was done by fitting a de Vaucouleurs profile to the surface brightness profile of the galaxy. The contamination of the galaxy in the selected region was lower than 1 per cent. This contamination produce a negligible effect in the measured indices.
Relative flux calibration of the spectra was achieved using exposures of standard stars. All the calibration curves were averaged and the errors on the indices due to the errors on the flux calibration were estimated by the differences between the indices measured with different curves.
From each full galaxy frame, a final two-dimensional spectrum was created by extracting spectra along the slit, binning in the spatial direction the necessary number of 1D spectra to guarantee a minimum signal-to-noise ratio per Å (S/N) of 50 in the spectral region of the H index, which ensures a maximum relative error for this index of 9 per cent (see Cardiel et al. 1998). Imposing this criteria, we can measure line-strength indices, in most galaxies, at distances from the centre of 2reff. This S/N ratio at this radius has not been achieved previously.
3 Kinematic profiles
Radial velocities and velocity dispersions for each spectrum were calculated using MOVEL and OPTEMA algorithms described by González (1993). The MOVEL algorithm, (improved version of the classic Fourier quotient method by Sargent et al. (1977), is an iterative procedure in which a galaxy model is processed in parallel to the galaxy spectrum. In this way, a comparison between the input and recovered broadening functions for the model allows one to correct the galaxy power spectrum from any imperfections of the data handling in Fourier space. The main improvement of the procedure is introduced through the OPTEMA algorithm, which is able to overcome the typical template mismatch problem. For each spectrum, 25 star spectra from the MILES library (Sánchez-Bl’azquez et al. 2006d) were scaled, shifted and broadened according to a first guess of the (mean line strength), (radial velocity) and (velocity dispersion) parameters, having into account the difference in spectral resolution between the stellar and the galaxy spectra. The next step is to find the linear combination of the template spectra that best matches the observed galaxy spectrum. This provides a first composite template which is fed into the MOVEL algorithm. The output kinematic parameters were then used to create an improved composite template and the process was iterated until it converged. This iterative approach provides an optimal template while simultaneously computing the radial velocity and velocity dispersion of the galaxy spectrum. In Fig. 1 we show a typical fit between the central spectrum of a galaxy and its corresponding optimal template corrected with the derived kinematic parameters. For each galaxy spectrum, random errors in the derived kinematic parameters were computed by numerical simulations. In each simulation, a bootstrapped galaxy spectrum, calculated from the error spectra provided by the reduction with Reduceme by assuming Gaussian errors, is fed into the algorithms described above. Errors in the parameters are then calculated as the standard deviations of the different solutions.
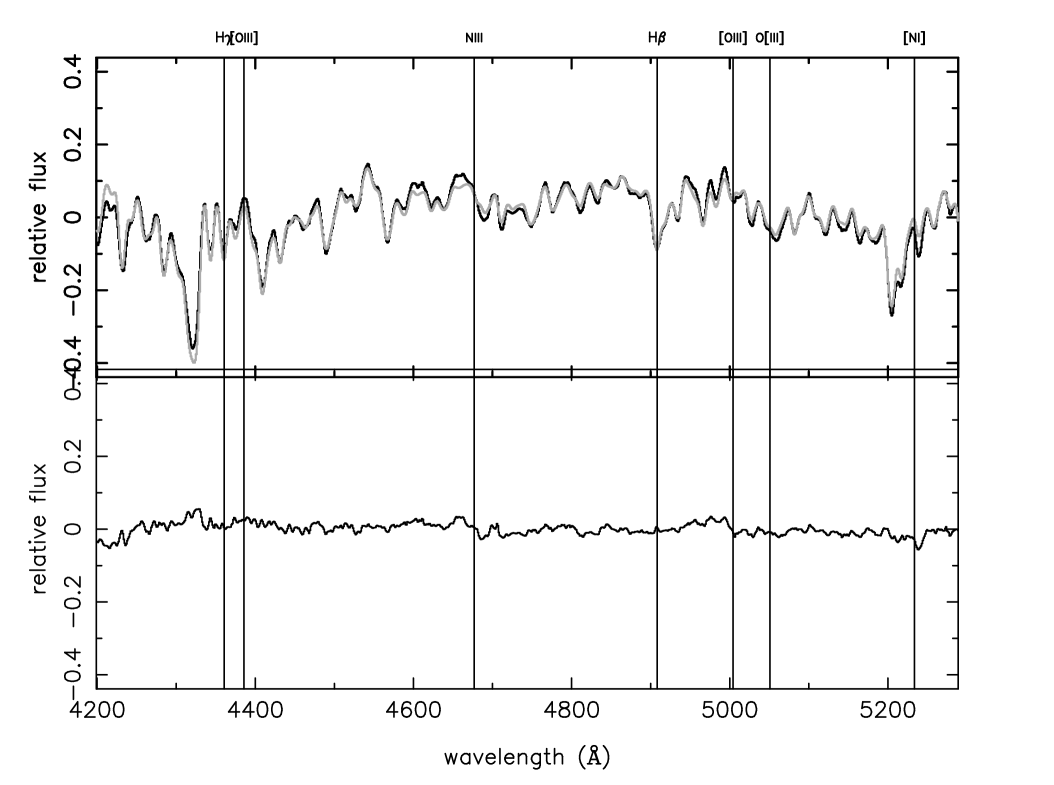
Figure 2 shows the kinematic profiles and velocity dispersion profiles for all the galaxies in the sample. Below we analyse the rotation curve and velocity dispersion profile for the individual galaxies:
NGC 1600: Very little rotation and high velocity dispersion along the radius.
NGC 1700: Clear evidence seen in the profile of the presence of a counterotating core, previously found by other authors (Statler et al. 1996) and a large rotation at large radii. The velocity dispersion profile shows a depression in the central parts, which indicates that a more rotationally supported component is present at the galaxy centre.
NGC 2865: This galaxy shows also the presence of a kinematically-decoupled core with a radius of 5′′ and a large rotation at larger radii.
NGC 3377: This galaxy shows large rotation in the centre, indicating the possible presence of a central disc. Beyond 5 arcsec, the velocity along the radius remains constant.
NGC 3379: This galaxy shows very little rotation.
NGC 3384: The rotation curve indicates that the slit was not perfectly centred during the observations. The velocity dispersion profile shows a depression in the centre.
NGC 4387: The velocity dispersion profile shows a depression in the centre, which may indicate the presence of a stellar disc.
NGC 4458: The kinematic profile in this galaxy indicates that the slit was not perfectly centred in the object. Apart from that, the galaxy shows evidence for a kinematically-decoupled core.
NGC 4464: This galaxy shows a rotational curve consistent with the presence of a gaseous disc (see also Halliday et al. 2001) with a scale-length of 4 arcsec. The rotation curve starts to decrease beyond this radius.
NGC 4472: We detect some indication of a kinematically-decoupled structure in the centre of the galaxy, with very little rotation.
NGC 4551: This galaxy shows rotation in the central parts and then the rotation curve is flat at larger radii. The velocity dispersion profile shows a depression in the centre.
We confirm the presence of kinematically-decoupled cores in several galaxies: NGC 1700, NGC 2865, and NGC 4458, as previously reported by other studies (Statler et al. 1996; Hau et al. 1999; Morelli et al. 2004). Ellipticals with kinematically-decoupled cores can originate from dissipative major galaxy mergers between two spirals (Hernquist & Barnes 1991), a spiral and a elliptical (Franx & Illingworth 1988) or by accretion of small satellites via dynamical friction (Kormendy 1984), although the decoupled subsystems are often dynamically colder than expected from purely stellar satellite accretion (Bender & Surma 1995; Franx & Illingworth 1988). Recent studies favour major mergers to form kinematically-decoupled structures (Jesseit et al. 2006). These kinematically-decoupled structures, however, cannot be formed in mergers without dissipation.
We also found that, for the galaxies NGC 3384 and NGC 4458 the slit was slightly offset from the centre of the galaxy. In principle, one concern is that this could affect the gradients. However, the line-strength indices gradients of these two galaxies are compared with the ones derived by the SAURON group (Kuntschner et al. 2006) in appendix C, and they are very similar. Therefore, we consider that the gradients we are measuring are not very dissimilar to the ones we would have obtained with the slit perfectly centred in the galaxies.


4 Line-strength indices
In each individual spectrum we measured a total of 15 Lick/IDS indices
(from CN1 to Fe5335; Trager et al. 1998),
the D4000 break (Bruzual 1983) and the 4 higher-order Balmer lines
H, H, H, H defined
by Worthey & Ottaviani (1997).
In order to compare the measured indices with stellar population
models using the fitting functions obtained with the Lick/IDS
stellar library
(Gorgas et al. 1993; Worthey et al. 1994) the data have to be transformed into the Lick/IDS spectrophotometric
system.
The transformation into the Lick/IDS system compensates for two
different effects. The first effect is the instrumental and Doppler
broadening. Before measuring the indices on the spectra,
they have to be degraded to the resolution of the Lick/IDS
library and the indices have to be corrected
for the internal motions of the stars.
The usual method to perform this correction is to convolve the
stellar spectra with different broadening functions of
different velocity dispersions and use a polynomial expansion
to describe the variation of a given line index as a function of the
input velocity dispersion.
However, the variation of a given line index with velocity
dispersion depends on the strength of the index itself.
(see, for example, appendix B2 in
Kuntschner 2000). Therefore,
by assuming a single polynomial we are introducing systematic
errors that can affect the relation of the indices with the velocity
dispersion. To avoid these problems,
we perform the broadening corrections following the method described
in Kelson et al. (2006) .
The corrected line strength indices are obtained as follows:
| (1) |
where IG is the index measured directly on the galaxy spectrum, IB(σ)oT, the index measured from the optimal template spectrum (obtained in the computation of the velocity dispersions, see Sec.3) broadened to the instrumental resolution and to the velocity dispersion of the galaxy, and I is the index measured on the optimal template spectrum with a velocity dispersion of zero and convolved to the resolution of the Lick/IDS system (Worthey & Ottaviani 1997).
The second effect that has to be corrected is the small systematic differences that appear when the indices measured on the Lick stars and in flux calibrated stars are compared. These small offsets are partially due to the differences in the continuum shape, as Lick/IDS stars are not flux-calibrated, although these differences do not explain the offsets of all indices (see., e.g. Worthey & Ottaviani 1997). The usual procedure to perform this correction is to observe, with the same instrumental configuration as the galaxies, stars in common with the Lick/IDS library and compare the indices measured in them (after degrading the spectra to match the Lick/IDS resolution) with the indices measured on the Lick spectra. However, we did not observe stars with the same instrumental configuration as the galaxies. Therefore, we derived these offsets by comparing the indices of 10 galaxies in common with Trager et al. (1998), which were observed with the same instrumental setup as the Lick/IDS library. In order to avoid artificial offsets due to line-strength gradients in galaxies, we extracted the spectra in an aperture of 4, very similar to the one in Trager et al. (1998) (4).
However, Trager et al. (1998) do not measure the H and H indices. To determine the offsets in the high order Balmer lines we compare the indices of 5 galaxies in common with Sánchez-Blázquez (2004). We selected the measurements within an aperture of , which is the most similar to the aperture used by Trager et al. A detailed comparison is shown in Appendix B. The final offsets are listed in Table 2.
| Index | Offset | RMS | RMS(exp) | |
|---|---|---|---|---|
| H | 0.000 | 0.099 | 0.089 | 0.52 |
| H | 0.000 | 0.084 | 0.056 | 0.86 |
| CN1 | 0.013 | 0.013 | 2.75 | |
| CN2 | 0.017 | 0.016 | 2.72 | |
| Ca4227 | 0.139 | 0.224 | 2.64 | |
| G4300 | 0.356 | 0.267 | 1.47 | |
| H | 0.380 | 0.124 | 0.085 | 1.92 |
| H | 0.533 | 0.060 | 0.050 | 1.99 |
| Fe4383 | 0.328 | 0.478 | 1.97 | |
| Ca4455 | 0.000 | 0.165 | 0.193 | 0.96 |
| Fe4531 | 0.000 | 0.288 | 0.318 | 1.06 |
| C4668 | 0.434 | 0.480 | 2.43 | |
| H | 0.146 | 0.163 | 1.07 | |
| Fe5015 | 0.000 | 0.611 | 0.413 | 1.27 |
| Mg1 | 0.000 | 0.008 | 0.011 | 1.27 |
| Mg2 | 0.011 | 0.008 | 0.012 | 2.50 |
| Mgb | 0.133 | 0.181 | 2.82 | |
| Fe5270 | 0.210 | 0.174 | 1.47 | |
| Fe5335 | 0.201 | 0.213 | 2.60 |
4.1 Emission-line correction
A large percentage of early-type galaxies show small amounts of gas. Some line-strength indices are affected by these emission lines. In particular, this is the case of H, Fe5015 and Mgb. Before measuring line-strength indices this emission has to be removed. To measure the flux of the emission lines we used the routine GANDALF (Sarzi et al. 2006). This routine fits simultaneously both the stellar spectrum and emission lines, treating the emission lines as additional Gaussian templates. For the stellar templates, we use synthetic stellar energy distributions from Vazdekis et al. (2007) based on the MILES stellar library (Sánchez-Blázquez et al. 2006d). Our detection limit is 0.3 Å for [OIII]5007 and [NI]5200, and 0.25Å for H (see Sarzi et al. 2006 for details on how to calculate this threshold). NGC 1700, NGC 2865, NGC 3377, NGC 3379, NGC 3384 show the presence of weak emission lines above our detection limit. The emission spectra were subtracted to the galaxy spectra and indices measured in the emission-free spectra.
In order to check the reliability of our line-strength gradients we have compared the derived line-strength indices with the ones derived by other authors, in particular, with the studies by Fisher et al. (1996) and Kuntschner et al. (2006). The results of this comparison can be found in appendix C. In general, the agreement is very good, although none of these studies reaches the same distance from the galaxy centres as the present study.
5 Stellar population parameters gradients
We derive Single Stellar Population (SSP)-equivalent parameters age, [Fe/H] and -abundance ratios for all the galaxies of the sample using the -minimization technique detailed in Proctor & Sansom (2002) and Proctor et al. (2004a,b). The technique involves the comparison of as many indices as possible to simple stellar population (SSP) models. In the method described by Proctor et al. (2004a,b) the indices which significantly deviate by more than 3 are clipped from the fit and is recalculated. However, in this study, we have preferred to obtain the stellar population parameters with the same indices for all the galaxies in order to obtain homogeneous ages and abundances, although the results do not change if we clip the deviating indices (see below). In particular, we used 19 indices, including all Lick/IDS and Worthey & Ottaviani (1997) indices.
We adopted the SSP models of Thomas, Maraston & Bender (2003, TMB03 hereafter) and Thomas, Maraston & Korn (2004, TMK04 hereafter) for the extension to the higher order Balmer lines. These models include the effect that a variation in the [/Fe] ratios produce in the Lick indices. To do that, the authors used the new response functions by Korn, Maraston & Thomas (2005), as opposed to the widely used response functions by Trippico & Bell (1995). An important improvement of the Korn et al. (2005) response function over the ones by Trippico & Bell (1995) is the treatment of the element carbon. Houdashelt et al. (2002) pointed out that enhancing the abundance of C by +0.3 (which is the factor Tripicco & Bell fitting functions use) brings the C/O ratio very close to unity producing a carbon star. Worthey (2005) noticed that the response functions of Tripicco & Bell (1995) are overestimating the sensitivity of C4668 to C by not taking this effect into account. The Korn et al. (2005) response functions deal with this problem by computing the sensitivity of indices to C by increasing the C abundance by only +0.15 dex. The -enhancement is parametrized in these models by [E/Fe]; the abundance ratio of the -elements O, Ne, Mg, Si, S, Ar, Ca and Ti plus the elements N and Na. (see the original references for details).
Residuals to the best-fitting (observed value minus best-fitting value expressed in terms of the index errors) for all the galaxies are summarised in Fig. 3. The points represent the average deviation from the best-fitting values while the errors bars show the RMS for all the points along the radius. As can be seen, the mean differences between the fitted and the measured errors are very small, confirming the reliability of the fitting procedure.

Figures 4, 5 and 6, show the age, metallicity and [E/Fe] profiles for all the galaxies in our sample. We have to remind the reader that those values of age, metallicity and [E/Fe] are SSP-equivalent parameters. If galaxies experience a star formation history more complicated than a single, instantaneous burst, those values have to be carefully interpreted: for example, if a galaxy has experience two burst of star formation separated in time, the SSP-age would be biased toward the age of the youngest stars, while the SSP-metallicity would be closer to the metallicity of the old population (although this depends, of course, of the mass fraction of the bursts, see, e.g. Serra & Trager 2006 for a detailed analysis).
To quantify the profiles we perform a linear fit weighting with the errors in the -direction and excluding the points from the centre within the diameter of the seeing disc to avoid seeing effects. The extent of the seeing disc (FWHM of the point spread function) was taken from the measurements performed by the Mauna Kea seeing monitor, but the measurements were checked by measuring the FWHM of the Point Spread Functions on observed standard stars. The points excluded from the fit are represented with open symbols. For completeness, we have performed also a linear-fit on the age profile of the galaxy NGC 3377, despite this profile being clearly non-linear. The errors in the gradients were calculated as the unbiased standard deviation from the fit. Table 3 shows the derived gradients of age, [Z/H] and [E/Fe].


5.1 Checking the reliability of the stellar population gradients
One of the major problems of using a large number of indices to derive stellar population parameters by minimization is related to the zero-point of the models. Although we have added suitable offsets to transform our data into the Lick/IDS spectrophotometric system, the models have problems reproducing some of the measured indices for Galactic globular clusters (e.g. TMB03). The same problem has been observed in elliptical galaxies where it has been also shown that the age and metallicity depend on the index used to measure those parameters (e.g. Peletier et al. 1990; Faber et al. 1992; Vazdekis et al. 2001; TMB03, Sánchez-Blázquez et al. 2006b)
Most of these differences, but not all, can be attributed to peculiar abundances ratios in the Galactic globular clusters and elliptical galaxies (TMB03). In fact, TMB03 showed that part of the problem is solved with the inclusion of non-solar [/Fe] abundances in the models but, certainly, this is still an issue when one wishes to use a large number of indices with different sensitivities to different chemical species as (1) some other elements apart from the ones considered in the models may have abundances ratios different from solar, and (2) because it may be the case that not all the elements are equally enhanced, as seen, for example, in the Galactic bulge (Lecureur et al. 2007).
Kelson et al. (2006) treated this problem by recalibrating the stellar population models. To do that, they used a reference galaxy and assigned to it an approximate age, metallicity and [/Fe]. They derived offsets in all the indices so the final indices coincide with the values given by the models for the selected stellar population parameters. They applied these offsets to all the galaxies in their sample. This study was the first to take the effect of the zero-point into account in the derivation of ages and metallicities using a large number of indices. However, their approach assumes that the offsets are the same for all the galaxies, while, if the offset is due to differences, for example, in the chemical abundance ratios not considered in the models, this assumption presumably would not be true, as the chemical composition is different for galaxies of different masses. Furthermore, if galaxy stellar populations are not suitably described by means of SSP models, the age and metallicities measured with different indicators might be different, simply because the weight of different stars to different regions of the spectra is different (e.g. Sánchez-Blázquez et al. 2006b; Schiavon et al. 2006). The only way to deal with this is to use a deconstruction method to analyse the whole star formation history of the galaxy (e.g., Panter, Heavens & Jimenez 2003; Ocvirk et al. 2006a,b). This will be done in a future paper. Instead, in the present work, we check the robustness of our results by comparing our gradients with the ones obtained using different indices and models. In particular, we will compare the age, metallicity and [E/Fe] gradients obtained as described above with the ones obtained as follow: (1) Using a set of three indices: Fe4383, H and Mgb; (2) Using 19 indices, but clipping the indices that deviate more than 3- from the fit; (3) Using the models by Vazdekis et al. (2007)222availables at http://www.ucm.es/info/Astrof/users/pat/models.html and a the indices Fe4383, H and Mgb. The last option is being shown as an extreme case of a completely different technique and model and serves a purpose in showing the robustness of the results against the technique and models employed.
(1) We selected H, Fe4383 and Mgb because the models do an excellent job fitting these indices to globular clusters measurements and also because they have the highest sensitivities to the parameters we want to measure, i.e., age, Fe, and Mg abundances respectively. We perform a linear fit to the final values with radius in the same way as described above. The gradients are shown in Table 3
| Galaxy | grad age | grad [Z/H] | grad[E/Fe] | |||
|---|---|---|---|---|---|---|
| (19 indices) | (3 indices) | (19 indices) | (3 indices) | (19 indices) | (3 indices) | |
| (TMB03) | (TMB03) | (TMB03) | (TMB03) | (TMB03) | (TMB03) | |
| NGC 1600 | ||||||
| NGC 1700 | ||||||
| NGC 2865 | ||||||
| NGC 3377333The age profile in this galaxy is not linear | ||||||
| NGC 3379 | ||||||
| NGC 3384 | ||||||
| NGC 4387 | ||||||
| NGC 4458 | ||||||
| NGC 4464 | ||||||
| NGC 4472 | ||||||
| NGC 4551 | ||||||
| (19 indices) | (3 indices) | (19 indices) | (3 indices) | (19 indices) | (3 indices) | |
| with clipping | V07 models | with clipping | V07 models | with clipping | V07 models | |
| NGC 1600 | ||||||
| NGC 1700 | ||||||
| NGC 2865 | ||||||
| NGC 3377 | ||||||
| NGC 3379 | ||||||
| NGC 3384 | ||||||
| NGC 4387 | ||||||
| NGC 4458 | ||||||
| NGC 4464 | ||||||
| NGC 4472 | ||||||
| NGC 4551 | ||||||
(2) Although we decided to use the same indices for all the galaxies and along the radius to avoid any possible bias in the result due to the different sensitivity of the different indices to different chemical compositions, here we compare with the results obtained when a 3- clipping is applied during the minimization as in the original method described by Proctor & Sanson (2002).
(3) Finally, we also calculate the stellar population parameters along the radius using the new stellar population models by Vazdekis et al. (2007). These models are built for solar chemical composition and they are only calibrated for variations of age and [Z/H]. To derive [E/Fe] values, we followed the same procedure as in Trager et al. (2000a, T00a hereafter), with the only difference that we use the new fitting functions of Korn et al. (2005) instead of the Trippico & Bell (1995) ones used by T00a. We include in the enhanced group ([X/H]=+0.3) the elements C, N, O, Mg, Fe, Ca, Na, Si, Cr, and Ti, while the elements Cr, Mn, Co, Ni, Cu and Zn are depressed by [X/H]=. We interpolate the model grid at intervals of 0.1 Gyr in age and 0.05 in metallicity. Then we applied the response functions by Korn et al. (2005) to obtain an interval step of 0.05 in [E/Fe]. Stellar population equivalent parameters were derived by choosing the best-fitting age, [Z/H] and [E/Fe] for the indices H, Fe4383 and Mgb.
Fig. 7 represents the comparison of the gradients calculated with all the 19 indices as described at the beginning of the section with the methods (1), (2) and (3) described above. Table 4 shows the mean offset and residual dispersion of the comparison, calculated as the quadratic difference between the measured dispersion and the one expected from the errors.
As can be seen, significant offsets do not exist between the gradients calculated with a different number of indices. We do not even find significant offsets between the gradients calculated with different models and different number of indices. The RMS dispersion in the comparison of the methods with and without clipping is compatible with the errors, however, the dispersion among the 1:1 relation in the comparison of the methods (1) and (3) with the method employing 19 indices is larger than the one expected by the errors. This should prevent us drawing conclusions that are not confirmed using the gradients measured with all the different methods.


In the rest of the paper we use the gradients derived with 19 indices without clipping because the errors on the parameters are smaller. We have checked, though, that none of the conclusions would change if we used the ones calculated with any of the other methods described above.
| TMB03 models | TMB03 models | V07 models | ||||||||||
| 3 indices | 19 indices (clipping) | 3 indices | ||||||||||
| offset | RMS | RMS | RMS | offset | RMS | RMS | RMS | offset | RMS | RMS | RMS | |
| (exp) | (res) | (exp) | (res) | (exp) | (res) | |||||||
| grad age | ||||||||||||
| grad [Z/H] | ||||||||||||
| grad [E/Fe] | ||||||||||||
6 Central values
In order to compare the gradients with the central values, we also extracted, for each galaxy, a spectrum within an aperture of 1.5 and used the corresponding line-strength indices to derive stellar population parameters. Fig. 8 shows the classical relations between the Mgb and the central velocity dispersion for our sample of galaxies.

Table 7, in appendix , shows all the central indices and the central velocity dispersion. The values of the mean SSP-age, -metallicity and -[E/Fe], as derived with 19 indices are reported in Table 5.
| Galaxy | Age (Gyr) | [Z/H] | [E/Fe] |
|---|---|---|---|
| NGC 1600 | |||
| NGC 1700 | |||
| NGC 2865 | |||
| NGC 3377 | |||
| NGC 3379 | |||
| NGC 3384 | |||
| NGC 4387 | |||
| NGC 4458 | |||
| NGC 4464 | |||
| NGC 4472 | |||
| NGC 4551 |
Fig. 9 shows the relation of the age, metallicity and [E/Fe] with the central velocity dispersion. We have separated the galaxies –with different symbols– as a function of their central ages. As can be seen, contrary to what happens when the indices are compared with this parameter, the relations appear to have considerable dispersion. We analyse separately the three relations:
[Z/H] vs. : The relations between the Mg2 index and and the color-magnitude relations have been interpreted, classically, as a mass-metallicity relation for early-type galaxies (e.g. Kodama & Arimoto 1997), in the sense that more massive galaxies are also more metal rich. However, it is clear from Fig. 9 that we do not detect a correlation between the metallicity and the velocity dispersion. Old galaxies (with ages 8 Gyr) define a mass-metallicity sequence, but galaxies with intermediate- or young- ages, lie above the relation in such a way that the deviation from the relation correlates with the light-weighted mean age. The same result was obtained by Jørgensen (1999) and Trager et al. (2000b). Trager et al. (2000b) showed that galaxies are in a plane within the space of age, [Z/H] and , where, at a given , galaxies more metal rich are also younger. In the figure we have plotted the best-linear-relation found by Nelan et al. (2005) and the RMS dispersion found by those authors. As can be seen, the oldest galaxies of our sample (with ages8 Gyr) follow a very similar relation than the one found by these authors, but the younger galaxies deviate systematically from the relation. As several authors have noted before, the fact that, at a given , younger galaxies are also more metal rich has very important implications as, if real, the tightness of the colour-magnitude relation should not be interpreted as a low dispersion in the mean stellar ages of galaxies. This is because the effect that a rejuvenation of the stellar population has in the line-strength indices and colour is very similar to a decrease in metallicity – the so-called age-metallicity degeneracy (see, e.g. Worthey 1994). This should be taken into account, also, when interpreting the evolution of the colour-magnitude diagram with redshift.
The result shown here and in the studies mentioned above challenges the interpretation of the color-magnitude relation as a purely mass-metallicity relation, as usually assumed in the literature, as galaxies with the same mass can show a large spread in their metallicities.
[E/Fe] vs : Several authors have found the existence of a positive correlation between the degree of -enhancement in the central parts of early-type galaxies and (Faber et al. 1992; Worthey, Faber & González 1992; Kuntschner 2000, Jørgensen 1999; Trager et al. 2000b; Terlevich & Forbes 2002; Thomas et al. 2005; Nelan et al. 2005). -elements and Fe-peak elements are released into the interstellar medium by different stars and on different time-scales. Therefore, it is common in the literature to use [E/Fe] as a cosmic clock to quantify the duration of the star formation. The reported relation between the ratio [E/Fe] and would imply, in this context, that more massive galaxies formed their stars in shorter time-scales. The relation between the [E/Fe] and the central velocity dispersion is, however, not very clear in our data (a non-parametric Spearman rank order test gives a probability of no correlation of 5 per cent, which is less than 2- significance). The most massive galaxies are the ones with higher [E/Fe], but there is considerable scatter at lower . We have also plotted, in the figure, the relation found by Nelan et al. (2005) using 500 galaxies. As can be seen, our galaxies follow the same relation, and the lack of correlation may be due to the small sample size.
Finally, we present in the bottom panel of Fig. 9 the relation between the central age and the central velocity dispersion. Contrary to what has been reported in many studies (e.g. Caldwell et al. 2003; Nelan et al. 2005; Bernardi et al. 2006; Sánchez-Blázquez et al. 2006b) we do not find any relation between these two parameters. Although we do not find young galaxies with km s-1, we find a very large dispersion in the ages of galaxies with km s-1. In the figure we also show the relation found by Nelan et al. (2005). It can be seen that the youngest galaxies in our sample clearly deviate from the relation found by those authors, although the rest of the galaxies are consistent with it.


7 Gradients of age, [Fe/H] and [E/Fe]
The variation of the physical properties of galaxies with radius prove invaluable information for constraining the processes of galaxy formation and evolution. In the following sections we will analyse the relation between the stellar population parameters and other properties of the galaxies trying to understand the mechanism dominating the formation of the measured gradients.
7.1 Age gradients
We find that for 10 of the 11 galaxies, age gradients are compatible with zero-slope. NGC 1700 show a significant age gradient when this is measured using 19 indices, but this is not true if only 3 indices are employed, independently of the model used. NGC 3377 seems to show an age gradient, but the age profile in this galaxy does not behave as a power-law, and, therefore, it does not make much sense to perform a linear-fit. Several authors have analysed age gradients in samples of early-type galaxies but the results are still not conclusive. For example, Hinkley & Im 2001; Mehlert et al. (2003) and Wu et al. (2005) did not find any overall age gradient in their samples. Some other authors (e.g. Silva & Elston 1994; González 1993; Tantalo, Chiosi & Bressan 1998; Sánchez-Blázquez et al. 2006c), however, have detected non-zero age gradients in their respective samples. The typical values found by those authors is 20 per cent variation, with the central parts younger than the external parts.
7.2 Metallicity gradients
The mean [Z/H] gradient of our sample is with an RMS dispersion of 0.133. This value suggests a mean reduction of metallicity in elliptical galaxies of more than 50 per cent per decade of variation in radius. This value is compatible with the values derived by other studies, e.g. r= (Gorgas et al. 1990); r= (Fisher et al. 1995). In principle, the strength of the metallicity gradient is related to the merging history of the galaxies, as, while dissipational processes tend to create stronger gradients, mergers between galaxies destroy these gradients (e.g., Mihos & Hernquist 1994; Kobayashi 2004) The mean metallicity gradients for non-merger and merger galaxies derived by Kobayashi (2004) are [Z/H]/ and , respectively. As can be seen, galaxies in our sample are compatible with both of these values. The direct comparison between the metallicity gradient obtained with single stellar population models and numerical simulations is, however, difficult, due to the manner by which the results from numerical simulations are transformed to the observational plane. Another way to determine the evolutionary paths of early-type galaxies is to study the relation between the metallicity gradients and other global properties of these systems, as different physical processes are expected to lead to different correlations. For example, dissipational processes are believed to create steeper gradients in more massive galaxies (Carlberg 1984; Bekki & Shioya 1999), although this is sensitive to the adopted feedback prescription in the simulations (e.g. Bekki & Shioya 1998; Bekki & Shioya 1999). Dissipationless mergers of galaxies, on the contrary, are expected to produce some dilution of the gradients in galaxies (White 1980) deleting or producing an inverse correlation among stellar population gradients and luminosity.
Fig. 10 shows the correlation of the metallicity gradient with the velocity dispersion for our sample of galaxies. Although the sample is not very large, we confirm the lack of correlation previously noted by other authors using line-strength indices (e.g. Gorgas et al. 1990; Davidge 1991, 1992; Davies et al. 1993, Mehlert et al. 2003). Galaxies with steeper gradients are not the most massive of our sample but the ones with km s-1.
A similar trend was found by Kormendy & Djorgovski (1989) between the color gradients and MB in a sample obtained by combining data with different quality from Vader et al. (1988), Franx et al. (1989) and Peletier et al. (1989). Carollo et al. (1993) compared the Lick index Mg2 gradient and both, the mass, and the luminosity (derived from the Fundamental plane), and they concluded that there is a change in the slope of the trends approximately at the same mass as found here. They also found a significant correlation between the gradients and mass for galaxies with M, where Mtot represents the total mass of the galaxy. Our sample is too small to perform reliable statistical tests to study the significance of the correlations in the two magnitude ranges. Confirming the presence of a slope change in the grad[Z/H] plane at M will require a larger sample of comparable quality to that presented here. However, there is a significant degree of evidence now which indicates that the metallicity gradient is not constant with the mass of the galaxies, but gets steeper for galaxies around this magnitude.

As we said earlier, the correlation between the metallicity gradient and the mass of the galaxies in the context of mergers of galaxies depends on the degree of dissipation in the merging. A positive correlation, as suggested by some authors (e.g. Carollo et al. 1993; this study) for galaxies with M, is expected in mergers with gas (Bekki & Shioya 1999), while the opposite trend (as suggested by some studies, e.g., Vader et al. 1998; Franx 1988) is expected in dissipationless mergers, assuming that more massive galaxies have suffered more mergers (as predicted by hierarchical models of galaxy formation). Therefore, if the trends are confirmed, they could be explained assuming a decrease, with the mass of the galaxy, of the degree of dissipation during the last major merger event.
Several studies (Carollo et al. 1993; González & Gorgas 1995) have found that galaxies with stronger central Mg2 indices showed, also, steeper Mg2 gradients. Although other authors (Kobayashi & Arimoto 1999; Mehlert et al. 2003) have failed to find this correlation, it has been recently confirmed by some studies (Sánchez-Blázquez et al. 2006c; Kuntschner et al. 2006). However, Kuntschner et al. (2006) claim that the correlation is driven by S0 galaxies or, in particular, by young galaxies. If the central metallicity values are correlated with the metallicity gradient, it would imply that the global metallicities of ellipticals were more similar than the central ones. Unless such aperture effects are taken into account, the impact upon the interpretation of scaling relations - such as the redshift evolution of the colour-magnitude relation - could be significant.
In Fig. 11 we have plotted this relation, but using the metallicity instead of the Mg2 index. We have separated, with different symbols, galaxies in different ranges of central ages. There exists a trend for which galaxies with higher central metallicities also show steeper gradients in this parameter, although there is considerable scatter among the relation. A non-parametric Spearman rank-order test gives a level of significance lower than 0.05 (or a probability of correlation of 95 per cent), which is the limit to claim a correlation. In principle, this correlation could be the consequence of the correlation of the errors, as an increase in metallicity in the centres would produce also an increase in the metallicity gradient. To check this possibility we have represented, in Fig. 12 the relation between our metallicity gradients and the central ages from other authors. In particular, we have used the values obtained by Terlevich & Forbes (2000) using Worthey (1994) stellar population models and the combination of indices Mgb, Fe and H collected by different studies. As can be seen, the trend is still present even using completely independent values, which argues against the correlation of the errors being the only reason for its existence.


To explore the relation between the metallicity gradient and the central age of the galaxies we have represented, in Fig. 13, these two magnitudes. And, as can be seen, the correlation is obvious for galaxies with central ages less than 10 Gyr. For the whole sample, a rank-order Spearman correlation test gives now a probability of non-correlation lower than 1 per cent. We have also separated the galaxies with central metallicities higher (stars) and lower (circles) than [Z/H]=+0.2. In general, galaxies showing steeper metallicity gradients are more metal rich and younger while galaxies with shallower metallicity gradients are older. For galaxies older than 10 Gyr, however, half of the sample have low metallicities in their centre, while half of the sample show metallicities higher than [Z/H]=+0.2. (see Table 5). The galaxies with larger metallicity are the most massive galaxies of our sample, with 200 km s-1. The correlation between the metallicity gradient and the central age has been previously found by Sánchez-Blázquez et al. (2006c) (although the methodology is very different to this work and the correlation is only found when the metallicity is measured with some indicators). As we did before, we checked the possibility that the correlation was artificial, due to the correlation of the errors. To do that we plotted the metallicity gradients against the completely independent ages extracted from the Terlevich & Forbes (2000) catalogue. This can be seen in Fig. 14. It is clear, as before, that the correlation is not an exclusive consequence of the correlation of the errors.


Finally, we study the relation between the metallicity gradient and the rotation of the galaxies and the shape of their isophotes. The decreasing rotational support and transition from discy to boxy isophotal shapes with increasing stellar mass in elliptical galaxies suggests an increasing fraction of dissipationless mergers in the growth of the most massive elliptical galaxies (e.g. Bender et al. 1992; Kormendy & Bender 1996; Faber et al. 1997; Naab, Khochfar & Burkert 2006). Fig. 15 shows the relation between the metallicity gradient and the anisotropy parameter ((/)*) as defined in Bender (1990) normalized by the value expected for an isotropic oblate galaxy flattened by rotation. To derive this parameter we followed the procedure described in Pedraz et al. (2002). A conservative estimate of the maximum rotation velocity () was computed as the error-weighted mean of the two data pairs with the highest rotational velocities. To compute the mean velocity dispersion we co-added all the individual spectra with radii between the seeing limit and the effective radius. Prior to this, we shifted all the spectra to rest-frame using the rotation curves. The final values for the sample of galaxies presented here are listed in Table 1. A non-parametric Spearman rank-order test gives a significant correlation with a level of significance lower than 0.05. However, we are aware that this correlation is driven mainly by two galaxies (NGC 1600 and NGC 2865) and that larger samples would be necessary to confirm its existence.


Fig. 16 shows the relation between the metallicity gradient and the parameter (a4/a) 100, which measured the deviation of the shape of the isophotes from a perfect ellipse. Positive values of a4 indicate discy isophotes while a40 indicates that the isophotes have a boxy shape. Most of the values were taken from Bender et al. (1989), who defined this parameter as the peak value of a4/a in the case of peaked profiles and the value at 1 effective radius in the case of monotonically increasing or decreasing profiles. For the galaxy NGC 2865, the value was extracted from Reda et al. (2004). We could not find references (measured in the same way) for three of our galaxies: NGC 3384, NGC 4458 and NGC 4464 and, therefore, they are not included in the Figure. For the rest of the galaxies, there exists a strong correlation between grad[Z/H] and (a4/a)100. Discy galaxies show stronger gradients and the strength of the gradient gets lower with the boxiness of the isophotes. This strong correlation is surprising as the a4 parameter measured in simulated galaxies depends on the projection effects, and therefore, the same galaxy can have boxy and discy isophotes depending of the viewing angle (Stiavelli, Londrillo & Messina 1991; Governato, Reduzzi & Rampazzo 1993; Governato et al. 1993; Heyl, Hernquist & Spergel 1994; Lima-Neto & Combes 1995; Gibson et al. 2006). Bekki & Shioya (1997) performed numerical simulations of mergers between gas-rich galaxies, studying the effect of star formation on the structural parameters of the remnant. They found that the rapidity of gas consumption by star formation greatly affects the isophotal shape of the merger remnant. Mergers with gradual star formation are more likely to form elliptical galaxies with discy isophotes, while those where the star formation is more rapid are more likely to form boxy ellipticals (although this depends on the viewing angle and, therefore, these scenario can lead to galaxies that can be seen as discy too). This scenario could explain the relation between the metallicity gradient and the shape of the isophotes found here. Furthermore, if the metallicity gradients are correlated with the shape of the isophotes and also with the central values of age and metallicity, this implies that the young ages observed in many early-type galaxies are not the consequence of a frosting population that form, for example, due to the accretion of small galaxies, but that the physical process that produced the recent star formation is related with the process shaping the gradients in the galaxies. This could happen, for example, in a scenario of mergers between galaxies.
7.3 Chemical abundances gradients
The chemical abundance ratios variations with radius give information about the time-scales of the star formation within the galaxies444This is true if we assume that there is not variations of the IMF along the radius and that the feedback processes blow away all the elements with the same efficiency.. Fig. 6 shows the [E/Fe] gradients for our sample of galaxies. As can be seen in the figure, galaxies show a broad variety in the slope of the [E/Fe] profiles. In particular, contrary to what it would be expected by models of dissipative collapse, some of the galaxies show negative [E/Fe] gradients, indicating, if interpreted assuming a single episode of star formation, more extended star formation histories in the external parts.
Several theoretical works have studied the [Mg/Fe] gradients using chemical and cosmological chemodynamical evolution cores. Martinelli et al. (1998) and Pipino, Matteucci & Chiappini (2006) modeled the scenario suggested by Franx & Illingworth (1990) where metallicity gradients are the consequence of the time delay in the development of galactic winds between the central and external parts of the galaxies. In this scenario stars in the outermost regions form earlier and faster than the ones in the centre and, therefore, a natural outcome from this model is an increase of the [Mg/Fe] ratio with radius. In particular, the recent work by Pipino et al. (2006) predicts a value of grad[E/Fe]+0.2-0.3 dex, which reproduces the observations by Mendez et al. (2005) but it is steeper than any of the gradients measured here. In this scenario, the duration of the star formation is the only parameter controlling the local metallicity. Therefore, we would expect to find a correlation between the [Z/H] and the [E/Fe] gradients (under the assumption that [E/Fe] is a good measure of the time-scales of the star formation). 555Other scenarios can produce differences in the [E/Fe] ratio, as differences in the initial mass function or selective loss of gas. See, e.g. Faber et al. 1992, Worthey 1998; Trager et al. 2000b for details. Fig. 17 shows the relation between both gradients. As can be seen, we do not detect any significant correlation in our sample of galaxies; a non-Spearman rank order coefficient shows a probability of correlation lower than 40 per cent.
On the other hand, cosmological and semi-cosmological chemodynamical simulations by Gibson et al. (2007) and Kobayashi (2004) respectively predict slightly shallower values, although still steeper than the values obtained here. In particular, Gibson et al. (2007) quoted, for a galaxy with 250 km s-1 a value of grad[E/Fe]=+0.1, while Kobayashi (2004) gives mean values of grad[E/Fe]=+0.15 and +0.2 for non-major mergers and major mergers galaxies respectively.
There have been two previous studies presenting [E/Fe] gradients with high quality data in two individual galaxies. Mendez et al. (2005) found a positive gradient in the galaxy NGC 4697 which was reproduced by above quoted models of Pipino et al. (2006), and Proctor et al. (2005) analysed the gradient of the galaxy NGC 821, which showed a young population in its centre, finding a [E/Fe] gradient compatible with being zero or slightly negative. However, these authors claimed that, if, as happens in the solar neighborhood, oxygen does not track Mg in early-type galaxies, then the derived [E/Fe] could turn out to be positive.
Also Mehlert et al. (2003) derived [E/Fe] gradients for a sample of 35 early-type galaxies in the Coma cluster. They obtained a mean value of 0.05 0.05 dex, and the deviation from the mean for all their objects can be explained by the errors alone. Therefore, they concluded that early-type galaxies show /Fe gradients consistent with zero. This does not exclude, however, the presence of negative /Fe gradients for some of the galaxies of their sample. In any case, the quality of this sample of gradients is not as high as the one in the other aforementioned studies. These authors also analysed the relation between the gradients of metallicity and [E/Fe] without finding any significant correlation.

In order to study whether galaxies with positive and negative [E/Fe] gradients are intrinsically different, we have analysed the relations between the slope of the gradient and other parameters of the galaxies. Fig. 18 shows the relation between the [E/Fe] gradients and the central velocity dispersion. A non-parametric rank-order Spearman test gives a non-significant correlation, although galaxies with negative gradients of [E/Fe] tend to be in the low mass end of our sample.

We showed earlier in this section that there exists a correlation between the [Z/H] gradient and the central value of [Z/H]. In Fig. 19 we check the same relation for the values of [E/Fe]. With different symbols galaxies with power-law (stars) and core (circles) inner profiles are represented. This cut also corresponds to a cut in the central at 200 km s-1. As can be seen, there is a correlation between the central value of and the gradients in [E/Fe], but there seems to exist a dichotomy between galaxies with core (or galaxies with km s-1 in our sample) and power-law (all galaxies with km s-1 in our sample) inner profiles. For galaxies with a power-law inner profile we found a clear correlation between the central value and the gradient of the [E/Fe], while galaxies with a core profile lie above the relation. This different relation may be indicating fundamental differences in the formation processes of galaxies with lower and above 200 km s-1. This value could mark the transition between wet and dry mergers (Faber et al. 2005), and its physical motivation may be related to the thermal properties of inflowing gas in these galaxies and their interplay with feedback processes (Binney 2004; Dekel & Birnboim 2006). The transition between the cold flows and hot flows can be very sharp, especially if feedback from active galaxy nuclei is included.
When this mechanism is introduced in cosmological models of galaxy formation, most massive galaxies form their stars at high redshift and in very short time-scales and then have assembled later mainly through dry-mergers (Cattaneo et al. 2006). This scenario can also explain the preferentially boxy isophotes of these systems, their lower rotation and their older stellar populations. If confirmed, it also supports the idea of biased merging, for which more massive galaxies merge, preferentially , with other massive galaxies, as predicted in the hierarchical models of galaxy formation (e.g. Kauffmann & Charlot 1998) and also supported in the relation of the metal poor globular-cluster colors and the galaxy luminosity (Brodie & Strader 2006).

We explore now the correlation between the [E/Fe] gradient and the a4 parameter, which measures the degree of boxiness or disciness of the isophote shapes. As can be seen in Fig. 20, the correlation is not as clear as in the case of the [Z/H] gradient. If we exclude the galaxy NGC 2865 there is perhaps a trend for which galaxies with a more positive a4 show, also, a steeper, negative [E/Fe] gradient, but, clearly, NGC 2865 does not fit into this trend. This may represent a temporal state, as this galaxy shows a very young population in its centre (this galaxy also deviates from the Mgb- relation), but we cannot conclude anything without a larger sample.

Finally, we analyse the relation between the [E/Fe] gradient and the anisotropy parameter as we did in Sec. 7.2. Fig. 21 shows this relation. Contrary to that seen with the metallicity gradient, there is no significant correlation between these two parameters for the whole sample. But if we eliminate the two most extreme galaxies (NGC 1600 and NGC 2865) a non-parametric rank-order test gives a probability of no correlation lower than 1 per cent.

8 Relation between the local stellar population parameters and the local velocity dispersion
If galactic winds were the only mechanism responsible for the presence of metallicity gradients we might expect to find a correlation between the local metallicity and the local potential well, and between the metallicity and the [E/Fe] gradient. We showed in Sec. 7 that the latter is not present in our sample, but several authors have found correlations between the colors and metallicity gradients, and the local potential gradient, parametrized either using the escape velocity (Franx & Illingworth 1990, Davies et al. 1993) or the velocity dispersion (Mehlert et al. 2003). It is interesting to check if this correlation is present in our sample.
Fig. 22 shows the relation between [Z/H] at different galactocentric distances versus the velocity dispersion measured at the same location. To study the degree of correlation we performed a non-parametric Spearman-rank test. Table 6 shows the results of this test. Statistically significant correlations are marked with an asterisk. We have also drawn the result of a unweighted linear-fit between the two parameters.
| Galaxy | ||
|---|---|---|
| NGC 1600 | 5.3 | * |
| NGC 1700 | ||
| NGC 2865 | ||
| NGC 3377 | * | |
| NGC 3379 | * | |
| NGC 3384 | * | |
| NGC 4387 | ||
| NGC 4458 | ||
| NGC 4464 | * | |
| NGC 4472 | * | |
| NGC 4551 | * |


We do not find a strong correlation between the local metallicity and the local for all the galaxies in the sample. However, we do find correlations for 7 out of 11 galaxies.
The correlation between the local metallicity and local arises naturally in a scenario where the star formation proceeds until the energy release by the supernova overcomes the binding energy and then the gas is expelled from the galaxy preventing more star formation. As pointed out by Franx & Illingworth (1990), dissipative models with inward flows of pre-enriched gas would in principle, tend to destroy the correlation. However, Davies et al. (1993) also showed that due to anisotropy and rotation effects, the velocity dispersion is a poor indicator of the escape velocity, which could be also the reason for the lack of correlation in some of our galaxies.
9 Discussion
Although almost all galaxies show radial abundance gradients, the origin remains a matter of debate. A radial variation of star formation rate (SFR), or the existence of radial gas flows, or a combination of these processes, can lead to abundance gradients in discs (e.g. Lacey & Fall 1985; Koeppen 1994; Edmunds & Greenhow 1995; Tsujimoto et al. 1995; Chiappini, Matteucci & Gratton 1997). Mergers are more complicated, because they depend on several parameters as the mass fractions of the systems merging, the amount of dissipation and possible associated star formation. However, under different scenarios we would expect differences in the strength of the gradients and in their relationship with other global galaxy parameters.
We have found, in the present paper, that early-type galaxies show null or very shallow age gradients, negative metallicity gradients, ranging from gradZ/H to dex, and both, positive and negative, but very shallow, [E/Fe] gradients (from to dex). The existence of both, positive and negative [E/Fe] gradients rule out simple outside-in scenarios where the gradient is an exclusive consequence of the delayed onset of the galactic winds in the central parts as suggested in some studies (e.g., Franx & Illingworth 1990; Martinelli et al. 1998; Pipino et al. 2006). This is also confirmed by the lack of correlation between [Z/H] and [E/Fe] gradients.
In the present paper, we have found a correlation between the metallicity gradient and both the shape of the isophotes, and the degree of rotational support. These trends are difficult to explain in monolithic scenarios of galaxy formation, but are well explained in scenarios of mergers where the degree of dissipation decrease with the mass. In this context, and assuming that the interaction triggers star formation in the centre of the remnant, the strength and the rapidity of the central burst (in general, the degree of dissipation during the interaction) would determine the shape of the isophotes (a4 becomes larger with the degree of dissipation, or with less efficient star formation), the central value of [E/Fe] (also higher for more efficient star formation) and the strength of the [Z/H] and [E/Fe] gradients – the later could become negative if the gas is transformed into stars very efficiently in very short time-scales (see Thomas et al. 1999).
The transition between mergers with gas and completely dissipationless mergers is believed to occur at a critical stellar mass of 31010M☉, which is the mass separating the red and blue sequence of galaxies (Kauffmann et al. 2003) in the color-magnitude diagram. This mass corresponds roughly to the mass of the galaxies showing stronger gradients (Vader 1988; Kormendy & Djorgovski 1989; this study). The dichotomy observed in the grad[E/Fe]-central [E/Fe] plane suggests that the transition is not gradual. In order to explain the existence of red and blue sequences in the colour-magnitude diagram of galaxies (Kauffmann et al. 2003), cosmological simulations also need to introduce a mechanism that sharply terminates the star formation in galaxies with stellar masses M10 M☉. Feedback from active galactic nuclei (AGNs) is the most promising candidate for this extra source of heating (Tabor & Binney 1993; Tucker & David 1997; Granato et al. 2004; Di Matteo, Springel & Hernquist 2005; Kawata & Gibson 2005).
We have also find, in the present study, a correlation between the metallicity gradient and both the central values of age (for galaxies younger than 10 Gyr) and metallicity. We have shown that these correlations are not entirely due to the correlation of the errors. If we assume, as suggested above, that abundance gradients are modified by the occurrence of major mergers, the fact that these gradients are correlated with the central values, and with structural parameters as the shape of the isophotes, suggests that the young population found in the centre of some of our galaxies is the consequence of star formation triggered during major mergers.
This scenario, however, is not free from problems. Thomas et al. (1999) and Pipino & Matteucci (2004) have shown that is difficult to reach the high values of [Mg/Fe] in the centres of elliptical galaxies when massive secondary bursts of star formation are superimposed on an old population, if the new stars form from gas with abundances matching the ones of present day spiral galaxies, unless those stars form with an IMF flatter than that of the Salpeter (1955). These studies are potentially useful to constraint the amount of new stars that can be formed under this scenario. In a following paper, we will present this information and test the viability of this scenario from the chemical point of view.
The absence of age gradients in most of the galaxies also constraints the amount of new stars that can be formed in these episodes. However, due to the age-metallicity degeneracy, a burst of star formation older than 2 Gyr and more metal rich than the underlying population may produce very flat gradients in H and stronger differences in the metallic indices. For example, the difference between two single stellar populations with ages 5 and 12 Gyr, metallicities and and the same [E/Fe] would be, Å in H, 1.2Å in Mgb and 4.1Å in C4668 which is compatible with the differences between the indices in the centre and at one effective radius for the galaxy NGC 3384, which shows a null age gradient.
The amount of gas present during the interaction to produce the observed trends and properties of the less massive galaxies does not need to be large. Numerical simulations of mergers of disc galaxies with a gas fraction for the progenitor galaxies of only 10 per cent can reproduce the kinematical and photometric properties of intermediate mass ellipticals (Jesseit et al. 2006). This is approximately the mass fraction of gas remaining in a galaxy at z0.6 before experiencing its last major merger in the cosmological simulations by Meza et al. (2003).
10 Summary
We present measurements of stellar population parameter gradients with unprecedented quality for a sample of 11 early-type galaxies in the field and the Virgo cluster.
For most of the galaxies in our sample we find null or shallow age gradients, negative [Z/H] gradients ranging from ( and ) and both, negative and positive, although shallow, [E/Fe] gradients.
We do not find any strong correlation between the metallicity gradient and the central velocity dispersion of the galaxies. Galaxies with stronger metallicity gradients are those with km s-1. For galaxies with below this limit there is a relation for which more massive galaxies show steeper metallicity gradients. This trend seems to change at km s-1, as previously noted by other authors (e.g. Vader 1998; Peletier et al. 1990), although we do not have enough galaxies with above this limit to confirm the result.
We found that metallicity gradient correlates with both central metallicity and central age, although the correlation with the central age is only visible for galaxies with mean ages below 10 Gyr. Galaxies with a younger central equivalent-SSP age show also steeper metallicity gradients and higher central metallicity.
Both, [Z/H] and [E/Fe] gradients show strong correlations with the shape of the isophotes. The shape of the isophotes in a merger can be determined by the degree of dissipation during the interaction (e.g., Bekki & Shioya 1997). [Z/H] gradients do not correlate with [E/Fe] gradients, which challenges the scenario where the local potential-well is the only responsible agent for the presence of gradients in early-type galaxies.
[E/Fe] gradients show a correlation with the central values of [E/Fe], but two different sequences are defined for galaxies with central less and greater than 200 km s-1. Most massive galaxies show a higher central [E/Fe] for a given [E/Fe] gradient than less massive ones.
In general, the presented gradients and their correlation with other parameters are compatible with a scenario where elliptical galaxies formed through the merger of smaller structures and the relative amount of dissipation experienced by the baryonic mass component along ellipticals stellar mass assembly decreases with increasing galaxy mass. However, two results, the trend between the metallicity gradients and the central and the relation between the gradient and central [E/Fe], suggests that this transition is not gradual but there is a sharp change in the properties of galaxies above and below km s-1.
Although the quality of the gradients analysed here is very high, the sample is not very large. Therefore, the conclusions presented in this paper will need to be confirmed with larger samples.
Acknowledgments
The authors wish to recognize and acknowledge the very significant cultural role and reverence that the summit of Mauna Kea has always had within the indigenous Hawaiian community. We are most fortunate to have the opportunity to conduct observations from this mountain. It is a pleasure to thank Harald Kuntschner for kindly provide us with the index gradients extracted from the SAURON data simulation the same angle for the position of the slit. PSB thanks Cristina Chiappini, George Djorgovski and Daisuke Kawata for very fruitful discussions. Daisuke Kawata is also thanked for computing for us predictions of metallicity gradients for galaxies with different masses. We also thanks to the referee, Francesco La Barbera for his very constructive report, which has help to greatly improve the final version of the manuscript. PSB also thanks Brad Gibson for his continuing support. GANDALF was developed by the SAURON team and is available from the SAURON website (www.strw.leidenuniv.nl/sauron). This research was supported by a Marie Curie Intra-European Fellowship within the 6th European Community Framework Programme. DAF acknowledges the financial support of the Australian Research Council throughout the course of this work. This work was supported by NSF grant number 0507729.
References
- Angeletti (03) Angeletti L., Giannone P., 2003, A&A, 403, 449
- Arimoto & Yoshi (1987) Arimoto N., Yoshii Y., 1987, 173, 23
- Barnes & Hernquist (1991) Barnes J.E, Hernquist L.E., 1991, ApJ, 370, 65
- Beasley (2002) Beasley M.A., Sharples R.M., Bridges T.J., Hanes D.A., Zept S.E., Ashman K.M., Geisler D., 2002, in Extragalactic Globular Clusters, IAU 207, Ed., D. Geisler, E.K Grebel, and D. Minniti
- Bekki & Shioya (1997) Bekki K., Shioya Y.,1997, ApJ, 478, 17
- Bekki & Shioya (1998) Bekki K., Shioya, Y., 1998, ApJ, 497, 108
- Bekki & Shioya (1999) Bekki K., Shioya Y., 1999, ApJ, 513, 108
- Bell (2004) Bell E.F. et al., 2004, ApJ, 608, 752
- Bell et al. (2006) Bell E.F. et al., 2006, ApJ, 640, 241
- Bender (1990) Bender R., 1990, A&A, 229, 441
- Bender & Surma (1995) Bender R., Surma P., 1995, A&A, 258, 250
- Bender et al. (1992) Bender R., Burstein D., Faber S.M., 1992, ApJ, 399, 462
- Bender et al. (1989) Bender R., Surma P., Doebereiner S., Moellenhoff C., Madejsky R., 1989, A&A, 217, 35
- Bendo & Barnes (2000) Bendo G.J., Barnes J.E., 2000, MNRAS, 316, 315
- Bernardi et al. (2006) Bernardi M., Nichol R.C., Shet R.K., Miller C.J., Brinkmann J., 2006, ApJ, 131, 3
- Biller (2004) Biller B.A, Jones C., Forman W.R., Kraft R., Ensslin, T., 2004, ApJ, 613, 238
- Binney (2004) Binney J., 2004, MNRAS, 347, 1093
- Brodie & Strader (2006) Brodie J.P., Strader J., 2006, ARA&A, 44, 193
- Brown (2000) Brown R.J.N., Forbes D., Kissler-Patig M., Brodie J.P., 2000, MNRAS, 317, 406
- Bruzual (1993) Bruzual G., 1983, ApJ, 273, 105
- Busarello et al. (1996) Busarello G., Capaccioli M., D’Onofrio M., Longo G., Richter G., Zaggia S., 1996, A&A, 314, 32
- Burstein et al. (1987) Burstein D., Davies R.L., Dressler A., Faber S.M., Stone R.P.S., Lynden-Bell D., Terlevich R.J., Wegner G., 1987, ApJS, 64, 601
- Caldwell (2003) Caldwell N., Rose J.A., Concannon K.D., 2003, AJ, 125, 2891
- Cardiel (1999) Cardiel N., 1999, PhD Thesis, Universidad Complutense de Madrid
- Cardiel et al. (1995) Cardiel N., Gorgas J., Aragón-Salamanca A., 1995, MNRAS, 277, 502
- Carlberg (1984) Carlberg, R.G., 1984, ApJ, 286, 403
- Carollo (1993) Carollo C.M., Dazinger I.J., Buson L., 1993, MNRAS, 265, 553
- Chiappini (1997) Chiappini C., Matteucci F., Gratton R., 1997, ApJ, 477, 765
- Chiappini et al. (2001) Chiappini C., Matteucci F., Romano D., 2001, ApJ, 554, 1044
- Cimatti (2005) Cimatti A., Daddi E., Renzini A., 2006, A&A, 453, 29
- Cohen (1979) Cohen, J.G., 1979, ApJ, 228, 405
- Cole (2000) Cole S., Lacey C.G., Baugh C.M., Frenk C.S., 2000, MNRAS, 319, 168
- Davidge (1991) Davidge T.J., 1991, AJ, 102, 896
- Davidge (1992) Davidge T.J., 1992, 103, 1512
- Davies et al. (1993) Davies R.L., Sadler E.M., Peletier R.F., 1993, MNRAS, 262, 650
- Dekel & Birnboim (2006) ekel A., Birnboim Y., 2006, MNRAS, 368, 2
- Dekel & Cox (2006) Dekel A., Cox T.J., 2006, MNRAS, 370, 1445
- de Lucia (2006) de Lucia G., Springel V., White S.D.M., Croton D., Kauffmann G., 2006, MNRAS, 366, 499
- Denicolo et al. (2005) Denicoló G., Terlevich R., Terlevich E., Forbes D.A., Terlevich A., 2005, MNRAS, 358, 813
- de Propris et al. (2005) De Propris R., Colless M., Driver S. P., Pracy M.B., Couch W. J.. 2005, MNRAS, 357, 590
- Di Matteo (2005) Di Matteo T., Springel V., Hernquist L., 2005, Nat, 433, 604
- di Serego (2005) di Serego Alighieri, Vernet J., Cimatti A., Lanzoni B., Cassata P., Ciotti L., Daddi E., Mignoli M., Pignatelli E., Pozzetti L., et al., 2005, A&A, 442, 125
- Edmunds (1995) Edmunds M.G., Greenhow R.M., 1995, MNRAS, 272, 241
- Eggen et al. (1962) Eggen O.J., Lynden-Bell D., Sandage A.R., 1962, ApJ, 136, 748
- Emsellem et al. (2004) Emsellem E., Capellari M., Peletier R.F., McDermid R.M., Bacon R., Bureau M., Copin Y., Davies R.L., Krajnovic D., Kuntschner H., et al. 2004, MNRAS, 352, 721
- Faber (1992) Faber S.M., Worthey G., González J.J., 1992, Beatriz Barbuy, Alvio Renzini, eds., Proc. IAU Symp. 149, The Stellar Populations of Galaxies. Kluwer Academic Publishers, Dordrecht, p. 255
- Faber et al. (1997) Faber S.M. et al., 1997, AJ, 114, 1771
- Faber et al. (2005) Faber S.M. et al., 2005, preprint (astro-ph/0506044)
- Ferreras (1999) Ferreras I., Charlot S., Silk J., 1999, ApJ, 521, 81
- Fisher, Franx, & Illingworth (1995) Fisher D., Franx M., Illingworth G., 1995, ApJ, 448, 119
- Fisher (1996) Fisher D., Franx M., Illingworth G., 1996, ApJ, 459, 110
- Franx (1988) Franx M., 1988, PhD Thesis, Rijksuniversiteit
- Franx & Illingworth (1988) Franx M., Illingworth G.D., 1988, ApJ, 327, 55
- Franx & Illingworth (1990) Franx M., Illingworth G., 1990, ApJ, 1990, 359, 41
- Franx et al. 1989 (F89) Franx M., Illingworth G., Heckman T., 1989, AJ, 98, 538
- Fritz (2005) Fritz A., Ziegler B.L., Bower R.G., Smail I., Davies R.L., 2005, MNRAS, 358, 233
- Garcia (1993) García A.M., ,1993, A&AS, 100, 47
- Gebhardt et al. (2000) Gebhardt K. et al. , 2000, AJ, 119, 1157
- Gebhardt et al. (2003) Gebhardt K., et al., 2003, ApJ, 597, 239
- Gibson (1997) Gibson B.K., 1997, MNRAS, 290, 471 ¿
- Gibson et al. (2007) Gibson B.K., Sánchez-Blázquez, P., Courty, S., Kawata, D., 2007, preprint (astro-ph/0611086)
- Gonzalez (1993) González J.J., 1993, PhD Thesis, University of Santa Cruz
- Gonzalez & Gorgas (1995) González J.J., Gorgas J., 1995, in Buzzoni A., Renzini A.,Serrano A., eds, ASP Conf. Ser. Vol. 86, Fresh Views of elliptical galaxies, Astron. Soc. Pac., San Francisco, p.225
- Gorgas et al. (1990) Gorgas J., Efstathiou G., Aragón-Salamanca A., 1990, MNRAS, 245, 217
- Gorgas et al. (1993) Gorgas J., Faber S.M., Burstein D., Gonzalez J.J., Courteau S., Prosser C., 1993, ApJS, 86, 153
- Governato et al. (1993) Governato F., Reduzzi L., Rampazzo R., 1993, MNRAS, 261, 379
- Granato et al. (2004) Granato G.L., de Zotti G., Silva L., Bressan A., Danese L., 2004, ApJ, 600, 580
- Halliday et al. (2001) Halliday C., Davies R.L., Kuntschner H., Birkinshaw M., Bender R., Saglia R.P., Baggley G., 2001, MNRAS, 326, 473
- Hau et al. 1999 (H99) Hau,G.K.T., Carter D., Balcells M., 1999, MNRAS, 306, 437
- Heyl et al. (1994) Heyl J.S., Hernquist L., Spergel D.N., 1994, ApJ, 427, 165
- Hernquist & Barnes (1991) Hernquist L., Barnes J.E., 1991, Nat, 254, 210
- Hinkley & Im (2001) Hinkley S., Im, M., 2001, ApJ, 560, 41
- Holden (2005) Holden B.P. et al., 2005, ApJ, 626, 809
- Hou et al (2000) Hou J.L., Prantzos N., Boissier S., 2000, A&A, 362, 921
- Houdashelt et al. (2002) Houdashelt M.L., Trager S.C., Worthey G., Bell R.A., 2002, AAS, 201, 1405
- Idiart et al. (2002) Idiart T. P., Michard R., de Freitas Pacheco J. A, 2002, A&A, 383, 30
- Jesseit et al. (2006) Jesseit R., Naab T., Peletier R., Burkert A., 2006, preprint (astro-ph/0606144)
- Jorgensen (1999) Jørgensen I., 1999, MNRAS, 306, 607
- Kauffmann & Charlot (1998) Kauffmann G., Charlot S., 1998, MNRAS, 294, 705
- Kauffmann & Haehnelt (2000) Kauffmann G., Haehnelt M., 2000, MNRAS, 311, 576
- Kawata & Gibson (2005) Kawata D., Gibson B., 2005, 358, 16
- Kelson et al. (2000) Kelson D., Illingworth G.D., van Dokkum P.G., Franx M., 2000, ApJ, 531 194
- Kelson et al. (2006) Kelson D., Illingworth G.D., Franx M., van Dokkum P.G., 2006, ApJ, 653, 159
- Khochfar (2003) Khochfar S., Burkert A., 2003, ApJ, 597, 117
- Kobayashi (2004) Kobayashi C., 2004, MNRAS, 347, 740
- Kobayashi & Arimoto (1999) Kobayashi C., Arimoto N., 1999, ApJ, 527, 573
- Kodama & Arimoto (1997) Kodama T., Arimoto N., 1997, A&A, 320, 41
- Koeppen (1994) Koeppen J., 1994, A&A 291, 26
- Kormendy (1984) ] Kormendy J., 1984, ApJ, 287, 577
- Kormendy & Bender (1996) Kormendy J.,Bender R., 1996, 464, 119
- Kormendy & Djorgovski (1989) Kormendy J., Djorgovski S., 1989, ARA&A, 27, 235
- Korn (2005) Korn A.J., Maraston C., Thomas D., 2005, A&A, 438, 685
- Kuntschner (2000) Kuntschner H., 2000, MNRAS, 315, 184
- Kuntschner et al. (2006) Kuntschner H. et al., 2006, MNRAS, 369, 497
- LaBarbera (2004) La Barbera F., Merluzzi P., Busarello G., Massarotti M., Mercurio A., 2004, A&A, 425, 797
- LaBarbera (2005) La Barbera F., de Carvalho R.R., Cal R.R., Busarello G., Merluzzi P., Capaccioli M., Djorgovski S.G., 2005, ApJ, 626, 19
- Lacey (1985) Lacey C.G., Fall S.M., 1985, ApJ, 290, 154
- Larson (1974) Larson R.B., 1974a, MNRAS, 166, 585
- Larson (1974) Larson R.B., 1974b, MNRAS, 169, 229
- Larson (1975) Larson R.B., 1975, MNRAS, 173, 671
- Lauer et al. (1995) Lauer T.R. et al., 1995, AJ, 110, 2622
- Lecureur et al. (2007) Lecureur A., Hill V., Zoccali M., Barbuy B., Gómez A., Minniti D., Ortolani S., Renzini A., 2007, preprint (astro-ph/0610346)
- Lauer et al. (2005) Lauer T.R. et al., 2005, AJ, 129,2138
- Lima-Neto & Combes (1995) Lima-Neto G.B., Combes F., 1995, A&A, 294, 657
- Macchetto et al. (1996) Macchetto F., Pastoriza M., Caon N., Sparks W.B., Giavalisco M., Bender R., Capaccioli M., 1996, A&AS, 120, 463
- Mathews & Barker (1971) Mathews W.G., Baker J.C., 1971, ApJ, 170,241
- Martinelli (1998) Martinelli A., Matteucci F., Colafrancesco S., 1998, MNRAS, 298, 42
- Matteucci et al (1998) Matteucci F., Francois P., 1998, 239, 885
- Matthias & Gerhard (1999) Matthias M., Gerhard O., 1999, MNRAS, 310, 879
- Mehlert et al. (2003) Mehlert D., Thomas D., Saglia R.P., Bender R., Wegner G., 2003, A&A, 407, 423
- Menanteau et al. (2004) Menanteau F. et al. 2004, ApJ, 612, 2002
- Mendez et al. (2005) Méndez R.H., Thomas D., Saglia R.P., Maraston C., Kudritzki R.P., Bender R., 2005, ApJ, 627, 767
- Meza et al. (2003) Meza A., Navarro J.F., Steinmetz M., Eke V.R., 2003, ApJ, 590, 619
- Michard (1985) Michard R., 1985, A&AS, 59, 205
- Michard (2005) Michard R., A&A, 2005, 429, 819
- Michard & Prugniel (2004) Michard R., Prugniel P., 2004, A&A, 423, 833
- Mihos & Hernquist (1994) Mihos J.C., Hernquist L., 1994, ApJ, 437, 47
- Morelli et al. (2004) Morelli L. et al., 2004, MNRAS, 354, 753
- Naab et al. (2006) Naab T., Jesseit R., Burkert A., 2006a, 372, 839
- Naab et al. (2006) Naab T., Khochfar S., Burkert A., 2006b, ApJ, 636, L81
- Nelan (2005) Nelan J.E., Smith R.J., Hudson M., Wegner G.A., Lucey J.R., Moore S.A.W., Quinney S.J., Suntzeff N.B., 2005, ApJ, 632, 137
- Ocvirk et al. (2006) Ocvirk P., Pichon C., Lano̧n A., Thiébaut E., 2006a, MNRAS, 365, 46
- Ocvirk et al. (2006) Ocvirk P., Pichon C., Lano̧n A., Thiébaut E., 2006b, MNRAS, 365, 74
- Oke et al. (1995) Oke J.B., Cohen J.G., Carr M., Cromer J., Dingizian A., Harris F.H., Labrecque S., Lucinio R., Schaal W., Epps H., Miller J., 1995, PASP, 107, 375
- Oñorbe et al. (2005) Oñorbe J., Domínguez-Tenreiro R., Sáiz A., Serna A., Artal H., 2005, ApJ, 632, 57
- Panter et al. (2003) Panter B., Heavens A.F., Jimenez R., 2003, MNRAS, 343, 1145
- Pedraz et al. (2002) Pedraz S., Gorgas J., Cardiel N., Sánchez-Blázquez P., Guzmán R., 2002, MNRAS, 332, 59
- Peletier et al. (1989) Peletier R.F., Lauberts A., Valentijn E.A., 1989, A&AS, 77, 339
- Peletier et al. (1990) Peletier R.F., Davies R.L., Illingworth G.D., Davies R.L., Illingworth G.D., Davis L.E., Cawson M., 1990, AJ, 100, 1091
- Pierce et al. (2006) Pierce M. et al., 2006, MNRAS, 366, 1253
- Pinkney et al. (2003) Pinkney J. et al., 2003, ApJ, 596, 903
- Pipino & Matteucci (2006) Pipino A., Matteucci F., 2006, MNRAS, 365, 1114
- Pipino et al. 2006 (2006) Pipino A., Matteucci F., Chiappini C., 2006, ApJ, 638, 739
- Proctor & Sanson (2002) Proctor R.N., Sansom A.E., 2002, 333, 517
- Proctor et al. (2004a) Proctor R.N., Forbes D.A., Beasley M.A., 2004a, MNRAS, 355, 1327
- Proctor et al. (2004b) Proctor R.N., Forbes D.A., Hau G.K.T., Beasley M.A., De Silva G.M., Contreras R., Terlevich A.I., 2004b, MNRAS, 349, 1381
- Proctor et al. (2005) Proctor R.N., Forbes D.A., Forestell A., Gebhardt K., 2005, MNRAS, 362, 857
- Prugniel et al. (1987) Prugniel P., Nieto J.-L., Simien F., 1987, A&A, 173, 49
- Ravindranath et al. (2001b) Ravindranath S., Ho L.C., Peng C.Y., Filippenko A.V., Sargent W.L.W., 2001, AJ, 122, 653
- Reda et al. (2004) Reda F., Forbes, A.F., Beasley M.A., O’Sullivan E.J., Goudfrooij P., 2004, MNRAS, 354, 851
- Rest et al. (2001) Rest A., van den Bosch F.C., Jaffe W., Tran H., Tsvetanov Z., Ford H.C., Davies J., Scafer J., 2001, AJ, 121, 2431
- Saglia et al. (2000) Saglia R.P., Maraston C., Greggio L., Bender R., Ziegler B., 2000, A&A, 360, 911
- Salpeter (1955) Salpeter E.E., 1955, ApJ, 121, 161
- Sanchez-Blazquez et al. (2004) Sánchez-Blázquez P., 2004, PhD Thesis, Universidad Complutense de Madrid
- Sanchez-Blazquez et al. (2006) Sánchez-Blázquez P., Gorgas J., Cardiel N., 2006c, A&A, 457, 823
- Sanchez-Blazquez et al. (2006) Sánchez-Blázquez P., Gorgas J., Cardiel N., González J.J., 2006a, A&A, 457, 787
- Sanchez-Blazquez et al. (2006) Sánchez-Blázquez P., Gorgas J., Cardiel N., González J.J., 2006b, A&A, 457, 809
- Sanchez-Blazquez et al. (2006) Sánchez-Blázquez P., Peletier R.F., Jiménez-Vicente J., Cardiel N., Cenarro A.J., Falcón-Barroso J., Gorgas J., Selam S., Vazdekis A., 2006d, MNRAS, 371, 703
- Sargent et al. (1977) Sargent, W.L., Schechter, P.L., Boksenberg, A., Shortridge, K., 1977, ApJ, 212, 326
- Sarzi et al. (2006) Sarzi et al., 2006, MNRAS, 366, 1151
- Savage & Mathis (1979) Savage B.D., Mathis J.S., 1979, ARA&A 17,73
- Schawinski et al (2006) Schawinski K. et al., 2006, Nat, 442, 888
- Schweizer & Seitzer (1992) Schweizer, F., Seitzer P., 1992, AJ, 104, 1039
- Schiavon et al. (2006) Schiavon R.P., 2006, preprint (astro-ph/0611464)
- Sil’chenko et al. (2003) Sil’chenko O.K., Moiseev A.V., Afanasiev V.L., Chavushyan V.H., Valdes J.R., 2003, ApJ, 591,185
- Silva & Elston (1994) Silva D.R., Elston R., 1994, ApJ, 428, 511
- Silva & Bothun (1998) Silva D.R., Bothun G.D., 1998, AJ, 116, 85
- Somerville (1999) Somerville R.S., Primack J.R., 1999, MNRAS, 310, 1087
- Spinrad et al. (1971) Spinrad, H., Gunn J.E., Taylor B.J., McClure R.D., Young J.W., 1971, ApJ, 164, 11
- Springel et al. (2001) Springel V., White S.D.M., Tormen G., Kauffmann G., 2001, MNRAS, 328, 726
- Statler et al. (1996) Statler T.S., Smecker-Hane R., Cecil G.N., 1996, 111, 1512
- Stiavelli, Londrillo, Messina (1991) Stiavelli M., Londrillo P., Messina A., 1991, MNRAS, 251, 57
- Tabor & Binney (1993) Tabor G., Binney J., 1993, MNRAS, 263, 323
- Tamura & Ohta (2000) Tamura N., Ohta K., 2000, AJ, 120, 533
- Tamura & Ohta (2003) Tamura N., Ohta K., 2003, AJ, 126, 596
- Tamura et al. (2000) Tamura N., Kobayashi C., Arimoto N., Kodama T., Ohta K., 2000, AJ, 119, 2134
- Tantalo, Chiosi & Bressan (1998) Tantalo R., Chiosi C., Bressan A., 1998, A&A, 333, 419
- Terlevich & Forbes (T02) Terlevich A., Forbes D.A., 2002, MNRAS, 330, 547
- Thomas (1999) Thomas D., 1999, MNRAS, 306, 655
- Thomas, Greggio, Bender (1999) Thomas D., Greggio L., Bender R., 1999, MNRAS, 302, 537
- Thomas et al. (2003) Thomas D., Maraston C., Bender R., 2003, MNRAS, 339, 897
- Thomas et al. (2004) Thomas D., Maraston C., Korn A., 2004, MNRAS, 351, 19
- Thomas et al. (2005) Thomas D., Maraston C.,Bender R., de Oliveira C., 2005, ApJ, 621, 673
- Tucker & David (1997) Tucker W., David L., 1997, ApJ, 484, 602
- Trager et al. (1998) Trager S.C., Worthey G., Faber S.M., Burstein D., Gonzalez J.J., 1998, ApJS, 116, 1
- Trager et al. (2000a) Trager S.C., Faber S.M., Worthey G., González J.J., 2000a, AJ, 119, 1645 (T00)
- Trager et al. (2000b) Trager S.C., Faber S.M., Worthey G., González J.J., 2000b, AJ, 120, 165
- Tran et al. (2005) Tran K.H., van Dokkum P., Franx M., Illingworth G.D., Kelson D., Schreiber N.M.F., 2005, ApJ, 627, 25
- Tripicco & Bell (1995) Tripicco M.J., Bell R.A., 1995, AJ, 110, 3035
- Tsujimoto (1995) Tsujimoto T., Nomoto K., Yoshii Y., Hashimoto M., Yanagida S., Thielemann F.K., 1995, MNRAS, 277, 945
- vader (1988) Vader J.P., Vigroux L., Lachieze-Rey M., Souviron J., 1988, A&A, 203, 217
- van der Wel (2005) van der Wel, A., Franx M., van Dokkum P.G., Rix H.W., Illingworth G.D., Rosati P., 2005, ApJ, 631, 145
- van Dokkum & Franx (1995) van Dokkum P.G., Franx M., 1995, AJ, 110, 2027
- van Dokkum et al. (1999) van Dokkum P.G., Franx M., Fabricant D., Kelson D.D., Illingworth G.D., 1999, ApJ, 520, 95
- van Dokkum (2005) Van Dokkum P.G., 2005, AJ, 130, 2647
- Vazdekis et al (2001) Vazdekis A., Kuntschner H., Davies R.L., Arimoto N., Nakamura O., Peletier R., 2001, ApJL, 2001, 551, 127
- Weil (1995) Weil M.L., 1995, PhD Thesis, University of California, Santa Cruz
- White (1980) White S.D.M, 1980, MNRAS, 191, 1
- White (1991) White S.D.M., Frenk C.S., 1991, ApJ, 379, 52
- Whitmore (1997) Whitmore B.C., Miller B.W., Schweizer F., Fall S.M., 1997, 114, 1797
- Worthey (1994) Worthey G., 1994, ApJS, 95, 107
- Worthey (1998) Worthey G., 1998, PASP, 110, 888
- Worthey & Ottaviani (1997) Worthey G., & Ottaviani D.L., 1997, ApJS, 111, 377
- Worthey et al. (1992) Worthey G., Faber S.M., González J.J., 1992, ApJ, 398, 69
- Worthey et al. (1994) Worthey G., Faber S.M., González J.J., Burstein D., 1994, 94, 687
- Wu et al. (2005) Wu H., Shao Z., Mo H.J., Xia X., Deng, Z., 2005, ApJ, 622, 244
- Yamada et al. (2006) Yamada Y., Arimoto N., Vazdekis A., Peletier R.F., 2006, ApJ, 637, 200
Appendix A Properties of individual galaxies
NGC 1600: This galaxy is a X-bright field elliptical E3 galaxy. It does not show any sign of morphological disturbances (Michard & Prugniel 2004). The shape of the isophotes is boxy and has a core shaped inner profile (Bender et al. 1989; Faber et al. 1997). This galaxy has been proposed as a prototype of a merger where the effects of gas has not been very important (Matthias & Gerhard 1999).
NGC 1700: This galaxy shows clear optical signatures of a past merger, including shells and prominent boxiness (Franx et al. 1989; Whitmore et al. 1997; Brown et al. 2000; Lauer et al. 2005). Photometric fine structure at large radii (Schweizer & Seitzer 1992) is also indicative of a merger, a velocity reversal 50′′ northeast suggest a major event. This galaxy shows a counter rotating core in its centre, but radially increasing prograde rotating in the main body of the galaxy implies that this was not the same event responsible for the counter-rotating core (Statler, Smecker-Hane & Cecil 1996). The strong rotation at large radius and the nearly oblate shape are consistent with N-body simulations of group mergers (Weil 1995). The disturbances are compatible with a merger of 3 or more stellar systems 2-4 Gyr ago. Despite this process, this galaxy follow the same Mg- relation that the rest of elliptical galaxies (e.g. Trager et al. 2000a; Sánchez-Blázquez et al. 2006a). NGC 1700 is situated in an small group of galaxies with 3 members (García 1993).
NGC 2865: This galaxy also shows strong morphological peculiarities (, Michard 2005), which can be indicative of recent interactions. It also shows very young mean age in its centre (Hau, Carter & Balcells 1999; Michard 2005, see Sec.6).
NGC 3377: This galaxy, situated in the Leo I group, shows presence of dust (Lauer et al. 2005) and a stellar disc. The galaxy has discy isophotes in the inner regions, but boxy in the outer regions (Peletier et al. 1990), and it has a power-law central luminosity profile (Faber et al. 1997; Rest et al. 2001).
NGC 3779: This galaxy from the Leo I group, does not show any sign of morphological disturbance (Schweizer & Seitzer 1992). There is, however, a small nuclear nuclear dust ring (van Dokkum & Franx 1995; Lauer et al. 2005), and some ionized gas that extends to a radius of 8 arcsec (Macchetto et al. 1996). All the globular clusters seems to be old and show a broad dispersion in metallicity (Pierce et al. 2006). The dynamics of this galaxy is explained assuming a merger where the gas dissipation has not been important (Gebhardt et al. 2000).
NGC 3384: The galaxy, also from the Leo I group, is the only S0 of our sample. It shows a circumnuclear disc (Sil’chenko et al. 2003) and a disc or a secondary bar aligned with the major axis. This galaxy also has a non-symmetric distribution of stars in the disc (Busarello et al. 1996). NGC 3384 has been proposed as a candidate for a pseudobulge (Pinkney et al. 2003).
NGC 4387: This Virgo galaxy shows and old central age ( 12.5 Gyr, Yamada et al. 2006; Sánchez-Blázquez et al. 2006b). It is a boxy galaxy and it shows a central velocity dispersion drop (Halliday et al. 2001; Emsellem et al. 2004). This decrease in in the central parts of galaxies is predicted for remnants of an equal-mass merger of two spirals (Bendo & Barnes 2000).
NGC 4458: This low luminosity galaxy, situated in the Virgo cluster, also shows a nuclear stellar disc consistent with the presence of a central fast-rotating component in the stellar velocity field (Morelli et al. 2004) and a hot kinematically decoupled core. The cold central disc of NGC 4458 does not show any difference in terms of stellar population with the main body of the galaxy (Morelli et al. 2004). The galaxy shows deviations from the r1/4 law in their outskirts (Michard 1985; Prugniel, Nieto & Simien 1987; Peletier et al. 1990), which have been explained as a result of tidal interaction with NGC 4461 and NGC 4486.
NGC 4464: This galaxy, situated in the Virgo cluster, shows a power-law inner profile (Faber et al. 1997; Lauer et al. 2005).
NGC 4472: This giant elliptical, situated in the Virgo cluster, has X-ray holes or cavities within radii of 2 kpc which may have been produced during a period of nuclear activity that began 1.2107 years ago and may be ongoing (Biller et al. 2004). The globular clusters of this galaxy seem to be old and coeval but they show a range in metallicity from -1.6[Fe/H]0 dex (Beasley et al. 2002).
NGC 4551: This galaxy, one of the members of the Virgo cluster, present a power-law inner profile (Faber et al. 1997; Lauer et al. 2005). A central decrease in the velocity dispersion has been also found (Halliday et al. 2001).
Appendix B Transformation to the Lick system
In Fig. 23 a comparison between the original Lick/IDS index measurements of galaxies in common with our data is shown. Indices in the Lick/IDS galaxies have been measured within an aperture of arcsec (Trager et al. 1998) while we tried to match this aperture extracting the spectra within the central 4′′. Therefore, obtaining an aperture of . Fig. 24 show the comparison between the fully calibrated data by Sánchez-Blázquez (2004) and this work. We selected, from the first study, the measurements within an aperture of 4 arcsec.


Appendix C Comparison with other studies
Some of the galaxies analysed in this study have been already studied by other authors. In particular, we have 5 galaxies in common with Kuntschner et al. (2006) and 2 galaxies in common with Fisher, Sadler & Peletier (1996). The data by Kuntschner et al. (2006) were acquired with an Integral Field Unit (SAURON), but the authors kindly provided us with the extracted gradients from their data assuming an slit width and position angle as the one in our study. Figures 25 and 26 show this comparison. In some cases, we have adjusted the zero point as we are interested in the gradients.


Appendix D Central line-strength indices
Table 7 shows the indices and velocity dispersion measured in the spectra extracted within an aperture of 2.
| Galaxy | D4000 | H | H | CN1 | CN2 | Ca4227 | G4300 | H | H | |
|---|---|---|---|---|---|---|---|---|---|---|
| (km s-1) | Å | Å | Å | Å | Å | Å | Å | Å | Å | |
| NGC 1600 | 333.0 | 1.865 | 1.338 | 5.446 | ||||||
| 1.6 | 0.015 | 0.021 | 0.027 | |||||||
| NGC 1700 | 177.7 | 1.993 | 1.220 | 5.476 | ||||||
| 0.7 | 0.016 | 0.011 | 0.018 | |||||||
| NGC 2865 | 182.8 | 1.655 | 0.759 | 3.825 | ||||||
| 1.0 | 0.013 | 0.011 | 0.018 | |||||||
| NGC 3377 | 153.2 | 1.912 | 1.135 | 5.276 | ||||||
| 0.5 | 0.015 | 0.007 | 0.012 | |||||||
| NGC 3379 | 222.8 | 1.998 | 1.339 | 5.639 | ||||||
| 0.7 | 0.016 | 0.007 | 0.011 | |||||||
| NGC 3384 | 134.1 | 2.004 | 1.337 | 5.535 | ||||||
| 0.6 | 0.016 | 0.006 | 0.011 | |||||||
| NGC 4387 | 140.5 | 1.888 | 1.472 | 5.434 | ||||||
| 0.7 | 0.015 | 0.012 | 0.022 | |||||||
| NGC 4458 | 112.2 | 2.048 | 1.271 | 5.495 | ||||||
| 0.8 | 0.016 | 0.014 | 0.024 | |||||||
| NGC 4464 | 152.3 | 1.946 | 1.201 | 5.565 | ||||||
| 0.7 | 0.016 | 0.012 | 0.020 | |||||||
| NGC 4472 | 281.6 | 1.979 | 1.390 | 5.473 | ||||||
| 0.9 | 0.016 | 0.008 | 0.012 | |||||||
| NGC 4551 | 133.4 | 1.887 | 1.493 | 5.431 | ||||||
| 0.7 | 0.015 | 0.012 | 0.022 |
| Galaxy | Fe4383 | Ca4455 | Fe4531 | C4668 | H | Fe5015 | Mg1 | Mg2 | Mgb | Fe5270 | Fe5335 |
|---|---|---|---|---|---|---|---|---|---|---|---|
| Å | Å | Å | Å | Å | Å | mag | mag | Å | Å | Å | |
| NGC 1600 | 5.395 | 1.525 | 3.642 | 8.468 | 1.422 | 5.823 | 0.149 | 0.306 | 5.302 | 3.040 | 2.881 |
| 0.043 | 0.030 | 0.032 | 0.051 | 0.018 | 0.056 | 0.010 | 0.010 | 0.025 | 0.031 | 0.043 | |
| NGC 1700 | 5.568 | 1.595 | 3.676 | 8.906 | 1.929 | 5.961 | 0.121 | 0.262 | 4.323 | 3.151 | 2.957 |
| 0.028 | 0.016 | 0.021 | 0.037 | 0.013 | 0.038 | 0.010 | 0.010 | 0.016 | 0.021 | 0.023 | |
| NGC 2865 | 3.785 | 1.267 | 3.217 | 6.194 | 3.189 | 5.765 | 0.072 | 0.177 | 3.062 | 2.703 | 2.679 |
| 0.028 | 0.017 | 0.022 | 0.038 | 0.013 | 0.040 | 0.009 | 0.009 | 0.017 | 0.021 | 0.025 | |
| NGC 3377 | 5.049 | 1.464 | 3.413 | 7.597 | 1.860 | 5.531 | 0.134 | 0.269 | 4.501 | 2.976 | 2.841 |
| 0.018 | 0.011 | 0.014 | 0.029 | 0.008 | 0.030 | 0.010 | 0.010 | 0.011 | 0.016 | 0.016 | |
| NGC 3379 | 5.522 | 1.575 | 3.530 | 7.961 | 1.429 | 5.641 | 0.157 | 0.306 | 5.011 | 3.057 | 2.950 |
| 0.018 | 0.012 | 0.014 | 0.029 | 0.008 | 0.030 | 0.010 | 0.010 | 0.011 | 0.016 | 0.016 | |
| NGC 3384 | 6.040 | 1.709 | 3.678 | 9.252 | 1.910 | 6.423 | 0.144 | 0.287 | 4.592 | 3.371 | 3.307 |
| 0.017 | 0.010 | 0.013 | 0.028 | 0.008 | 0.029 | 0.010 | 0.010 | 0.011 | 0.015 | 0.014 | |
| NGC 4387 | 5.455 | 1.498 | 3.361 | 6.025 | 1.715 | 5.480 | 0.109 | 0.244 | 4.224 | 3.028 | 2.893 |
| 0.032 | 0.018 | 0.024 | 0.043 | 0.016 | 0.043 | 0.010 | 0.010 | 0.018 | 0.023 | 0.026 | |
| NGC 4458 | 4.855 | 1.350 | 3.169 | 5.154 | 1.674 | 5.144 | 0.100 | 0.232 | 4.233 | 2.730 | 2.445 |
| 0.036 | 0.021 | 0.028 | 0.048 | 0.017 | 0.046 | 0.010 | 0.010 | 0.020 | 0.024 | 0.028 | |
| NGC 4464 | 5.015 | 1.460 | 3.327 | 5.225 | 1.595 | 5.322 | 0.109 | 0.248 | 4.451 | 2.714 | 2.612 |
| 0.030 | 0.018 | 0.024 | 0.042 | 0.015 | 0.042 | 0.010 | 0.010 | 0.017 | 0.022 | 0.025 | |
| NGC 4472 | 5.675 | 1.586 | 3.557 | 8.424 | 1.507 | 6.081 | 0.157 | 0.312 | 5.064 | 3.129 | 3.018 |
| 0.020 | 0.014 | 0.015 | 0.030 | 0.009 | 0.033 | 0.011 | 0.010 | 0.012 | 0.018 | 0.018 | |
| NGC 4551 | 5.691 | 1.589 | 3.435 | 6.845 | 1.807 | 5.870 | 0.114 | 0.256 | 4.449 | 3.150 | 3.074 |
| 0.032 | 0.018 | 0.025 | 0.042 | 0.016 | 0.042 | 0.010 | 0.010 | 0.018 | 0.023 | 0.025 |