Bulge formation from SSCs in a responding cuspy dark matter halo
Abstract
We simulate the bulge formation in very late-type dwarf galaxies from circumnuclear super star clusters (SSCs) moving in a responding cuspy dark matter halo (DMH). The simulations show that (1) the response of DMH to sinking of SSCs is detectable only in the region interior to about 200 pc. The mean logarithmic slope of the responding DM density profile over that area displays two different phases: the very early descent followed by ascent till approaching to 1.2 at the age of 2 Gyrs. (2) the detectable feedbacks of the DMH response on the bulge formation turned out to be very small, in the sense that the formed bulges and their paired nuclear cusps in the fixed and the responding DMH are basically the same, both are consistent with observations. (3) the yielded mass correlation of bulges to their nuclear (stellar) cusps and the time evolution of cusps’ mass are accordance with recent findings on relevant relations. In combination with the consistent effective radii of nuclear cusps with observed quantities of nuclear clusters, we believe that the bulge formation scenario that we proposed could be a very promising mechanism to form nuclear clusters.
1 Introduction
In our previous works (Fu, Huang, & Deng 2003 (FHD03), Huang, Deng, & Fu 2003 (HDF03)), we managed to construct a set of models for simulating the dynamical evolution of super star clusters (SSCs) in dark matter halo (DMH). The simulations with vastly different settings consistently yielded bulges similar to the observational ones. Two main similarities are (1) the derived surface density can be well fitted by an exponential profile with an additional nuclear cusp, which is consistent with Hubble Space Telescope (HST) observations (Carollo 1999); (2) There is a causal connection between the masses of the paired bulge and nuclear cusp, which is compatible with the observational evidence about a tight luminosity correlation between the paired two (Balcells et al. 2003).
However, the DMH response to SSCs sinkage was not considered in both FHD03 and HDF03. The DMH response, in addition to its feedback on the bulge formation, is also interesting in the context of the inner slope of the DMH profile. As is well known, numerical simulations show that the density profile of virialized CDM DMHs have central cusps (e.g. Navarro et al. 1997; Moore et al., 1999; Jing & Suto 2002; Navarro et al. 2004). However, high resolution observations of dwarfs and low surface brightness galaxies (de Blok et al., 2003; Swaters et al., 2003; Simon et al. 2005) indicate that the Burkert profile (Burkert 1995) with constant density core instead of the cuspy NFW one is more suitable to these galaxies. This apparent contradiction has drawn much concerns in astronomical communities. While some groups were checking the conflict by performing refined simulations or conducting higher resolution observations (e.g. Power et al. 2003; Navarro et al., 2004; Simon et al., 2005 and the references therein), the others were trying to find a solution to this problem for CDM by considering additional physical process involving luminous matter. In particular, El-Zant et al. (2001, 2004) showed that the DM distribution flattens when gas clumps in a galaxy or galaxies in clusters spiral inward.
On the other hand, Kazantzidis et al. (2004) have shown that the DMH initialized using the local Maxwellian approximation can result in spurious evolution. It was indeed what we faced with during our early investigation on bulge formation in a responding DMH to sinking SSCs. We found false evolution of DMH, due to the fact that the DMH is not in equilibrium under the local Maxwellian approximation. To ensure real response of host DMH to sinking SSCs, we’ll start with building an equilibrium DMH using exact distribution function (Kazantzdis et al., 2004, Liu et al. 2005) in this work, followed by considering the DMH response to SSCs sinkage, namely, the effects of gravitational contraction and heating expansion caused by spiraling inward and the transferring orbital energy of SSCs. Taking the above two effects into consideration, we simulate the dynamical evolution of SSCs in an initially cuspy DMH, as a more sophisticated model of bulge formation in very late-type galaxies. The properties of the formed bulges and their paired nuclear (stellar) cusps will be compared with, in addition to the ones already mentioned, the most recent observations (Rossa et al. 2006), where the authors found a correlation between nuclear cluster mass and the bulge luminosity for their 40 sample spirals.
The structure of this paper is as follows. In section 2, we describe our models. Sections 3 and 4 are devoted respectively to presenting and discussing our simulation results about DMH evolution and bulge formation. Conclusions are given in section 5.
2 Models
In this work, the bulge formations in a set of 40 sample galaxies are simulated. Apart from the DMH-related models, which will be described in the following subsections, the other settings are the same as those of HDF03 and listed in Table 1. The basic of these settings are summarized below for completeness.
The radial distribution of SSCs is obtained from the projected radial number distribution of bright star-forming complexes in a sample of very late-type galaxies (Parodi & Binggeli 2003), with a median scale length of kpc and a median number of bright star-forming complexes of 17, respectively. These SSCs are all modeled as a truncated isothermal sphere. The initial mass function of SSCs is assumed to be a log-normal mass function, written as
| (1) |
We assume that the stellar mass outside a sphere of radius , which corresponds to the instantaneous Hill stability region around the SSC center, will be stripped. On average, the stars stripped when the SSC goes from to contribute to a region radially bounded by and . In our simulations, tidal stripping is not allowed when the mass of the stripped SSC is less than .
2.1 Numerical DMH
2.1.1 Simulation methods
In order to consider the effects of the interaction between the DMH and the SSCs on the bulge formation, we will use a particle representation of the DMH. When one uses limited number of particles to represent a gravitational system and perform a usual N-body simulation, he in fact assumes that each representing particle is actually a representative of the physical ones with similar 3-dimensional velocity in its 3-dimensional neighborhood. Since our model is assumed to be spherically symmetric, each particle in our simulation is reasonably used to represent the physical particles with similar radial and transverse velocities in a shell. It can be understood that the radial position of a shell corresponds to the 3-dimensional position of the above-mentioned neighborhood in the usual N-body simulation. In doing the numerical integration, one can follow El-Zant, Shlosman, & Hoffman (2001) and assume that the gravitation on a given particle at is , where is the position vector starting from the center, , and the total mass interior to . This force model ensures automatic maintenance of the spherical symmetry. Based on this perspective (e.g., Henon, 1971; El-Zant , Shlosman, & Hoffman 2001), we believe that the way we use to integrate the numerical DMH is well adapted to nearly spherically symmetric systems like ours.
One basic requirement for this representation is that it must be statistically meaningful at from the center, so that the simulations could be compared with the aforementioned observations with linear resolution of about . Simple calculation shows that, even if this requirement is as weak as to have about 10 particles in the central globe of radius , one needs about particles for representing the whole DMH interior to . This would make it extremely time-consuming to complete our simulations.
To work around this difficulty, we neglect the DMH response outside . Indeed, our preliminary simulations show that the DMH response is hardly detectable at locations more than about from the center (Fu, Huang, & Deng 2004 (FHD04)). Physically, this phenomenon has a connection with a reasonable general belief, that is, a low-mass intruder shouldn’t induce global evolution of a high-mass intruded system. In our case, the DMH mass of initially confined to the central globe of radius is more than 10 times larger than any single SSC mass. In fact, the SSC mass initially inside 1kpc in our sample galaxies never exceeds , about ten times smaller than the dark matter mass in the same region. Also, as can be inferred from our previous simulations and verified ex post facto by the present one, only a small number of SSCs will spiral down to locations less than from the galactic center on the time scale of bulge formation. Therefore, the simplifying assumption that there’s no DMH response outside shouldn’t have any severe influence on the simulation results.
A practical problem of using full N-body simulation for our investigation is that one is not able to use particles with small enough mass to represent the dark matter halo. This means that, when masses of SSCs become not much massive than the representing particle of dark matter halo due to tidal stripping, the effect of dynamical friction cannot be correctly reproduced for free in practice. For example, if we set particles, about 10 solar mass of each representing particle, inside of 1 kpc for our simulations, the effect of dynamical friction would not be properly reproduced for stripped SSCs with less than about 100 solar mass. For a large number of SSCs, however, the mass of remaining SSCs at around 5 pc from the center would be a few tens of solar mass or less. Therefore, or more particles are needed in order to properly include the DMH heating in the inner 5pc globe for free, as is required for the proposed bulge formation processes to be simulated with the required resolution of 5 pc.
It follows that even using a full N-body code for our investigation, one has to add the dynamical friction by hand. On the other hand, a number of investigations performed with N-body simulations have provided the basis for taking the semi-analytical approach (e.g. Cora, Muzzio, & Vergne 1997; Velazquez & White, 1999). These studies indicated that “the numerical (i.e. full N-body) results of low-mass satellites showed very good agreement with theoretical prediction obtained from straightforward application of Chandraehkhar dynamical friction equation” (Cora, Muzzio, & Vergne 1997), and they found “Chandraehkhar’s dynamical friction formula works well provided a suitable value is chosen for the Coulomb logarithm and the satellite mass is taken to be the mass still bound to the satellite at each moment” (Velazquez & White, 1999). In view of this, the Coulomb logarithm in our simulations is calculated each time the formula is applied, according to the relevant updated quantities, and, by taking account the stripping effect, only the mass still bound to the SSC is used.
But we must point out that the above-mentioned numerical experiments didn’t follow the satellite all the way in towards the center of its host galaxy, where the semi-analytical equation (2) could become invalid because the size of the satellite is not always adequately small as compared to the scale length of the background density variation. While this possible inadequacy could have some influences on the bulge formation process, the overall influence should not be severe because, on its way towards the center, an SSC also becomes smaller and smaller due to tidal stripping. In fact, most SSCs will be destroyed before they are close to the center, and the remaining ones are very compact.
Apart from computation time, the two methods, N-body and semi-analytical approaches, are expected to be equivalent in regard to dealing with the dynamical friction, except for the unfavorable region very close to the galactic center. Considering the time-saving advantage on taking the semi-analytical experiment as described in this paper, especially for simulating at least several tens of sample galaxies, we tend to adopt the later approach for our study.
However, it is surely important to reveal some potential inadequacies, induced by the semi-analytical treatment of dynamical friction, as well as of other physical processes to be introduced in the following subsections, by simulating the proposed bulge formation processes with a full N-body code, such as GADGET, when sufficiently powerful computer facility is available. This will help one to decide to what extent the semi-analytical approximations can be accepted with full confidence.
2.1.2 Reflecting sphere
Under the above assumption, we model our DMH as follows. The DMH content interior to the spherical surface of radius is represented by a system of particles. These particles are randomly generated according to the isotropic stable distribution function corresponding to the NFW density profile but with an outer exponential cutoff (Kazantzidis et al. 2004; Liu et al. 2005). During the numerical integration of the particle system, a reflecting boundary condition will be applied on the above-mentioned spherical surface. To be specific, whenever an outgoing particle reaches this surface, its velocity will be reversed.
In other words, the inflow halo mass across the sphere of radius 1.1kpc is accounted for by the reflected particles at the inner boundary of the same sphere. This is based on the assumption that this sphere is situated in the nearly stable region of the halo, which, in particular, means that each inflow halo particle should be compensated by an outflow one with the same velocity. In practice, the boundary condition cannot be applied exactly on the sphere, there are inward particles lie slightly outside 1.1kpc. These particles are allowed to go inside freely.
For a given sample particle system, the part inside , will be referred to as a numerical DMH, of which the particle positions will be used in calculating the gravitation of the DMH at distances interior to . For particles outside , the gravitation will be calculated by using the analytical NFW model. This is because we discuss the evolution of the DMH profile only inside 1kpc, outside which the halo is assumed to be in equilibrium.
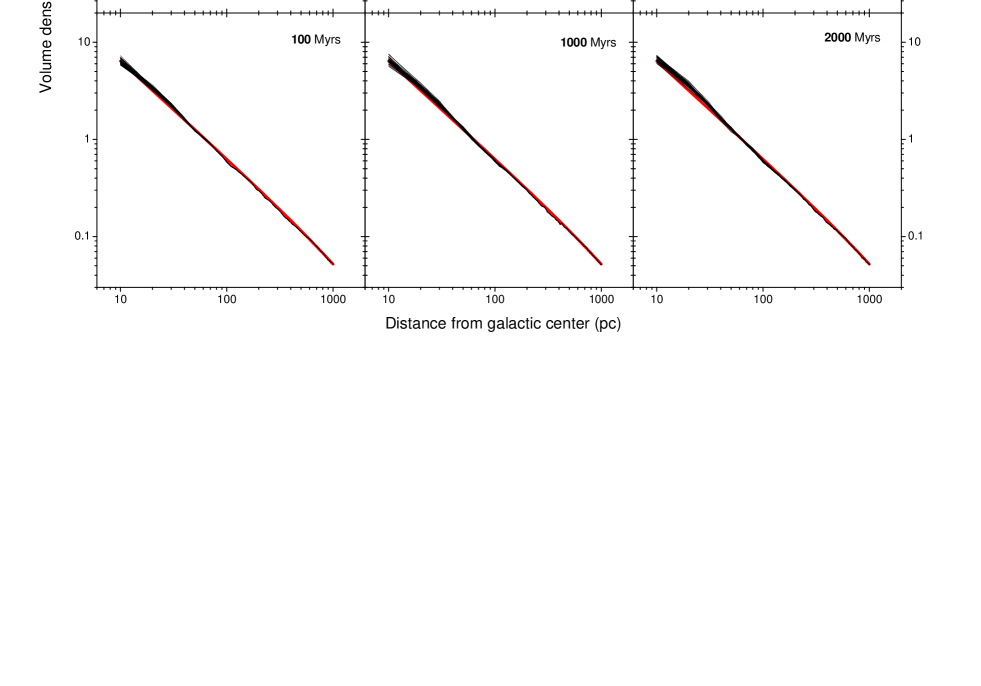
To see to what extent our numerical DMHs can be claimed as stable systems, we integrate them in the absence of SSCs. The volume density profiles of the numerical DMHs at various time are illustrated in Fig.1. Based on this figure, we are convinced that the numerical DMHs are sufficiently stable for detecting significant DMH response to SSCs sinkage.
2.2 Dynamical friction
In agreement with Kazantzidis et al. (2004), Fig.2 shows the one dimensional velocity distributions of the numerical DMHs. We can see that the velocity distributions at distances not far from the center are significantly steeper than Gaussian distribution. According to Liu et al. (2005), this could make it inadequate to estimate the dynamical friction with the formula we used in FHD03, HDF03 and FHD04 (see also Binney & Tremaine 1987; El-Zant et al. 2001). Instead, the Chandrasekhar dynamical friction formula, valid for any isotropic velocity distribution, should be used (Chandrasekhar 1943; Binney & Tremaine 1987). This latter formula reads
| (2) |
where is the phase-space number density of the background composed of particles of mass , moving with speed ; and the mass and velocity of the cluster experiencing the dynamical friction, respectively; the Coulomb logarithm; and denotes the mass density of background matter moving slower than the cluster.
On the other hand, the dynamical friction of the stripped stars from SSCs is roughly estimated using Maxwellian approximation, as we did in our previous simulations.
2.3 DMH responses
There are two competing effects on the numerical DMH in response to SSCs sinkage, namely the gravitational contraction and heating expansion. The former one is automatically included in the above-mentioned force model. We believe that the way to account for the halo heating by El-Zant, Shlosman, & Hoffman (2001) and El-Zant et al. (2004), is a reasonable approach for us to take, because the densely distributed DMH matter should also be efficient in distributing, at least locally as is required, the energy obtained from the coupling with the SSCs.
In practice, at the end of each integration step, “the Cartesian velocity components of the DMH particles are updated through an additive term chosen from a normal distribution with zero mean and variance” (El-Zant, Shlosman, & Hoffman 2001) , where is the energy gained by a DMH particle from all SSCs and the mass of the particle. We know that an SSC in its way spiraling inwards will lose orbital energy mainly to DMH particles nearby its trajectory. And as these particles with isotropic velocities radially oscillate around their respective mean distances from the galactic center, the energy lost by the SSC will be redistributed among all DMH particles around , where is the averaged distance of the SSC over the last integration step. This implies that DMH particles around should gain more energy than the ones far from it. Based on the above arguments, we distribute the energy lost by an SSC during the last integration step to several bins, within each of which the particles (including the involved DM not actually represented by particles. The corresponding number of ”particles” accounts for this part of DM can be calculated from the fixed NFW density profile) will be assigned with the same energy increment due to the considered SSC. These SSC-dependent bins are obtained by dividing the radial distance interval , where the effective impact parameter used in estimating the Coulomb logarithm. The bin nearest to the SSC always covers the region explored by the SSC in the last integration step, and the boundaries of the other bins equispaced in , where is the radial distance from the SSC. The energy lost by an SSC is distributed among the bins according to the following fact: the dynamical friction from the DMH content within the distance from the SSC is proportional to , where (e.g. Binney & Tremaine 1987).
It should be pointed out that the above simplifying semi-analytic prescription for halo heating effectively neglects possible non spherically symmetric evolution of the DMH, which can only be studied with full N-body simulation.
3 DMH evolution
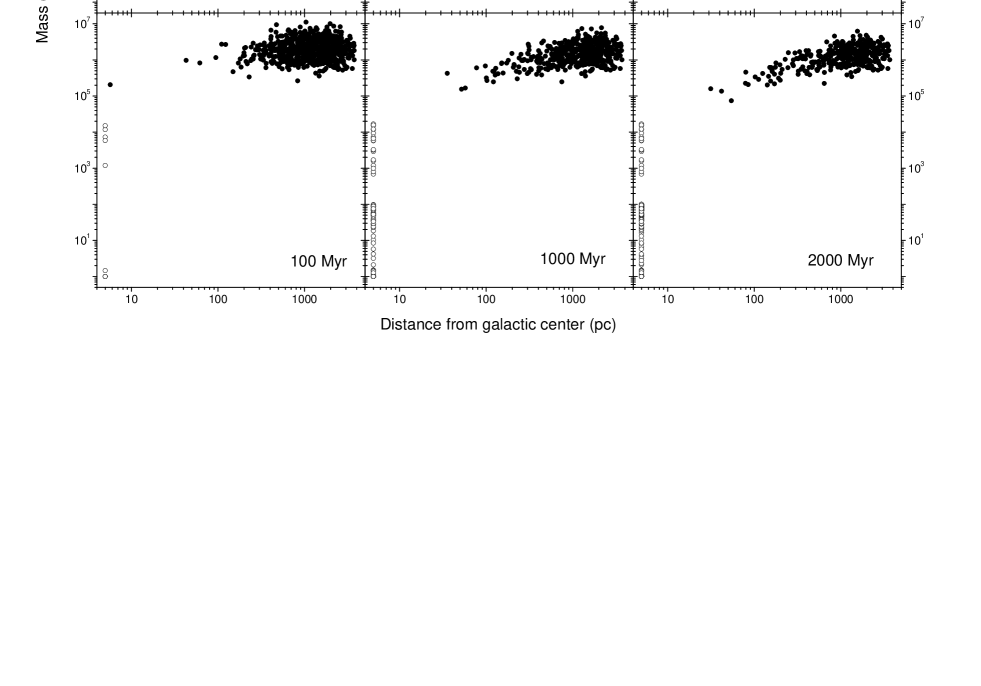
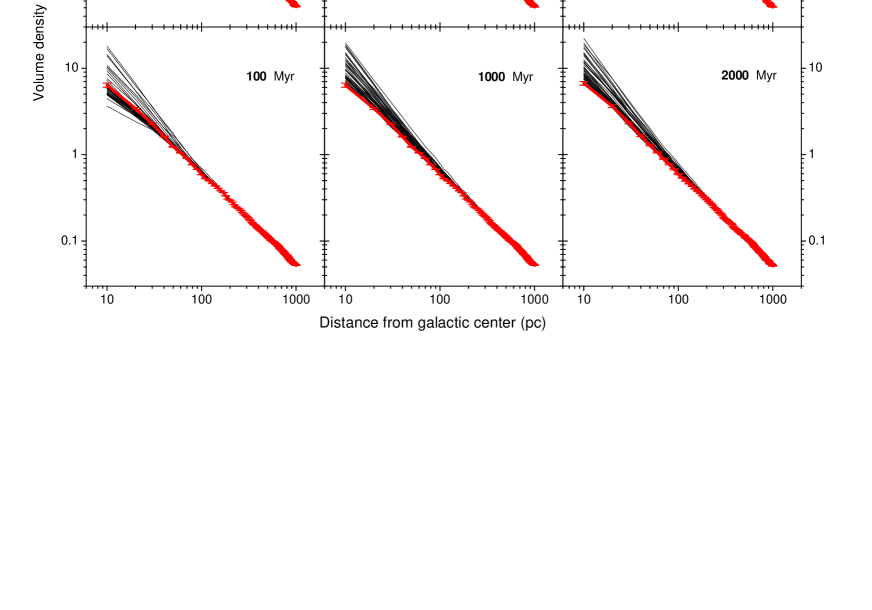
For simplicity, the DMH used in this work will be referred to as the responding DMH, while the DMH with NFW density profile and Maxwellian velocity distribution used in HDF03 the fixed DMH. In a responding DMH, the evolution of DM density profile depends on the redistribution of luminous matter induced by sinking of SSCs. Fig. 3 and Fig. 4 illustrate, respectively, the variation of SSCs radial distribution with time and the resulting evolution of DM density profiles.
The upper panels of Fig. 3 depict the early stage of SSCs’ sinkage until 10 Myrs, where we can find very few SSCs deposited to the central region. At that time, heating the halo induced by dissipated orbital energy of spiraling inward of SSCs dominates. The DM in the central region has been puffed outward then (also see, Tasitsiomi 2003), leading to decreasing density in region of around several tens of pc from the center. The upper panels of Fig. 4 clearly present the early decreasing phase of this kind. With the time going on, more and more SSCs have sunk into nuclear region, shown in the lower panels of Fig. 3. The effect of gravitational contraction overwhelms that of heating expansion then, resulting in increasing DM distribution over that region. The steeper central cusps with respect to typical NFW profiles are obviously indicated in the lower panels of Fig. 4.
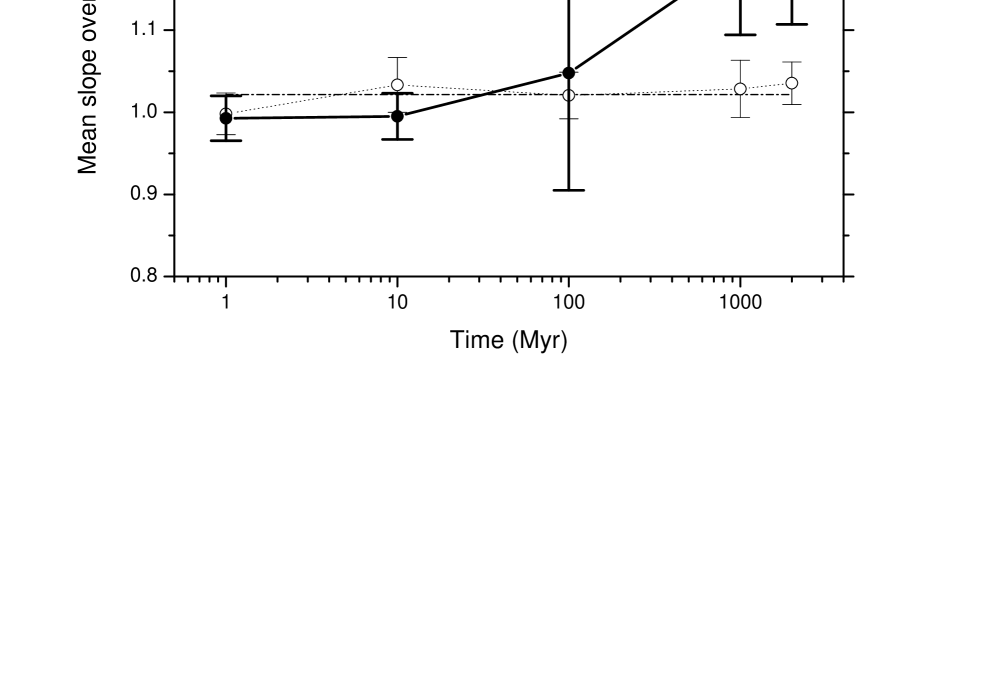
We have noticed that the DMH response is detectable only in region less than 200pc from the center. Adopting the logarithmic slope defined as (Navvaro et al. 2004), we can show the time evolution of the mean responding DMH in Fig. 5 by use of mean logarithmic slope over the inner 200pc region. For comparison, the logarithmic slope of the analytical NFW and the mean unpolluted DMH profiles are also indicated in this figure. What we can see from this figure is an early decreasing phase on the inner slope of the mean responding DM profile, followed by gradual increasing trend with time. At 2 Gyrs, the inner slope of the mean responding DM profile is about 1.2. A similar phenomenon was recently obtained by Lin et al. (2006), who found that the concentration parameters of DMHs increase due to the influence of baryonic matter on them.
4 Bulge formation
4.1 Feedback of DMH response on bulge formation
We have shown in the above section that the DM distribution experiences two different phases induced by the influence of sinking SSCs, the early decreasing and latter increasing density over the inner central region. In return, the time evolution of DMH will certainly affect the dynamical evolution of SSCs and the bulge-formation histories. To compare our present simulations (in a responding DMH) with those in the fixed DMH (HDF03) would clarify the feedback of DMH response on bulge formation, shedding light on galaxy formation.
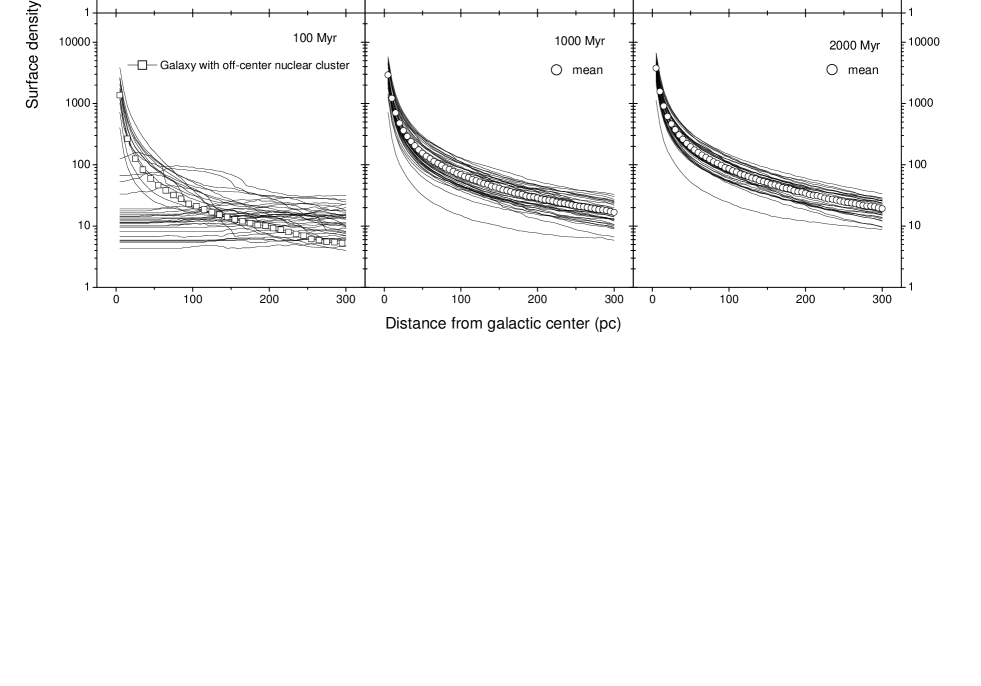
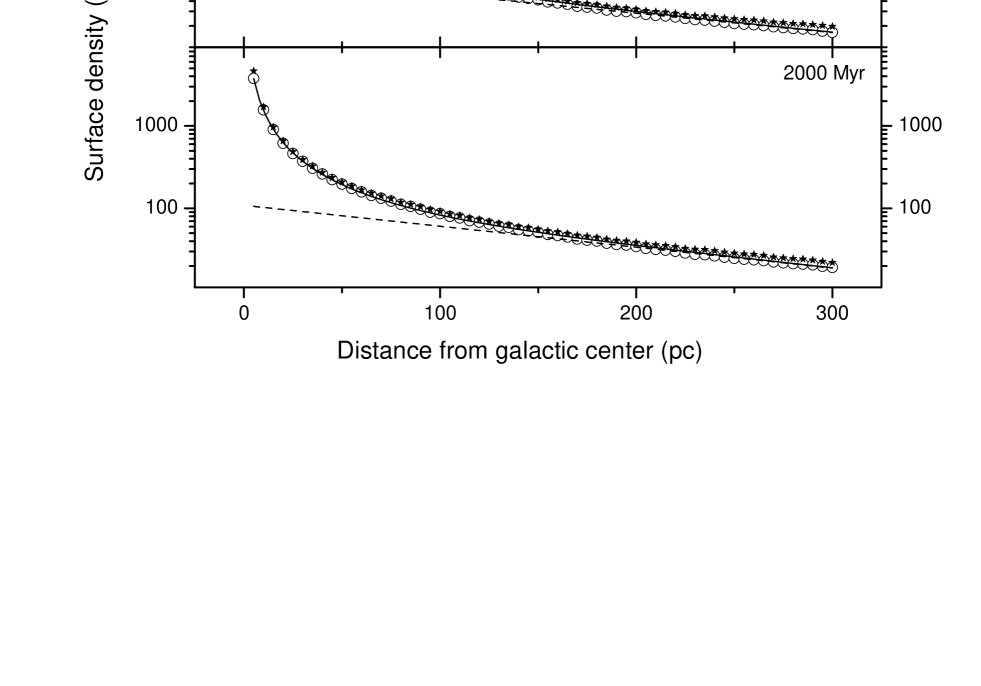
Following what we did in the fixed DMH (HDF03), we display the bulge formation processes and the mean surface density profiles in Fig. 6 and Fig. 7, respectively. In general, they are about the same as what we obtained in HDF03, i.e. the formed bulges are characterized by the general presence of a central cusp on top of an exponential bulge. For this reason, we take the same fitting models as we used in HDF03 (Carollo & stiavalli 1998)
| (3) |
where the first term represents an exponential bulge and the second one an additional nuclear cusp. As shown by open circles in Fig. 7, the mean profiles obtained from the present simulations are well fitted to this model. The solid stars showing in Fig. 7 denote the derived mean profiles in HDF03. They are just slightly higher than the formed bulges in the responding DMH. It follows that the histogram of the scale length, , for each simulated bulges and FWHM for nuclear cusps derived in responding DMH, displayed in Fig. 8, would be about the same as those obtained in fixed DMH (HDF03), though the later results are acquired at age of 3 Gyrs.
The disparity, though small, of mean surface density profiles in different DMHs should have something to do with the feedback of the DMH response on bulge formation. In fact, most SSCs take more than several hundred Myrs to spiral down to several hundred pc from the center, shown in Fig. 3. On the other hand, apart from the very early time the DMH response leads to increasing density of DM over the central region. It would cause stronger tidal stripping on SSCs outside the bulge region, resulting in lower surface density distribution than that derived in the case of fixed DMH, just looks like what we illustrated in Fig. 7.
The continuously stronger tidal stripping induced by DMH response in most of evolution time would make it harder for an SSC to survive as an off-center star cluster than in the fixed DMH. Nonetheless, one such cluster presents at about 6 pc from the center in the snapshot at in Fig. 3 . The surface density profile of the bulge hosting this cluster is indicated by squares in the lower left panel of Fig. 6. Clearly, the outer part of this bulge is very weak. This simulated sample provides a possible explanation for the existence of off-center nuclear star clusters hosted in the so called bulgeless spirals (Matthews & Gallagher 2002). Indeed, observations on searching for bulges in very late-type galaxies started only very recently, and it’s possible that some very weak bulges remain undetected (see, e.g. Böker et al. 2003; Carollo 1999).
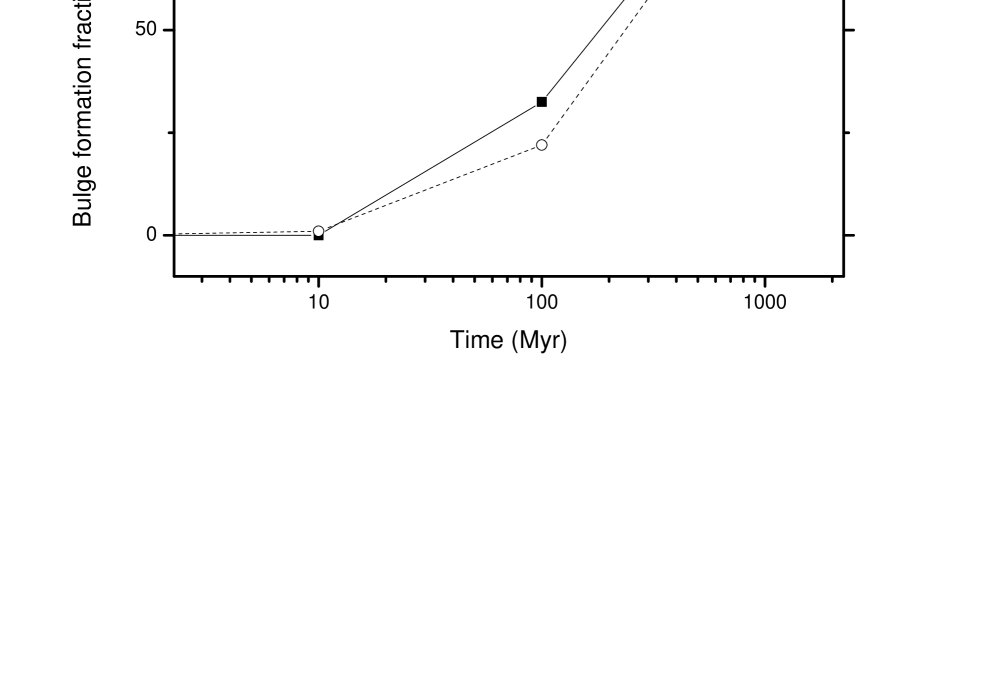
Fig. 9 presents the bulge formation fractions in the responding and the fixed DMHs. Generally speaking, bulges form earlier in the former DMH. This is mainly resulted form its steeper velocity distribution than the Gaussian one. In fact, for two DMHs having the same volume density, the one with steeper velocity distribution has stronger effect of dynamical friction (Binney & Tremaine 1987; Liu et al. 2005). Besides, we have discussed above that the DMH density response should also be in favor of stronger effect of dynamical friction on most SSCs. However, the opposite situation is possible for SSCs initially very close to the central region where DMH density undergoes a transitory, early decreasing phase, seen in Fig. 4. This explains why the bulge formation fraction at very early stage is lower in the responding DMH than in the fixed DMH .
In summary, the DMH response to SSCs sinkage does have detectable feedbacks on bulge formation. However, the feedbacks discussed above are actually not very significant. The formed bulges in both fixed and responding DMHs are basically the same at least in the view of the present day observations. It suggests that the fixed DMH could still be an acceptable simplifying model for dark matter of galaxies, as far as the bulge formation is concerned.
4.2 Mass correlation between the paired bulges and nuclear cusps
The occurrence of compact massive star clusters at nuclei of spiral galaxies is now believed to be a common phenomenon (e.g. Böker et al. 2002, Matthews & Gallagher 2002 ; Böker et al. 2003; Rossa et al. 2006). The great progress made by Rossa et al. (2006) is to derive important properties of these nuclear clusters (NCs), such as ages, masses, and their composition of stellar populations. According to these investigations, we have a basic understanding to the physical properties of NCs hosted by most spirals. For example, the NC effective radii are typically in the range of 2 - 10 pc, their average masses () and mass-weighted ages () are, respectively, 6.25 vs 7.63 and 9.07 vs 9.89 for late- vs early-type spirals.
The most instructive result by Rossa et al. (2006) is the tight correlation of the NC mass to the luminosity of its bulge, similar to the striking luminosity correlation of paired bulge and the nuclear cusp obtained by Balcells et al. (2003). Both of these studies strongly imply the causally connected formation processes between the two components. In our previous work in the fixed DMH (HDF03), we have shown clearly that the mass relation between the simulated bulges and their paired nuclear (stellar) cusps coincides well with what Balcells et al. (2003) obtained.
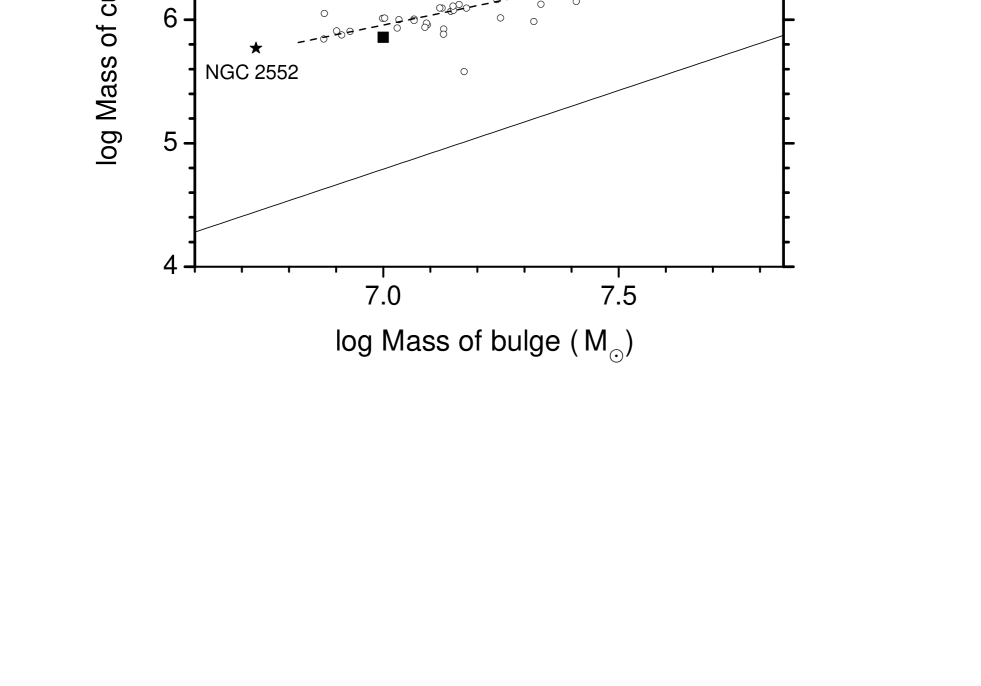
In the case of responding DMH, the mass relation between the nuclear (stellar) cusps and their paired bulges would also hold as expected from the connected formation processes of these two components, as shown in Fig. 10. The dashed line in the figure illustrates the linear fitting for these simulated data. The data point, in solid square, derived for Balcells et al’s situation (see, HDF03) is also added in this figure for comparison. The thin solid line is extracted from Rossa et al. (2006), based on certain mass-to-light ratio.
The major problem for comparing our simulations to what Rossa et al (2006) derived lies in their important finding, i.e. NCs are composed of mixed populations of different ages. It means that NCs form via at least more than one starburst event. On the contrary, what we proposed to form bulges and nuclear (stellar) cusps through dynamical evolution of SSCs in DM dominated galaxies is only for very late-type spirals experiencing one starburst event, triggered by galactic harassment. This inherent difference causes the disparity of our simulations from the observed thin line shown in Fig. 10.
According to the hierarchical processes of galaxy formation, the very late-type spirals would be the ones undergoing least merger/interaction events. That is to say, two Sm type spirals among the 40 sample galaxies that Rossa et al. (2006) observed, NGC 428 and NGC2552, are sources most suitable for comparing with our simulations. The solid stars shown in Fig. 10 are the data points of these two galaxies. Though two sample galaxies are really not enough for us to reach definite conclusion, the close slopes of the two (observed) data points and the dashed (simulation) lines is very encouraging indeed.
The same situation as we see in Fig. 10 also occurs in the time dependency of nuclear (stellar) cusp mass, shown in Fig. 11. The thin solid line extracted from Rossa et al.(2006) illustrates the NC mass in relation to the mass-weighted ages. The mass-weighted ages are referred to the older population of NCs, which contains most of the NCs mass. Obviously, it is this case that does match what our simulations derive. The most impressive thing in this figure is the very close slopes of our simulations to the two galaxies with Hubble type of Sm, NGC 428 and NGC2552, which is just the same as we see in Fig. 10.
The same closeness appearing in two different statistic correlations gives us a very strong hint that our hypothesis for bulge/(nuclear cusps) formation does have something to do with NC formation. In fact, our previous simulations with higher resolution of 2pc (HDF03) showed that the effective radii of nuclear (stellar) cusps range from a few - 9 pc, and their median mass mass, both of them are in accordance with the observed data mentioned above. In combination of all of these arguments, we are convinced that the hypothesis that we proposed (FHD03) could be a very promising mechanism for NC formation in most spiral galaxies, apart from being an approach to form bulges.
5 Conclusions
The increasingly observed data indicate that galactic harassments, even minor mergers, such as the case of NGC 3310 (de Grijs et al. 2003), can trigger the formation of a set of SSCs over galaxies. The follow-up, dynamical evolution of SSCs in a configuration of DM dominated systems would be a general phenomenon, which motivated our investigation on this processes to be a model for bulge formation (FHD03).
As a basic part of this model, the evolution of DMH induced by the influence of sinking SSCs was a major step that we moved on. It is also of interest to understand the resulting variation of the inner slopes of the DM density profiles in that case. The simulations performed in this work have indicated that the DMH response to sinking of SSCs does cause the inner slope of an initial NFW density profile to steepen, approaching to 1.2 at 2 Gyrs in mean logarithmic slope over the responding region.
However, compared with the region traversed by sinking SSCs, the above mentioned responding region is small. As a result, the feedbacks of the DMH response on the bulge formation turned out to be very small, in the sense that the formed bulges in both the fixed (HDF03) and the responding DMH (this work) are basically the same, both are consistent with observations.
One very instructive result obtained from our consecutive investigations (FHD03; HDF03; and this work) is that nuclear (stellar) cusps are formed, no matter what kind of DM density profile was adopted, the NFW or the Burkert profile, no matter whether the interaction between the dark and luminous matter has been considered or not. The derived median mass and effective radii of the cusps are accordance with the observed corresponding NC quantities in most spiral galaxies.
The more important point on this matter would be what we demonstrated in this work on the mass correlation of nuclear (stellar) cusps to the bulges, which is consistent with the similar observed relation for relevant sample spirals. The same situation appears in diverse statistics on the time dependency of NC/(nuclear cusp) mass.
No matter how complicated the formation processes are for nuclear clusters of spirals, the work that we have done indicates that to form nuclear cusps through sinking of SSCs would be a very promising mechanism for NC formation in very late-type spirals. Also, they could be the base, or seed, to grow up for late-type spirals that Rossa et al. (2006) observed.
Obviously, more work needs to be done in both observations and simulations so that we could reach positive conclusions. Especially, to observe more galaxies with Hubble type of Sm and to simulate bulge formation or growth originated from more than one galactic harassment event would be desperately needed.
References
- Balcells (2003) Balcells M., Graham A.W. & Dominguez-Palmero L. 2003, ApJ, 582, L79
- Binney & Tremaine (1987) Binney J., Tremaine S.D. 1987, Galactic Dynamics, Princeton University Press, Princeton, New Jersey
- Böker (2002) Böker T., Laine S., van der Marel R.P., Sarzi M., Rix H-W., Ho L.C. & Shields J.C. 2002, AJ, 123, 1389
- Böker et al. (2003) Böker, T., Stanek, R., van der Marel, R.P., 2003, AJ, 123, 1073
- Burkert (1995) Burkert A. 1995, ApJ, 447, L25
- Carollo & Stiavelli (1998) Carollo C.M. & Stiavelli M. 1998, AJ, 115, 2306
- Carollo (1999) Carollo C.M. 1999, ApJ, 523, 566
- Chandrasekhar (1943) Chandrasekhar, S., 1943, ApJ, 97, 255
- Cora, Muzzio, & Vergne (1997) Cora, S.A., Muzzio, J.C., & Vergne, M.M., 1997, MNRAS, 289, 253
- de Blok et al. (2003) de Blok, W.J.G., Bosma, A. & McGaugh, S. 2003, MNRAS, 340, 657
- de Grijs et al. (2003) de Grijs, R., Fritze-v. Alvensleben, U.F., Anders, P., Gallagher, J.S.,III, Bastian, N., Taylor, V.A., & Windhorst, R.A. 2003, MNRAS, 342, 259
- El-Zant et al. (2001) El-Zant A., Shlosman I., & Hoffman Y. 2001, ApJ, 560, 636
- El-Zant et al. (2004) El-Zant A., Hoffman Y., Primack J., Combes F., Shlosman I.. 2004, ApJ, 607, L75
- Fu, Huang & Deng (2003) Fu, Y. N., Huang, J. H., Deng, Z. G. 2003a, MNRAS, 339, 442 (FHD03)
- Fu et al. (2004) Fu, Y. N., Huang, J. H., Deng, Z. G. 2004, Proceedings IAU Symposium No. 222: The Interplay among Black Holes, Stars and ISM in Galactic Nuclei, eds. Th. Storchi Bergmann, L.C. Ho & H.R. Schmitt (FHD04)
- Henon (1971) Henon, M., 1971, ApSS, 13, 284
- Huang et al. (2003) Huang, J.-H., Deng, Z.-G., & Fu, Y.-N. 2003, PASJ, 55, L89 (HDF03)
- Jing & Suto (2002) Jing, Y.P. & Suto, Y., 2002, ApJ, 574, 538
- Kazantzidis et al. (2004) Kazantzidis, S., Magorrian, J., Moore, B. 2004, ApJ, 601, 37
- Lin et al. (2006) W.P., Lin, Y.P., Jing, S., Mao, L., Gao, I.G., McCarthy. 2006, ApJ, (astro-ph/0607555)
- Liu et al. (2005) Liu, W.H., Fu Y.N., Deng Z.G., Huang J.H. 2005, PASJ, 57, 541
- Matthews (2002) Matthews, L. D., & Gallagher, J. S. 2002, ApJS, 141, 429
- Moore et al. (1999) Moore, B., Quinn, T., Govemato, F., Stadel, J., & Lake, G. 1999, MNRAS, 310, 1147
- Navarro et al. (1997) Navarro J.F., Frenk C.S. & White S.D.M. 1997, ApJ, 490, 493
- Navarro et al. (2004) Navarro, J.F., Hayashi, E., Power C., Jenkins, A., Frenk, C.S., White, S.D.M., Springel, V., Stedel, J., Quinnm T., 2004, MNRAS,349, 1039
- Parodi and Binggeli (2003) Parodi, B.R. and Binggeli, B. 2003, A&A, 398, 501
- Power et al. (2003) Power, C., Navarro, J.F., Jenkins, A., Frenk, C.S., White, S.D.M., Springel, V., Stadel, J., & Quinn, T. 2003, MNRAS, 338, 14
- Rossa et al. (2006) Rossa, J., van der Marel, R. P., Boker, T., Gerssen, J., Ho, L.C., Rix, H-W., Shields, J.C., Walcher, C-J., 2006, preprint (astro-ph/0604140)
- Simon et al. (2005) Simon J. D., Bolatto A. D., Leroy A., Blitz L., Elinor L. Gates E. L., 2005, ApJ, 621. 757
- Swaters et al. (2003) Swaters, R.A., Madore, B.F., van den Bosch, F.C. & Balcells, M. 2003, ApJ, 583, 732
- Tasitsiomi (2003) Tasitsiomi, A., 2003, Int.J.Mod.Phys. D12, 1157
- Velazquez & White (1999) Velazquez, H., & White, S.D.M., 1999, MNRAS, 304 254
| Item | Description |
|---|---|
| DM DMH: initial density profile | NFW with |
| SSC: initial mass function | Log-normal with |
| SSC: projected radial number distribution | |
| SSC: total number in a single galaxy | 17 |
| SSC: initial velocity | Local circular speed |