The effect of a Chandra-measured merger-related gas component on the lobes of a dead radio galaxy
Abstract
We use Chandra data to infer that an X-ray bright component of gas is in the process of separating the radio lobes of 3C 442A. This is the first radio galaxy with convincing evidence that central gas, overpressured with respect to the lobe plasma and not simply a static atmosphere, is having a major dynamical effect on the radio structure. We speculate that the expansion of the gas also re-excites electrons in the lobes of 3C 442A through compression and adiabatic heating. Two features of 3C 442A contribute to its dynamical state. Firstly, the radio source is no longer being powered by a detected active jet, so that the dynamical state of the radio plasma is at the mercy of the ambient medium. Secondly the two early-type galaxies, NGC 7236 and NGC 7237, one of which was the original host of 3C 442A, are undergoing a merger and have already experienced a close encounter, suggesting that the X-ray bright gas is mostly the heated combined galaxy atmospheres. The lobes have been swept apart for yrs by the pressure-driven expansion of the X-ray bright inner gas.
Subject headings:
galaxies: active — galaxies: individual (NGC 7237, 3C 442A (catalog )) — galaxies: interactions — radio continuuum: galaxies— X-rays: galaxies1. Introduction
Radio galaxies have a profound influence on the intergalactic, intragroup, or intracluster X-ray emitting gas in which they are in contact, in particular through moving gas via the creation of cavities and shocks (see the review of Jones et al., 2007). In turn the dynamics of the radio plasma are affected by the inertia of the gas that it encounters, and it is slowed and redirected as a result. In this letter we report the first case where, instead of radio plasma moving X-ray emitting gas, the X-ray emitting material is exerting a dominant influence on old radio plasma, pushing apart the lobes of 3C 442A.
Birkinshaw, Laing & Peacock (1981) first reported on the absence of jet emission in the amorphous radio lobes of 3C 442A, and this is confirmed by the more extensive study of Comins & Owen (1991). 3C 442A can therefore be characterized as a dead radio galaxy, in the sense that it contains no radio jet at the level seen in actively jet-driven radio galaxies of similar power.
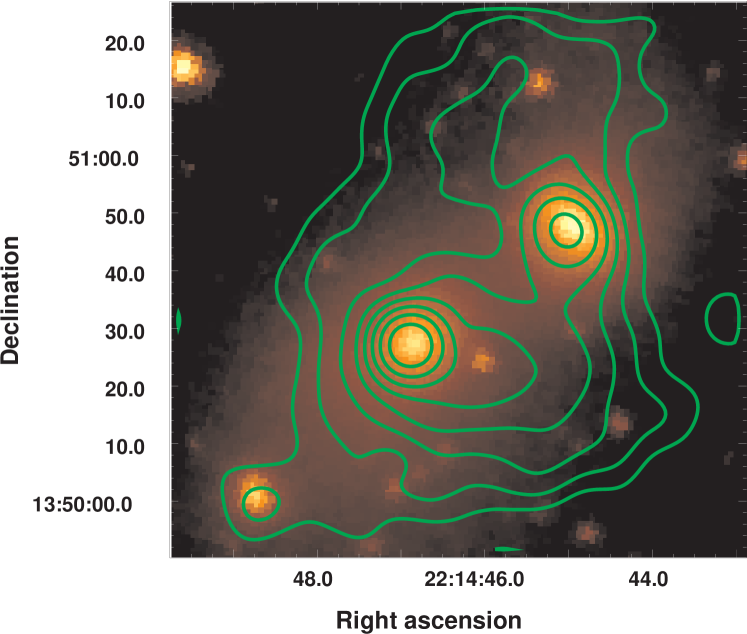
A pair of similar mass early-type galaxies, NGC 7236 and NGC 7237, lie between the radio lobes of 3C 442A. Borne & Hoessel (1988) provide strong evidence that these two galaxies, which are a part of group containing also a fainter member, are undergoing a merger, and an interaction model for the binary system is fitted to the data by Borne (1988).
Our ROSAT HRI observation of 3C 442A showed extended emission elongated in the NS direction and lying between the two lobes (Hardcastle & Worrall, 1999), but the relatively low sensitivity of the observation and the lack of X-ray spectral information prevented the physical relationship between the gas and radio plasma from being addressed. This has been corrected through a deep Chandra observation of the source. In this letter we show that X-ray gas is pressing on and separating the lobes of the radio galaxy. A more complete discussion of the X-ray gas, including that surrounding the lobes and the filamentary small scale structure, is presented elsewhere (Hardcastle et al., 2007).
The average recession velocity of the galaxy pair NGC 7237 and NGC 7236 (Borne & Hoessel, 1988) leads to a redshift of for 3C 442A. We adopt values for the cosmological parameters of km s-1 Mpc-1, , and . Thus 3C 442A is at a luminosity distance of 119 Mpc, and 1 arcsec corresponds to 546 pc at the source. J2000 coordinates are used throughout. Uncertainties are for one interesting parameter unless otherwise stated.
2. Observations
| OBSID | Date | Duration (ks) | CCD ChipaaNGC 7237 on this chip. | shift (arcsec)bbAstrometric correction to align X-ray nucleus to the radio core in NGC 7237, mostly in declination. |
|---|---|---|---|---|
| 5635 | Jul 27, 2005 | 27.006 | I0 | 0.495 |
| 6353 | Jul 28, 2005 | 13.985 | I0 | 0.594 |
| 6359 | Oct 7, 2005 | 19.883 | I2 | 0.373 |
| 6392 | Jan 12-13, 2006 | 32.694 | I0 | 0.151 |
We observed 3C 442A in VFAINT data mode with a front-illuminated CCD chip of the Advanced CCD Imaging Spectrometer (ACIS) on board Chandra. Chips I0, I1, I2, I3 and S2 were turned on for the observation which was broken into four intervals (Table 1) and taken in full-frame mode with a readout time of 3.14 seconds. The data have been re-processed with random pixelization removed following the software ‘threads’ (http://cxc.harvard.edu/ciao) from the Chandra X-ray Center (CXC). We used vfaint cleaning and the recommended procedure (M. Markevitch 2006, ACIS background cookbook available from http://cxc.harvard.edu) of including events with status flag 5 set as bad, to preserve flux close to the CCD node boundaries and other bad pixels. This is particularly important for the third observation where NGC 7237 lies on bad pixels. Only events with grades 0,2,3,4,6 are used in our analysis. Results presented here use ciao v3.3.0.1 and the caldb v3.2.3 calibration database.
The background count rate was steady through the four observations. Small astrometric corrections consistent with Chandra’s absolute aspect uncertainties were made to each data set to register the X-ray nucleus of NGC 7237 to the radio core whose position measured from archival 4.8-GHz VLA B-array data using standard AIPS procedures is 22h 14m 46, . The dates, durations, CCD chips in which NGC 7237 was contained, and sizes of the astrometric corrections for each observation are given in Table 1. The merged data set is of duration 93.568 ks. For spectral analysis we created appropriate response files for the separate observations and fitted the four data sets to models in common.
To investigate the radio structure we use 1.375-GHz VLA archival data from programme AC131 (Comins & Owen, 1991). For the regions around NGC 7236 and NGC 7237 we reduced the B-array data using AIPS. Our image has a 4-arcsec FWHM restoring beam and a pixel size matched to Chandra. For the large-scale structure we have used the smoothed version of the combined B, C and D-array image of Comins & Owen (1991) provided by J.P. Leahy at http://www.jb.man.ac.uk/atlas/, which has a 7.5-arcsec FWHM restoring beam. We have mapped the X-ray events directly onto the radio grids and applied exposure corrections before combining the images from the four Chandra observations when comparing the radio and X-ray images.
3. Morphology
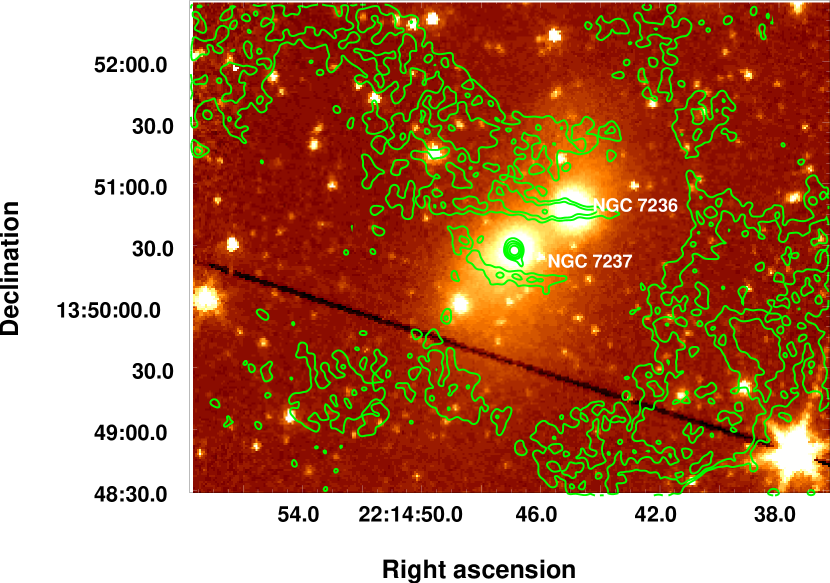
As seen from Figure 1, the dominant X-ray emission is diffuse, extending a few arcmin and elongated in a roughly NS direction. The high spatial resolution and high sensitivity of the Chandra data separates emission from NGC 7236 and NGC 7237 and a third galaxy in the NW-SE chain (see Fig. 2 for their locations). The inner X-ray emitting gas has a distinctly higher surface brightness than larger-scale emission that provides the background for the contours shown in Figure 1.
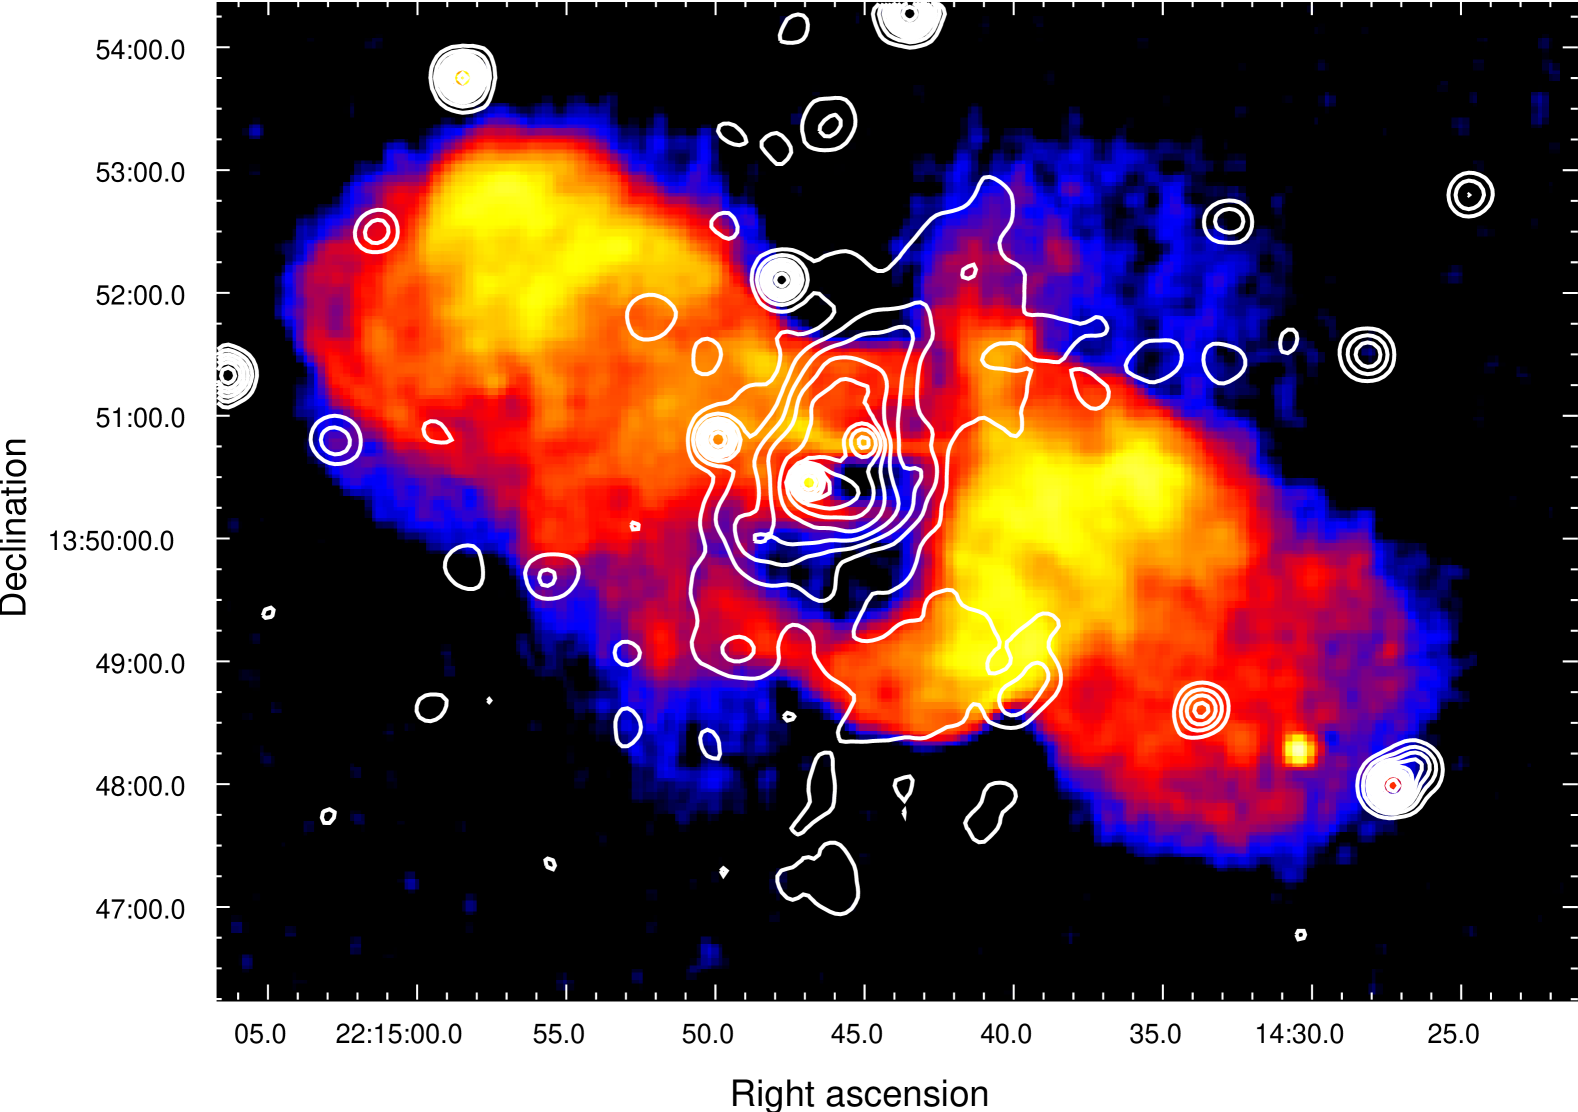
Despite the elongated nature of the X-ray distribution, a radial profile gives a good indication of the gas properties, and is commonly used in the analysis of group and cluster X-ray emission. We measure the component of most interest, the emission between the radio lobes, by constructing a radial profile out to 2 arcmin from NGC 7237, masking other discrete sources and using exposure-corrected background from a rectangular region between 3.6 and 5.7 arcmin to the NW which is observed in all four observations. The result for X-rays between 0.3 and 5 keV is shown in Figure 3. NGC 7237 is not precisely positioned at the optical aim point in the four observations, giving different point spread functions (PSFs). For simplicity, we defer investigation of NGC 7237 (see Hardcastle et al., 2007) and use an on-axis PSF convolved with a model of very small core radius to fit the inner component. The outer component gives a reasonable fit to a convolved model with best-fit values , arcsec (15.5 kpc), which is small for a normal group, and much less than the scale of the group component on which this component is superimposed (Fig. 3 and Hardcastle et al., 2007).

4. Gas Properties
The temperature of the bright gas has been measured by extracting counts from a arcmin2 rectangular box placed within the outer contour of Figure 1, and avoiding point sources. The background region is as described in §3. The box was first placed north of NGC 7236, and then south of NGC 7237. The data were fitted to an absorbed thermal model, and the parameter values for the north and south locations were in good agreement. No significant improvement in the fits were obtained when the absorption was allowed to vary from the Galactic column density of cm-2 obtained from the colden program provided by the CXC and based on the data of Dickey & Lockman (1990). The combined data from the two regions fit a thermal emission model of keV with abundances of solar ( uncertainties for 2 interesting parameters; for 51 degrees of freedom).
We use the equations of Birkinshaw & Worrall (1993) to deproject the -model X-ray surface-brightness profile (containing roughly 5000 counts out to a radius of 90 arcsec) and combine it with our spectral results to form a pressure distribution. At a radius of 1 arcmin, roughly corresponding to the position of inner contact between the gas and the radio-lobe plasma, the pressure is dynes cm-2, where uncertainties are calculated as described in Worrall & Birkinshaw (2001) and are dominated by the uncertainty in the abundances. Our merger explanation for the gas (see below) makes it likely that this is an underestimate of the total force felt by the lobes, because the kinetic energy density of the gas has not yet entirely dissipated. The total gas mass is M⊙.
5. Discussion
While the component of group gas around 3C 442A has no unusual characteristics, the extra component of inner gas is remarkable. We believe this gas is the result of the ongoing merger between NGC 7236 and NGC 7237, and was responsible for disrupting what was once a rather ordinary radio galaxy emanating from either NGC 7236 or NGC 7237. The data support a picture in which, for about years since the gas spheres overlapped, the lobes have been riding on the pressure front of the merger gas which has been sweeping them apart.
If the reverse situation applied, and the radio lobes were overpressured as compared with the inner gas, we should expect to see morphological evidence for the influence of the lobe on the gas, one example being a shock, as in the SW inner lobe of Cen A (Kraft et al., 2003), although here with the lobes expanding in towards the center. That is not seen. Instead, the morphological appearance is rather of the gas separating the radio lobes, i.e., with the inner radio contours being sharp and concave (rather than the normal lobe case of being convex), as is particularly clear for the W lobe (Fig. 2).
Although the pressure of the gas touching the inner edges of the lobes is well measured by the Chandra data as dynes cm-2, the pressure inside the lobes, which on our interpretation cannot be higher, is more uncertain. Pressure estimates in radio lobes require assumptions about the departure from particle and magnetic-field energy equipartition, filling factors, and extrapolations of the observed radio spectrum to infer the energy of the radiating (and non-radiating) particles. Comins & Owen (1991) estimate dynes cm-2 for the pressure assuming equal energy in electrons, protons, and magnetic field (we agree). If the lobe pressure were indeed this low, then the lobes would be under-pressured even with respect to the gas component at larger ( arcmin) radii, evident at the extremities of the radial profile in Figure 3, and so would be collapsing. Comins & Owen (1991) noted the filamentary nature of the radio structure (Fig. 2) which they compared with the filamentation in the Crab nebula, and suggested that the internal pressure should be raised by a factor of 4–5 once the low filling factor is taken into account. There is much scope for raising the lobe pressure, while still keeping it underpressured with respect to the inner gas.
In addition to the pressure-driven expansion of the gap between the lobes, we expect old radio lobes to be of low density, and hence buoyancy could also help to separate the lobes. Since the pressure front at the edge of the merger gas will be moving outwards at the sound speed, while buoyant motion involves large-scale circulation that is only subsonic, we expect the inner edges of the lobes to be defined by the pressure front around the merger gas. The morphology of the inner edge of the W radio lobe supports this view, since it does not resemble a buoyant plume.
We suggest that the merger between NGC 7236 and NGC 7237 created the keV gas envelope around the two galaxies by heating the atmospheres of two gas-rich elliptical galaxies. The total gas mass of M⊙ is rather high for the combined galaxy gas alone, and suggests a contribution from group gas originally around one or both of NGC 7236 and NGC 7237, as supported by the presence of the large-scale gas component in the system (see Hardcastle et al., 2007). We note, however, that M⊙ coronae have been measured in isolated elliptical galaxies. NGC 4555 is such a case (O’Sullivan & Ponman, 2004), and shows sub-solar abundances as we find in 3C 442A. However, NGC 4555 is a somewhat more massive galaxy than either major galaxy in 3C 442A, with a velocity dispersion of km s-1 (Wegner et al., 2003), as compared with km and km s-1 (Tonry & Davis, 1981) for NGC 7236 and NGC 7237, respectively.
The sound-crossing time in the gas between the lobes is years. This would be the time scale on which the radio lobes are being separated by the gas between them, and it gives an approximate date for the violent phase of the merger that would have heated the gas. This is consistent with the prominent large-scale stellar merger fans (Borne & Hoessel, 1988, Figs. 2 & 4, Birkinshaw et al., in preparation) which are typically visible for years (van Dokkum, 2005).
Partial ram-pressure stripping of gas in ellipticals due to their motion within a cluster or group atmosphere is commonly reported (e.g., Sun et al., 2007). In 3C 442A the properties of the inner gas suggest a more violent galaxy-galaxy encounter. In the modelling of Borne (1988) the galaxy centres passed within 8 kpc of one another about years ago, so their gas spheroids would have interacted strongly. In such an encounter, most of the gas in the two galaxies would have been extracted and added to the center of the group after the heating that would have resulted from the dissipation of kinetic energy. This would have expanded into, and mixed with, the hotter ambient group gas. The gas trails behind the galaxies, seen in Fig 4 and discussed more fully in Hardcastle et al. (2007), lend support to this picture. As the new gas-component expands, it pushes the lobes apart. In this picture, the radio filaments lying within the gas (Fig. 2) are small pieces of the radio lobes (or extinct jets) that have been engulfed and crushed by the central gas.
The internal energy of the gas between the lobes is ergs, which is more than the energy radiated by the radio source since the merger ( ergs in years: Comins & Owen, 1991), and % of our estimate of the energy in the lobes, and so it is likely that some of the lobe brightness, particularly in the inner W lobe, is due to compression caused by the central gas. The X-ray gas is thus a source of energy that may re-excite electrons in the lobes through adiabatic heating, and which will raise the radio brightness of the lobes. Similar compressions of radio-emitting plasma may be responsible for re-energizing particles in cluster radio relic sources. The inner radio lobes of 3C 442A may be sites where this process can be studied closely in a case, like some radio relics, where strong shocks are not apparent (e.g., Feretti & Neumann, 2006).
In summary, the inner gas of 3C 442A is a distinct component, which can be separated from ambient larger-scale group gas. Our view is that the gas of NGC 7236 and NGC 7237 has merged as a result of a close encounter, and that the dissipation of kinetic energy has heated this gas at the same time as it mixes with the ambient (hotter) group medium. This central gas is overpressured with respect to the radio lobes whose jets may have ceased at about the time of, and possibly as a result of, the merger. The pressure-driven expansion of the merger-liberated gas is compressing and separating the lobes, and may be re-exciting electrons in the lobe plasma through adiabatic heating.
References
- Birkinshaw & Worrall (1993) Birkinshaw, M., & Worrall D.M. 1993, ApJ, 412, 568
- Birkinshaw, Laing & Peacock (1981) Birkinshaw, M., Laing, R.A., & Peacock, J.A. 1981, MNRAS, 197, 253
- Borne (1988) Borne, K.D. 1988, ApJ, 330, 61
- Borne & Hoessel (1988) Borne, K.D., & Hoessel J.G. 1988, ApJ, 330, 51
- Comins & Owen (1991) Comins, N.F., & Owen F.N. 1991, ApJ, 382, 108
- Dickey & Lockman (1990) Dickey, J.M., & Lockman, F.J. 1990, ARA&A, 28, 215
- Feretti & Neumann (2006) Feretti, L., & Neumann, D.M. 2006, å, 450, L21
- Hardcastle & Worrall (1999) Hardcastle M.J., & Worrall D.M. 1999, MNRAS, 309, 969
- Hardcastle et al. (2007) Hardcastle M.J., Kraft R.P., Worrall, D.M., Croston, J.H., Evans, D.A., Birkinshaw, M., & Murray, S.S. 2007, ApJ, submitted
- Jones et al. (2007) Jones, C., Forman, W., Vikhlinin, A., Markevitch, M., Machacek, M., & Churazov, E., 2007, in A Pan-Chromatic View of Clusters of Galaxies and the Large-Scale Structure, ed. M. Plionis & O. Lopez-Cruz (Berlin: Springer Verlag), in press
- Kraft et al. (2003) Kraft, R.P., Vázquez, S., Forman, W.R., Jones, C., Murray, S.S., Hardcastle, M.J., Worrall, D.M., & Churazov, E. 2003, ApJ, 592, 129
- O’Sullivan & Ponman (2004) O’Sullivan, E., & Ponman, T.J. 2004, MNRAS, 354, 935
- Sun et al. (2007) Sun, M., Jones, C., Forman, W., Vikhlinin, A., Donahue, M., & Voit, M. 2007, ApJ, in press
- Tonry & Davis (1981) Tonry, J.I., & Davis, M. 1981, ApJ, 246, 666
- van Dokkum (2005) van Dokkum, P.G. 2005, AJ, 130, 2647
- Wegner et al. (2003) Wegner, G. et al. 2003, AJ, 126, 2680
- Worrall & Birkinshaw (2001) Worrall D.M., & Birkinshaw, M. 2001, ApJ, 551, 178