Dust and Atomic Gas in Dwarf Irregular Galaxies of the M 81 Group: The SINGS and THINGS view.
Abstract
We present observations of the dust and atomic gas phase in seven dwarf irregular galaxies of the M 81 group. The far–infrared data have been obtained as part of the ‘Spitzer Infrared Nearby Galaxies Survey SINGS’. Maps of the distribution of atomic hydrogen (HI) have been obtained through ‘The H i Nearby Galaxy Survey THINGS’. The Spitzer observations provide a first glimpse of the nature of the non–atomic ISM in these metal–poor (Z0.1 Z⊙), quiescent (SFR0.001–0.1 M⊙ yr-1) dwarf galaxies. Dust emission is detected in five out of the seven targets (the two systems with the lowest star formation rates are non–detections). Most detected dust emission is restricted to H i column densities cm-2 and almost all regions of high H i column density ( cm-2) have associated dust emission. Spitzer spectroscopy of two regions in the brightest galaxies (IC 2574 and Holmberg II) show distinctly different spectral shapes. The spectrum of IC 2574 shows aromatic features that are less luminous (relative to the FIR luminosity) compared to an average SINGS spiral galaxy by a factor ot . The aromatic features in Holmberg II (which has only a slightly lower gas–phase metallicity) are fainter than in IC 2574 by an order of magnitude. This result emphazises that the strength of the aromatic features is not a simple linear function of metallicity. Whereas the H i masses are well-constrained, model dependencies make it difficult to measure the dust masses with a high degree of confidence. We estimate dust masses of 104– M⊙for the M 81 dwarf galaxies, resulting in an average dust–to–gas ratio (Mdust/M) of ( if only the H i that is associated with dust emission is considered); this is an order of magnitude lower than the typical value derived for the SINGS spirals. The dwarf galaxies are underluminous per unit star formation rate at 70m as compared to the more massive galaxies in SINGS by a factor of . However, the average 70 m/160 m ratio in the sample dwarf galaxies is higher than what is found in the other galaxies of the SINGS sample. This can be explained by a combination of a lower dust content in conjunction with a higher dust temperature in the dwarfs (likely due to the harder radiation fields in the low metallicity environments).
Subject headings:
galaxies: dwarf — galaxies: irregular — galaxies: ISM — infrared: galaxies — galaxies: individual (Ho II, M 81 dwA, DDO 53, Ho I, M 81 dwB, IC 2574, DDO 165)1. Introduction
Nearby dwarf galaxies have proven to be ideal laboratories to investigate how stars form out of gas and how, in turn, violent star formation shapes the ambient interstellar medium (ISM). These systems are highly susceptible to the formation of shells and holes in the neutral gas phase; more energetic star formation can lead to the formation of gaseous outflows from these systems. Previous studies have shown that dwarf galaxies can be used as testbeds of ‘simple’ prescriptions for star formation (since these systems are typically in solid–body rotation and are therefore less affected by shear in the ISM) and for understanding the connection between mechanical energy input into the ISM (‘feedback’) and future star formation. Given their low metallicities, they also provide a unique opportunity to study the conditions of the ISM in environments that may resemble those in the earliest starforming systems at high redshift.
| Galaxy | Da | FHI | MHI | log(F(H))bbH fluxes are from Kennicutt et al. 2006, Lee 2006 | 12+log(O/H)ccCharacteristic gas phase oxygen abundances from Moustakas et al. 2007, based on the Pilyugin & Thuan 2005 strong–line calibration of R23=([OII]+[OIII])/H; 12+log(O/H)⊙=8.7 (Asplund et al. 2004). | S(24 m)ddFlux densities adopted from Dale et al. 2006. | S(70 m)ddFlux densities adopted from Dale et al. 2006. | S(160 m)ddFlux densities adopted from Dale et al. 2006. |
|---|---|---|---|---|---|---|---|---|
| (Mpc) | (Jy km s-1) | (108 M⊙) | (erg s-1 cm-2) | (Jy) | (Jy) | (Jy) | ||
| IC 2574 | 4.02 | 386.7 | 14.75 | -11.27 | 7.940.06 | 0.280.013 | 5.550.42 | 11.751.50 |
| Holmberg II | 3.39 | 219.3 | 5.95 | -11.30 | 7.680.03 | 0.200.008 | 3.670.26 | 4.460.58 |
| Holmberg I | 3.84 | 40.1 | 1.40 | -12.43 | 7.540.34 | 0.0130.002 | 0.410.08 | 0.900.17 |
| DDO 165 | 4.57 | 35.0 | 1.72 | -12.93 | 7.760.18d | 0.014 | 0.15 | 0.33 |
| DDO 053 | 3.56 | 20.0 | 0.60 | -12.24 | 7.770.1 | 0.0290.001 | 0.400.03 | 0.500.11 |
| M 81 DwB | 5.3 | 3.8 | 0.25 | -12.82 | 7.850.17 | 0.0090.001 | 0.150.03 | 0.390.18 |
| M 81 DwA | 3.55 | 4.1 | 0.12 | – | – | 0.002 | 0.17 | 0.15 |
Based on their ISM properties, dwarf galaxies can be roughly divided into two subgroups: gas-rich dwarf irregulars (dIrrs) and gas-poor dwarf spheroidals/ellipticals (dSph/dE). The gas-rich dIrrs are particularly interesting for studies of current star formation, since they still contain the ‘fuel’ for star formation. Though many studies have shown that these objects are rich in atomic hydrogen (H i; for a review see Skillman 1996), little is known about their molecular gas properties. Many searches for molecular gas (through observations of the most abundant tracer molecule, CO) have been performed but very few dwarf galaxies have been detected in CO so far: no dwarf has been detected in CO at metallicities 10% Z⊙ (Taylor et al., 1998; Barone et al., 2000; Leroy et al., 2005).
Similarly, little is known about the dust properties in faint, low metallicity dwarf galaxies. Some of the brightest dwarfs have been detected with previous far-infrared (far-IR) observatories such as IRAS and ISO (see, for example, Hunter et al. 1989, Gallagher et al. 1991, Melisse & Israel 1994a,b, Hunter et al. 2001). These early studies found that dwarfs typically have higher dust temperatures than those derived for more massive galaxies, with the peak of the infrared spectral energy distribution (SED) shifted to shorter wavelengths.
The more typical ‘quiescent’ dIrr galaxies (with SFR0.1 M⊙ yr-1) had remained undetected in the far–IR prior to the advent of the Spitzer Space Telescope; its dramatically increased sensitivity compared to previous observatories has opened up the low-metallicity regime of the extragalactic ISM to exploration in the far-IR. Early Spitzer observations have naturally concentrated on the brightest and most extremely metal-poor dwarfs. Houck et al. (2004) show that SBS 0335052, one of the most metal-poor dwarf galaxies known, has an exceptional SED that is shifted blueward with a peak at 28 m (compared to 80 m for more metal-rich starburst galaxies and 100 m for local star-forming spirals). Engelbracht et al. (2004) presented observations of the dwarf galaxy NGC 55, and a larger sample of galaxies showed that there is a metallicity threshold above which emission from aromatic features appear (Engelbracht et al., 2005). Smith et al. (2006) used Spitzer spectroscopy to study how the spectral signatures of aromatic features change as a function of metallicity. Other recent Spitzer studies of actively star forming dwarf galaxies include spectroscopic observations by Wu et al. 2006 and O’Halloren et al. 2006 and imaging studies of star–forming dwarfs and Local Group galaxies (including dwarf galaxies) by Rosenberg et al. 2006 and Jackson et al. 2006. Cannon et al. 2005, 2006a,b have presented detailed Spitzer studies of some of the most luminous and nearby dwarfs (IC 2574, NGC 1705, and NGC 6822). These case studies have shown that localized star formation has dramatic effects on the multiphase ISM, altering the relative strengths of nebular, far-IR dust, and radio continuum emission.
Here we discuss the distribution of dust and atomic hydrogen in seven dwarf irregular galaxies in the M 81 group of galaxies. Our sample spans two orders of magnitude in H i masses and a similar range in star formation rates, from M⊙ yr-1 (H non–detections) to 0.1 M⊙ yr-1. The general properties of the sample dwarfs are summarized in Table 1. All these dwarf irregular galaxies are part of the ‘ Spitzer Infrared Nearby Galaxies Survey’ (SINGS, see Kennicutt et al. 2003) and have also been included in ‘The H i Nearby Galaxy Survey’ (THINGS, Walter et al. 2005).
This paper is organized as follows: in § 2 we summarize the Spitzer MIPS and the VLA H i observations; in § 3 we present our results, i.e. the distribution of the atomic gas and the dust, IRS spectra of two galaxies, estimates of the dust masses and a comparison to other galaxies in the SINGS sample. In § 4 we present a summary of our study.

2. Observations
2.1. Spitzer MIPS Observations
The 24, 70, and 160 m data were taken with MIPS on the Spitzer Space Telescope as part of the SINGS survey (Kennicutt et al. 2003). The observations were obtained using the scan-mapping mode in two separate visits to each galaxy (facilitating removal of asteroids and detector artifacts). Each pixel in the map was observed 40, 20, and 4 times at 24, 70, and 160m, respectively, resulting in integration times per pixel of 160, 80, and 16 s, respectively. All MIPS data were processed using the MIPS Instrument Team Data Analysis Tool (Gordon et al., 2005). Systematic uncertainties (e.g., detector nonlinearities, time-dependent responsivity variations, background removal, etc.) limit the absolute flux calibration to 4%, 7% and 12% in the MIPS 24 m, 70 m and 160 m bands. The FWHM of the MIPS PSFs are 6″, 18″, and 40″ at 24m, 70m and 160 m, respectively. For more details on the MIPS data reduction see Bendo et al. (2006) – for a general description of the SINGS observing strategies see Kennicutt et al. (2003).
The flux densities presented in this paper were derived for apertures much larger than the MIPS PSFs, and therefore aperture corrections have not been applied. The M 81 group is located in a direction where the Galaxy is rich in infrared cirrus (de Vries et al., 1987). Inspection of individual images reveals that Galactic cirrus emission is indeed present in the longer wavelength MIPS images. However, this emission is distributed over much larger angular scales than the sources of interest and can thus be easily separated from the galaxies presented in this study.
The aperture for each individual galaxy has been chosen carefully to encompass all the emission visible in all three MIPS bands; apertures were compared with IRAC band 1 and H i imaging to ensure that the total galaxy extent (i.e., gas and stars) was measured. For each individual galaxy, we used the same aperture to extract the flux densities from the three MIPS bands. To account for the variations in the background (both instrumental and due to Galactic Cirrus) we have defined multiple background regions for each galaxy that contain the same area as the target aperture. The (background subtracted) source flux densities we derived using this technique are the same (within the errors) as the values derived by Dale et al. 2005, 2006 in their study of the entire SINGS sample. For consistency we therefore adopt the values of Dale et al. 2006 for our study. The global flux densities are summarized in Table 1 — note that M 81 dwA and DDO 165 are MIPS non–detections. The reader is referred to Dale et al. 2006 for the IRAC flux densities of the dwarf galaxies in our sample.
2.2. VLA Observations
H i data for six of the seven M 81 group dwarfs presented here were obtained as part of ‘The H i Nearby Galaxy Survey’ (THINGS), a survey to obtain high-resolution NRAO111The National Radio Astronomy Observatory is a facility of the National Science Foundation operated under cooperative agreement by Associated Universities, Inc. VLA H i imaging for 35 nearby galaxies (Walter et al., 2005). H i data for DDO 165 were taken from Cannon et al. (in prep.).
For THINGS, each galaxy was observed with the VLA in D, C and B configurations with typical integration times of 1.5 hours, 2.5 hours and 7 hours, respectively. The calibration and data reduction were done using the AIPS package222The Astronomical Image Processing System (AIPS) has been developed by the NRAO.. The absolute flux scale for the data was determined by observing the quasar 3C286 in all observing runs. The time variable phase and amplitude calibration were done using the nearby, secondary calibrators 1313549 and 1252565 which are unresolved for the arrays used. The uv-data were inspected for each array and bad data points due to either interference or cross-talk between antennae were removed, after which the data were calibrated. After final editing, all data for each target were combined to form a single dataset which was subsequently used to create maps of the brightness distribution on the sky as a function of frequency/velocity (data cubes).
In order to remove the continuum from the line data we first determined the line-free channels in our observations and subtracted the continuum emission in the uv-plane. After that, datacubes (1024 1024 pixels 80 channels each) were produced using the task imagr in AIPS. To boost the angular resolution while still maintaining a reasonable noise, we use a robust parameter of 0.5 for the final imaging. To ensure that we reach identical beam sizes for all THINGS observations, the data were subsequently convolved to a common resolution of 10. This resulted in a typical rms noise per channel of 0.5 mJy beam-1 for a 2.5 km s-1 channel (corresponding to NHI=1.51019 cm-2). To separate real emission from noise in the final integrated H i maps, we only consider regions which show emission in consecutive channels above a set level () in slightly convolved (20′′) cubes. Note that the data for DDO 165 are at a resolution of 21″.
The fluxes in the integrated THINGS H i map are corrected for the fact that typically the residual flux of the source in cleaned channel maps is overestimated (sometimes by a factor of a few) due to the different beam sizes of the dirty and cleaned beams (for details see, e.g., Jörsäter & van Moorsel 1995, Walter & Brinks 1999). In the integrated H i maps this typically leads to flux corrections of order 25–40%. To correct for this, we have scaled the residual fluxes by the ratio of the dirty and clean beam sizes and estimate that our column densities are correct within 10% (including the intrinsic uncertainties of the flux calibration; the inferred H i masses are given in Table 1).

3. Dust and H i Characteristics
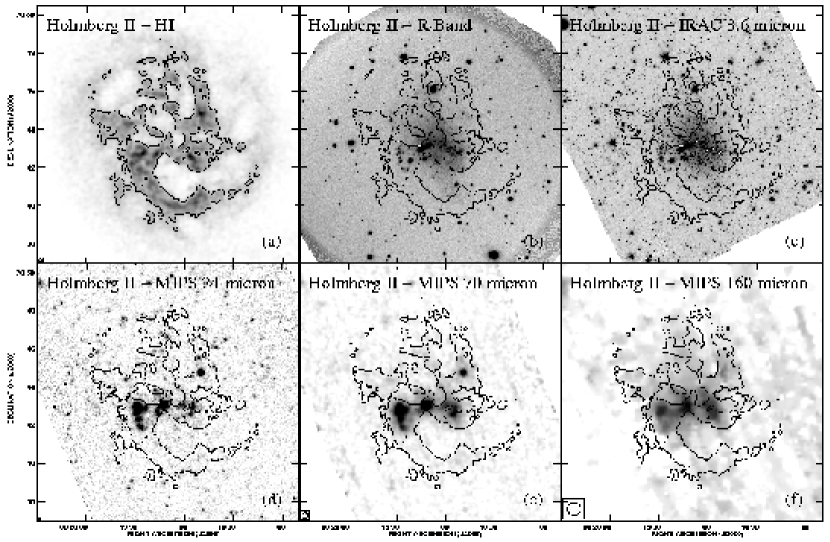
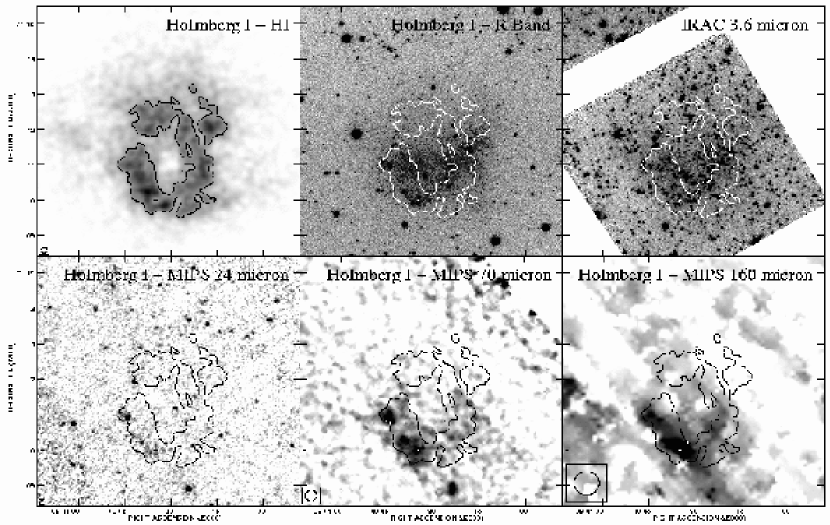
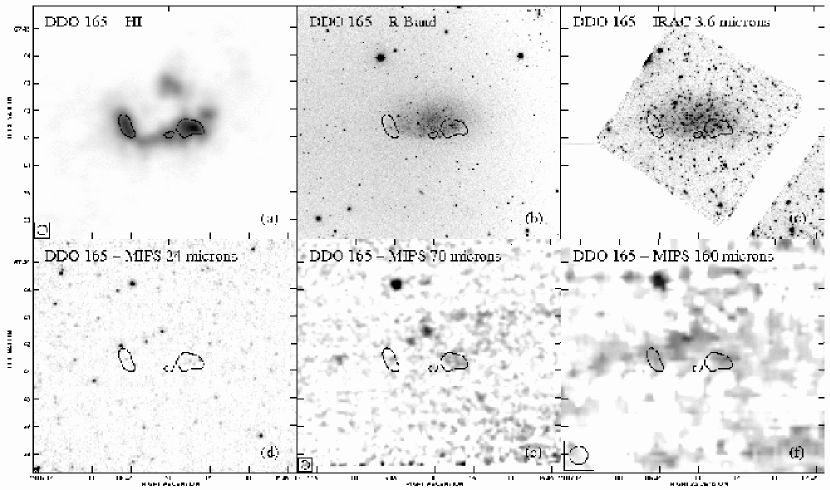
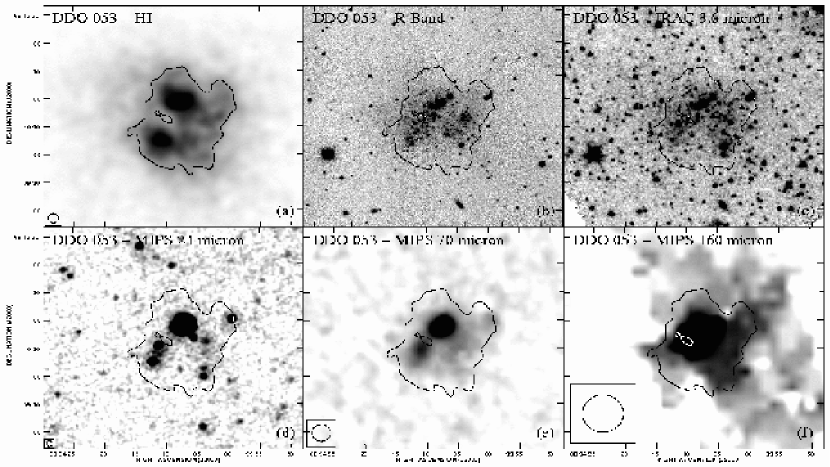
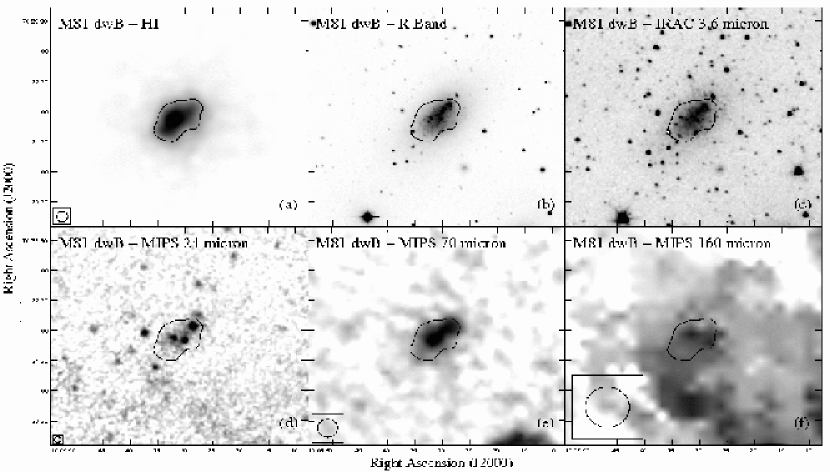
In Figs. 1–7 we present images of the individual galaxies (in order of decreasing H i mass). For each galaxy, we show six panels: (a) is the integrated THINGS H i map at 10 resolution (only exception: DDO 165 beamsize: 21′′); unless otherwise stated, one H i contour is drawn at NHI=1 cm-2 (i.e., close to the canonical star formation threshold, e.g., Skillman 1996). An optical R–band and the Spitzer IRAC band 1 (3.6 m) image of the galaxies are shown in panels (b) and (c) (the optical images have been observed either at the Calar Alto 2.2 m telescope or are taken from the ancillary SINGS data archive). Panels (d), (e) and (f) are the MIPS 24, 70 and 160 m images of the same area. All panels show the same H i contour as presented in the first panel. The beamsizes for both the H i and MIPS images are shown in the lower left of the respective images.
For each galaxy with THINGS H i imaging, we compare the radial profiles of the H i, 70 m and 160 m MIPS images in Fig. 8 (as discussed for the individual systems below). The deprojection parameters (inclination, position angle) used for the creation of the radial profiles have been derived from the H i maps (see caption Fig. 8).
In the following, we briefly discuss the individual galaxies:
IC 2574 (Fig. 1): IC 2574 is the largest galaxy in our sample and its H i morphology is dominated by the presence of H i holes (Walter & Brinks 1999). The brightest region in the MIPS bands is the supergiant shell (SGS) region in the north-east (Walter et al. 1998); a spatially resolved Spitzer case study of this SGS region is presented in Cannon et al. 2005. The elevated emission toward the south–east corner in the 160 m image is caused by Galactic Cirrus emission (but this emission can be separated from the emission of IC 2574). Dust emission traced by the 70 m emission is detected out to galactocentric radii of 7′ (7 kpc, see Fig. 8).
Holmberg II (Fig. 2): The distribution of H i in Holmberg II is also characterized by the presence of numerous H i holes (Puche et al., 1992). As in the case of IC 2574, the changing morphologies in the individual MIPS bands and the corresponding changing spectral energy distributions stress the importance of local effects in characterizing the far–infrared emission (e.g., Cannon et al. 2005). The radial surface brightness profiles (Fig. 8) show that dust is detected out to at least 4′ (4 kpc).
Holmberg I (Fig. 3): The H i distribution in Holmberg I is characterized by one giant H i hole (Ott et al., 2001). The H i structure encompasses the optical emission and faint star formation is present on the rim toward the south–east (see also Sec. 3.4). This is the region where faint emission is detected in all three MIPS bands. At 70 m, there is also diffuse emission present toward the western H i rim (though this emission is of very low S/N).
DDO 165 (Fig. 4): DDO 165 shows extended emission in both the H i and the optical, but is not detected in the MIPS bands. The brightest emission seen in the 70m and 160m bands (toward the north) is a background galaxy (SDSS J130639.44+674456.4 at z=0.139). There is some emission seen at 24 m and 70 m toward the centre of DDO 165 (not coincident with the peak of the H i emission, and outside the main optical body of DDO 165) – future, higher sensitivity observations (MIPS and H i) are needed to see if this emission is indeed physically related to DDO 165. Note that DDO 165 has one of the lowest star formation rates in our sample.
DDO 53 (Fig. 5): The H i distribution shows two peaks, and the galaxy is detected in all three MIPS bands: The brightest emission seen at 24 m is associated with the northern and southern H i peak; the northern region is also the strongest in the 70 m image. The 160 m data are noisy, but 160 m emission is still present in the regions seen in the 70 m image. The compact nature of DDO 53 is also evidenced by the radial surface brightness profiles shown in Fig. 8.
M 81 dwB (Fig. 6): M 81 dwB is the galaxy with the lowest measured star formation rate in our sample. The galaxy shows a compact structure in H i and the MIPS bands (cf. Fig 8). The detection at 160 m is marginal (see Tab. 1) and is surrounded by elevated background emission present.
M 81 dwA (Fig. 7): M 81 dwA is the faintest dwarf in our sample. Similar to Holmberg I, the H i distribution is characterized by one large H i shell which encompasses most of the optical galaxy. No ongoing star formation has been detected in M 81 dwA (Miller & Hodge, 1994); it is also a MIPS non–detection. This may be explained by the fact that H i column densities do not reach values higher than NHI=5 cm-2 in this galaxy (i.e. the H i column densities are below the canonical threshold for star formation).

3.1. HI Threshold for warm dust
From an inspection of the morphologies (Figs. 1–7) and radial profiles (Fig. 8) it is clear that the dust emission appears to be related to the distribution of the H i, at least to first order. To quantify this, we investigate if there is a certain H i threshold above which most of the dust emission is present. In the following, we use the 70 m data as a tracer for the warm dust emission as they are (unlike the 24 m data) not affected by the presence of contaminating point sources (stars and background objects) in the field. Furthermore, they have higher resolution and signal–to–noise than the 160 m measurements. In Figure 9, we plot histograms of the distribution of the 70 m flux density above a threshold of 1.8 MJy sr-1 (about the 5 level, i.e., encompassing most of the detected dust emission) as a function of H i column density for each galaxy (solid histogram). For each galaxy we also show the pixel–by–pixel distribution of all H i column densities (dashed histogram). From Fig. 9 (and the previous discussion on the relative distribution of H i and 70 m emission) we draw the following conclusions:
– Most of the detected 70 m emission is coincident with H i column densities of Ncm-2 (with a peak around cm-2). In the case of Holmberg I, the peak in the first histogram bin at low surface densities is spurious and a result of the lower signal–to–noise in these data.
– At high column densities (cm-2), the solid (70 m) and dashed (H i) histograms follow each other closely, implying that most of the high H i column density regions are associated with dust emission. In other words, there appear to be only few regions of high H i column densities that are not associated with warm dust emission.

3.2. IRS spectroscopy
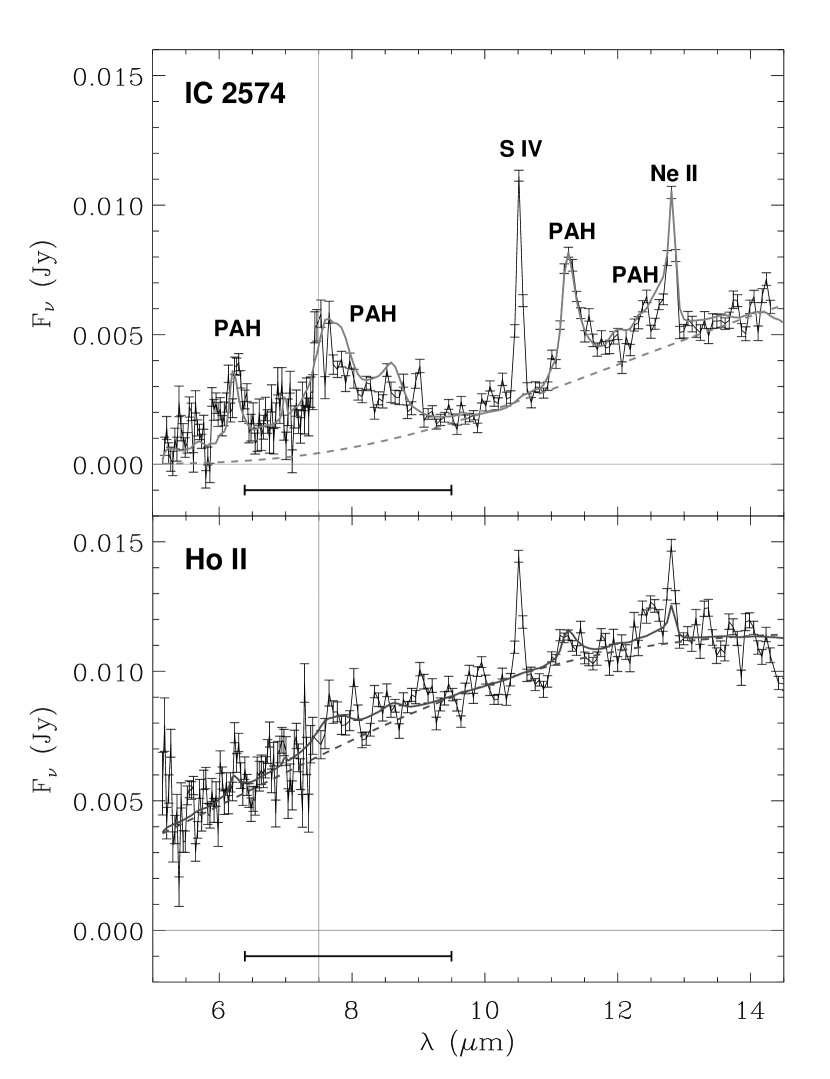
Selected regions in some of the galaxies in this sample have also been observed with the Spitzer IRS spectrograph (Houck et al. 2004) as part of SINGS. In the following we will discuss IRS 5–14m, low resolution spectra obtained for specific regions in the two most active galaxies in our sample, IC 2574 and Holmberg II (Fig. 10, both SFR0.1 M⊙ yr-1). The spectra have been extracted over a circular aperture of a diameter of 14 that was centered on the brightest region seen at 8 m in both galaxies (see the caption of Table 2 for coordinates). For comparison, Table 3 also summarizes some of the IRAC flux densities obtained for the same apertures.
3.2.1 IRS spectrum of IC 2574
The spectrum of IC 2574 (upper panel in Fig. 10) clearly shows the broad emission features from polycyclic aromatic hydrocarbons (PAHs) which are typically found in mid-infrared spectra of massive star–forming galaxies (e.g. Telesco 1988, Lu et al. 2003, Smith et al. 2006). To derive a simple template for the aromatic/PAH features, we have taken the IRS spectrum of the SINGS galaxy NGC 7552 (12+log(O/H)8.5, Moustakas et al. 2007, SFR7 M⊙ yr-1) which shows a typical spectrum with one of the highest signal–to–noise ratios in the SINGS sample (Smith et al. 2006). From this spectrum we subtracted a 200 K blackbody spectrum that has been normalized to the pseudo-continuum at 10 m and 13.5 m. This PAH template was then scaled to fit the PAH feature at 11.3 m in IC 2574 after a scaled blackbody spectrum of 200 K (shown as the dashed thick line) has been added (thick grey line, normalized in the same way as for NGC 7552). Although a blackbody is an unphysical representation of the dust continuum beneath the emission bands, this simple procedure allows us to compare the strength of the PAH bands in different sources in a consistent way. The relatively low signal–to–noise ratio of the spectrum prevents a full spectral decomposition (e.g., as done by Smith et al. 2006).
It is interesting to note that this simple template fits the spectrum of IC 2574 quite well to first order. Even though the S/N ratio is low, the 7.7m/11.3m PAH ratio in IC 2574 appears to be lower than in NGC 7552 – band–variations like that are known for many other galaxies (e.g., Draine & Li 2001, Vermeij et al. 2002, Cannon et al. 2006, see detailed discussion in Smith et al. 2006). Engelbracht et al. (2005) showed that there appears to be a metallicity threshold of 12+log(O/H)8.2 below which PAH emission is not detected in galaxies333Note that the oxygen abundances used by Engelbracht et al. (2005) were based on a heterogeneous compilation of measurements from the literature, whereas the abundances in our study have been derived self–consistently, and placed on a common abundance scale (see Moustakas et al. 2007 for details). The gas–phase metallicity of IC 2574 (Table 1) is slightly below their threshold – the fact that we do see PAH emission in IC 2574 is likely not due to metallicity variations within the galaxy (as no evidence of significant local metallicity variations has been found in dwarf galaxies; e.g., Kobulnicky & Skillman 1996, 1997), but rather due to to other factors that influence the aromatic feature emission (e.g., radiation field, geometry, elemental composition of the ISM).
Two bright emission lines are present as well in the spectra of IC 2574: [Ne II] emission at 12.8 m and [S IV] emission at 10.5 m. The latter line is not present in the template spectrum of NGC 7552 and indicates the presence of massive stars – this line is usually found to be faint in massive galaxies (e.g., see discussion in Rigby & Rieke 2004), but bright in the highly ionized gas of blue compact dwarfs (e.g., Madden et al. 2006).
3.2.2 IRS spectrum of Holmberg II
The IRS spectrum of Holmberg II (lower panel in Fig. 10) is markedly different from that of IC 2574; the spectrum is dominated by continuum emission, and only very faint PAH features are present. The thick grey line again shows the comparison to our simple template: Here two blackbody curves (one at 300 K and one at 700 K, contributing equal flux density at 8.3 m) were needed to adequately fit the continuum of Holmberg II (note again that these curves do not represent physically meaningful numbers but are only used to describe the shape of the continuum to first order, see also discussion in Smith et al. 2006); we then added a scaled version of our PAH template to this continuum emission (thick grey line). A comparison to this curve shows that, although the S/N is low, faint PAH features appear to be present at 6.2, 7.7, 11.3 and 12.7m– e.g., the 11.3m PAH feature is detected at 7 (total flux; peak: 4). From this it is clear that the PAH–to–continuum ratio in Holmberg II is much lower than in the case of IC 2574 as discussed below. We note that the gas–phase metallicity of Holmberg II (Tab. 1) is lower than in IC 2574 by nearly a factor of two (below the threshold derived by Engelbracht et al., 2005). This result emphazises the fact that the strength of the PAH features is not a simple linear function of metallicity (see also Smith et al. 2006, who find a wide range of PAH strengths (factor of 10) near the Engelbracht et al. threshold). As in the case of IC 2574, line emission from [Ne II] and [S IV] is detected in Holmberg II.
| Galaxy | F(8m) | F(6m) | F(3.5m) | F(8m)IRS/F(8m)IRAC | F(6m)IRS/F(6m)IRAC |
|---|---|---|---|---|---|
| mJy | mJy | mJy | |||
| IC 2574a | 3.10 | 1.39 | 0.73 | 0.89 | 0.95 |
| Holmberg IIa | 8.53 | 5.75 | 2.02 | 0.93 | 0.81 |
3.2.3 PAH–to–Continuum Ratios
Using our simple decomposition of the PAH features and the continuum emission, we can now constrain the PAH–to–continuum ratios for both galaxies. We do this for two bands: A) the IRAC band 4 (‘8 m band’), encompassing the broad PAH features at 7.7m and 8.6m (see horizontal line in Fig. 10 for the wavelength range covered by the 10% response of the IRAC band 4) and B) the PAH band at 11.3m (here integrated within a mock square filter between 10.8 and 11.8m). We also calculate the PAH–to–total IR luminosity ratios for both regions below (but note that the method employed here is not directly comparable to the one used in Smith et al. 2006).
IC 2574: From the IRS spectrum we derive a flux density of 2.7 mJy for the IRAC band 4 bandpass which is in good agreement with the value derived from the actual IRAC band 4 measurement (3.0 mJy, see Table 3). The continuum contribution is 0.7 mJy and the contribution from the PAH feautures is 2.0 mJy; i.e. we derive a PAH–to–continuum ratio for this spectral region of 2.9. For the 11 m feature we derive a ratio of 0.5 (continuum: 3.3 mJy, PAH: 1.7 mJy). Using our definitions for the 8m and 11m bandpasses and the total infrared (TIR) luminosities in this aperture (LTIR, derived from the MIPS images and using the relation in Dale & Helou 2002) we get the following ratios: LPAH,8μm/LTIR=0.0089, LPAH,11μm/LTIR=0.0011.
Holmberg II: From the IRS spectrum we derive a flux density of 7.9 mJy for the IRAC band 4 bandpass which is in good agreement with the value derived from the actual IRAC band 4 measurement (8.53 mJy, Table 3). The continuum contribution is 7.2 mJy, the contribution from PAHs is 0.7 mJy, leading to a PAH–to–continuum ratio of 0.1. For the 11 m feature the ratio is even lower, 0.02 (continuum: 10.4 mJy, PAH: 0.2 mJy). The corresponding ratios compared to the total infrared luminosity in this aperture are: LPAH,8μm/LTIR=0.0037, LPAH,11μm/LTIR=0.0002. Given the faintness of the PAH features in Holmberg II, these values are uncertain (by 50%).
For comparison, we also derive the PAH-to-continuum ratios for our template galaxy NGC 7552 and get flux density ratios of 6.3 and 0.9 for the IRAC4 and [10.8; 11.8] m bandpasses, respectively. For the TIR luminosities we get the following ratios for NGC 7552: LPAH,8μm/LTIR=0.070, LPAH,11μm/LTIR=0.0077; i.e. the ratio in IC 2574 is about a factor of 7 (Holmberg II: factor of 20) less than in our template galaxy (see Smith et al. 2006 for variations within the SINGS sample).


3.3. Global relations for the M 81 group dwarfs
In the following we will compare the properties found for the M 81 dwarf irregular galaxies to other galaxies in the SINGS sample (Kennicutt et al. 2003). To do so, we have divided the SINGS galaxies into four categories: the M 81 group dwarf irregular galaxies of this study (shown as filled circles in the following plots), other dwarf galaxies (open circles), elliptical/S0’s (open squares) and spiral galaxies (crosses). All MIPS flux densities for the SINGS galaxies are taken from Dale et al. (2006), and the gas–phase metallicities are taken from Moustakas et al. (2007, based on the Pilyugin & Thuan 2005 strong–line abundance calibration).
As there apparently exists some correlation between the H i and the 70 m emission (see discussion in the previous sections), we start by comparing the H i masses to the 70 m specific luminosity444In the following we plot the specific luminosities (units of W Hz-1). To derive the luminosities in a given MIPS band, this number needs to be multiplied by the effective bandwidth of the MIPS filter (in Hz). Note that some authors (e.g. Calzetti et al. 2005) define the luminosity as the specific luminosity times the observed frequency (in Hz). in Figure 11a. It is obvious that there is a large scatter between the two quantities (the dashed line indicates a linear relationship). If we plot the absolute blue magnitudes (MB, taken from Moustakas et al. 2007) as a function of the 70 m specific luminosity instead (Figure 11b), this relation gets tighter (dashed line). The larger scatter in the H i–70m relation is due to the fact that the dwarf irregular galaxies of our sample have more H i mass per blue magnitude compared to more massive spirals. This fact, i.e. that MHI/MB increases for dwarf irregular galaxies was noted long before (e.g., Skillman 1996).


As a next step, we plot the star formation rates (SFRs) of individual galaxies as a function of the 70 m specific luminosity (Fig. 12a). The SFRs were derived using SFR = L(H)/1.26 erg s-1 [M⊙ yr-1] (Kennicutt, 1998) (assuming solar metallicity and the Salpeter (1955) initial mass function between 0.1 and 100M⊙). L(H) is the H luminosity corrected for extinction within the galaxy. Here we use the relation derived for SINGS galaxies by Kennicutt et al. (2006) and Calzetti et al. (2006): F(H)corr=F(H)obs+0.035F’(24m). F(H)obs is the observed H flux (in erg s-1 cm-2, corrected for Galactic absorption and contribution from [N II]) taken from Kennicutt et al. 2006 and Lee 2006; F’(24m) is defined as F’(24m)=1.251013Hz F(24m)[Jy] (i.e. F(24m) multiplied by the observed frequency in Hz). SFRs were only derived for those SINGS galaxies for which accurate H measurements are available. The tighter relation between L(70m) and SFR (as compared to the MB– L(70m) relation discussed above), can (to first oder) be explained by the fact that, typically, 70m is close to the peak of the FIR emission and thus is a measure of the total bolometric luminosity which is expected to scale with the SFR.
However, from Figure 12(a) it is also obvious that the galaxies do not follow a linear relation over all luminosities (as indicated by the dashed line). To exemplify this, the ratio of the 70 m specific luminosity and the SFR is plotted in Figure 12(b) as a function of the gas–phase oxygen abundance (taken from Moustakas et al. 2007). If there was a linear relation between the 70 m emission and the SFR, one would expect the symbols to lie near a horizontal line in this plot. However, the dwarfs, shown as circles, clearly occupy a lower L70μm/SFR space compared to the more massive galaxies. On average, the dwarf galaxies appear to be underluminous in 70 m emission relative to their SFR by a factor of . A similar conclusion (dwarfs have lower LIR/LHα) has been reached by Hunter et al. 1989, albeit for more luminous systems. This behavior may, to first order, be attributed to the fact that these objects have low metallicities and low dust contents (see discussion in Sec. 3.5 and Draine et al. 2007). However it is also clear that the scatter is large and that there is no simple relation between oxygen abundance and 70m luminosities per unit SF.
We now investigate how the global MIPS colors (here: the 70 m/160 m and 70 m/24 m ratios) of the M 81 groups dwarfs compare to the other SINGS galaxies. In Figure 13 we plot both ratios as a function of the oxygen abundance: Although the scatter is large, the dwarf galaxies have elevated 70 m/160 m ratios and 70 m/24 m ratios compared to the spiral galaxies in SINGS. The elevated 70 m/160 m ratios imply that the effective temperature of the dust in the dwarf irregular galaxies is on average higher than in more massive spirals. In this simplistic picture, the higher effective temperature results in a peak of the SED that is shifted toward the 70 m waveband (cf. Hunter et al. 1989, Dale et al. 2005). In this context it is interesting to keep in mind that the L70μm/SFR ratio in dwarfs is lower than in the spirals (see above). In other words, if the dust temperature in our sample dwarfs were the same as in the spirals, the L70μm/SFR ratio would decrease even further.
The elevated 70 m/24 m ratio in our sample dwarfs is more difficult to interpret as the origin of the 24m emission is not certain. According to the models by Draine & Li (2006), this emission is due to in part to single–photon heating, although in galaxies with strong 24m emission it is primarily due to warm grains in strong radiation fields. The 24m luminosity thus depends on the intensity of the radiation heating the dust (which depends on the density in the HII regions, the degree of clustering of O stars, as well as on the dust abundance). Future detailed modelling of the SEDs is needed to fully describe this behavior. We also note that our results do not necessarily hold for all classes of dwarf galaxies; i.e., extreme cases such as the metal–poor blue compact dwarf SBS 0335-052 have more extreme colors (very low 70 m/24 m ratio, Houck et al. 2004).
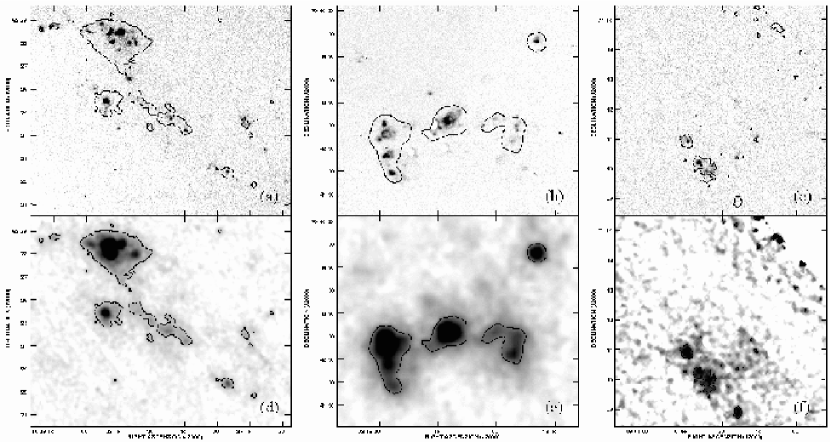
3.4. Spatial comparison to H
The apparent strong correlation between the 70 m luminosities and the SFR implies that the ongoing star formation is the main heating source for the warm dust. We now compare the spatial distribution of the H and the 70 m emission: Figure 14 (top) shows the H images for the three brightest H emitters in our sample (IC 2574, Holmberg II and Holmberg I). The contour shown in the invidual panels represents low–level 70 m emission (shown in Figure 14, bottom). From this we find a very good correlation between the locations of strong H and 70 m emission. This has been found in other galaxies before (e.g., M 51: Calzetti et al. 2005) but it is interesting to note that the same holds true even for faint dwarfs such as Holmberg I. We note that there is also diffuse dust emission present in our objects (e.g., Holmberg II, IC 2574) that is likely heated by the underlying stellar population or by UV photons that are leaking from the HII regions (see Cannon et al. 2006b for a detailed discussion on the diffuse dust component in the Local Group galaxy NGC 6822, see also, e.g., Popescu et al. 2002, Popescu & Tuffs 2003, Hinz et al. 2006).
| GalaxyaaDistances are from Karachentsev et al. 2002, 2003Central coordinates (J2000.0) and diameters of circular apertures: IC 2574: RA: 10 28 48.3, DEC: +68 28 03, =13.67′′, Holmberg II: RA: 08 19 12.8, DEC: +70 43 08, =14.63′′. | MdustbbDust mass derived using the SED models of Draine & Li 2006 | MHI | M | Mdust/MHI | Mdust/M |
|---|---|---|---|---|---|
| (104 M⊙) | (108 M⊙) | (108 M⊙) | 10-3 | 10-3 | |
| IC 2574 | 72 | 14.75 | 2.8 | 0.49 | 2.6 |
| Holmberg II | 12 | 5.95 | 1.2 | 0.20 | 1.0 |
| Holmberg I | 6.8 | 1.40 | 0.4 | 0.48 | 1.7 |
| DDO053 | 1.0 | 0.60 | 0.2 | 0.17 | 0.5 |


3.5. Dust Masses
We now discuss the dust masses of the M 81 group dwarf irregular galaxies. As the dust mass derivations mostly rely on the longest wavelength MIPS bands (i.e. the 70 m and 160 m bands), and given the large error bars in the measurements of the dwarf galaxies discussed here (in particular in the 160 m band, see Table 1), the dust masses presented in the following can only be considered to be order of magnitude estimates. Also, the observations are not sensitive to cold dust, which emits at wavelengths 160 m (i.e., there may be more dust present that is not heated by star formation).
To estimate the dust masses we use the new model presented in Draine & Li that include variable PAH abundances (2006, which is based on the models presented in Li & Draine (2001, 2002)). In their model, radiation field strengths are varied via power-law distributions; PAH, silicate and graphite grains are illuminated and the resulting SEDs can be compared to the observations. Table 3 (column 2) summarizes the dust masses of the sample dwarf galaxies using their models (note that DDO 165 and M 81 dwA were non–detections; the flux density measurements of M 81 dwB are too uncertain to derive a meaningful dust mass): the dust masses span almost two orders of magnitude from 1.0–70 M⊙. If we use the SED models by Dale et al. (2001) and Dale & Helou (2002) we get masses that are higher by a factor of 5. We attribute the difference to the fact that their models and dust mass correction factors were developed for normal galaxies and are therefore likely not appropriate for dwarfs.
With these dust masses we can now estimate the dust–to–gas ratios of the dwarf galaxies in our sample. In the following we define Mgas=MHI for the dwarfs, i.e. we do not take the possible (unknown) contribution of molecular gas into account (and we do not correct for the contribution of Helium). Using our dust and H i masses (Table 3, column 3), we derive an average Mdust/MHI ratio of (numbers for the individual galaxies are given in Table 3, column 4). These values do not appear to be a function of the measured metallicities (however the spread in metallicies in the remaining sample is small). If we consider only the H i mass of the M 81 group dwarfs in an aperture defined by the extent of the dust emission (M, Table 3, column 5) this ratio increases to an average of Mdust/M (Table 3, column 6). This is because, on average, about three quarters of the extended H i mass has no associated bright dust emission (cf. Figs. 1–7).
Draine et al. (2007, in prep.) present detailed dust mass estimates for all SINGS galaxies and derive a typical spread in dust–to–gas ratios for the more massive galaxies of 0.005Mdust/M0.02 (here including the contribution of molecular hydrogen). The value for the dwarfs is thus about an order of magnitude lower; it would decrease further if the dwarfs had a significant component of molecular hydrogen. The ratio for the dwarfs would increase, however, if they had an additional cold dust component (e.g., in the outskirts where the stellar radiation field is low, see also Draine et al. 2007) that can not be traced with the available MIPS observations. E.g., in the case of NGC 1569, Galliano et al. 2003 report a millimetre excess in the dust SED – this cold dust component could account for up to 70% of the total dust mass in this object. Such a cold reservoir may thus increase the total dust content by a factor of a few, but likely not by an order of magnitude. We thus conclude that the dust–to–gas ratio (Mdust/Mgas) in our sample dwarfs appears to be significantly lower than what is found in spiral galaxies (which can not simply be explained by a linear scaling of this ratio with metallicity, see also the discussion in Draine et al. 2007).
4. Summary
We present observations of warm dust and atomic gas in seven dwarf irregular galaxies in the M 81 group using data from both SINGS and THINGS. Five of the seven targets have been detected with Spitzer out to 160 m (the dwarfs with the lowest star formation rates, M 81 dwA and DDO 165, are non–detections). As molecular gas in these systems has yet to be detected (only likely exception: IC 2574, Leroy et al. 2005) the Spitzer observations give a first glimpse of the nature of the non–atomic ISM in these galaxies and provide important information to design follow–up observations of the molecular gas phase (e.g., to select regions of interest for pointed observations using millimeter telescopes).
We find that the warm dust emission as traced via the 70 m observations is associated with high H i column densities (N cm-2), close to the ‘canonical’ star formation threshold found by previous studies (e.g., Skillman 1996, Walter & Brinks 1999, Schaye 2004). Most regions with H i column densities of N cm-2 have dust emission associated with them. For the brightest regions at 70 m there is a good correlation with the location of HII regions, indicating that active star formation is needed to heat up the dust locally. However, in some cases, there is diffuse dust emission present at larger radii which does not appear to coincide with compact HII regions. This diffuse emission is likely due to the re-processing of non-ionizing photons in the ISM or the escape of radiation from the star formation regions (see also Cannon et al. 2006b).
IRS spectroscopy in the brightest regions in IC 2574 and Holmberg II (which have comparable star formation rates) reveal distinctly different spectral shapes: Whereas PAH features are clearly detected in the spectrum of IC 2574 those features are weaker in Holmberg II (which has lower metallicity) by an order of magnitude. This emphazises that the strength of PAH features is not a simple linear function of metallicity (see also Smith et al. 2006). The PAH–to–TIR continuum ratio in IC 2574 is a factor of 7 less than what is found in a typical SINGS spiral (a factor of in the case of Holmberg II).
While the H i masses are well-constrained, it is difficult to constrain the dust masses with a high degree of certainty. We estimate dust masses of 104– M⊙ for individual targets, resulting in an average dust–to–gas ratio (Mdust/MHI) of ( if only the H i that is associated with dust emission is considered). This can be compared to the range in values derived for the SINGS galaxies by Draine et al. (2007, in prep.) of 0.005Mdust/M0.02. Thus, the average dust–to–gas ratio in the dwarfs is lower by about an order of magnitude as compared to more massive spirals (a finding that can not simply be explained by a linear scaling with metallicity, see also Draine et al. 2007). Future sensitive observations at longer (sub–mm) wavelengths are critical to constrain the possible presence of a colder dust component in the galaxies (not heated by the stellar population) that may be missed by the MIPS observations.
We also find that the dwarf galaxies in our sample are underluminous at 70 m for a given SFR by about a factor of compared to the more massive and metal–rich galaxies in SINGS. However, interestingly, the average 70 m/160 m ratio in the dwarfs is higher (factor of 2) than in the spiral galaxies. In a simplistic picture, this can be attributed to higher effective dust temperatures in the dwarf galaxies (which shifts the peak of the warm dust SED toward 70 mm, cf. Dale et al. 2005). Similar conclusions on the dust temperature have been derived by other authors studying more luminous dwarf systems (Hunter et al. 1989, Dale et al. 2005, Engelbracht et al. 2005, Cannon et al. 2005, 2006a, 2006b) and have been explained in the context of stronger radiation fields in the dwarfs. It is interesting to note that, if the dwarf galaxies had the same temperature as the more massive spirals, the 70m luminosity for a given SFR would decrease further (relative to the spirals). Overall, there is a better correlation between the SFR (or optical magnitudes) and the 70 m luminosity than between the H i mass and L(70 m). This provides additional evidence that the FIR emission in the sample dwarf galaxies is powered by ongoing star formation and does not strongly depend on the total H i mass of the galaxy host.
References
- Asplund et al. (2005) Asplund, M., Grevesse, N., & Sauval, A. J. 2005, ASP Conf. Ser. 336: Cosmic Abundances as Records of Stellar Evolution and Nucleosynthesis, 336, 25
- Barone et al. (2000) Barone, L. T., Heithausen, A., Hüttemeister, S., Fritz, T., & Klein, U. 2000, MNRAS, 317, 649
- Bendo et al. (2006) Bendo, G. J., et al. 2006, ApJ, 652, 283
- Calzetti et al. (2005) Calzetti, D., et al. 2005, ApJ, 633, 871 Calzetti et al. 2006, in prep.
- Cannon et al. (2005) Cannon, J. M., et al. 2005, ApJ, 630, L37
- Cannon et al. (2006a) Cannon, J. M., et al. 2006a, ApJ, 647, 293
- Cannon et al. (2006b) Cannon, J. M., et al. 2006, ApJ, 652, 1170
- Dale et al. (2001) Dale, D. A., Helou, G., Contursi, A., Silbermann, N. A., & Kolhatkar, S. 2001, ApJ, 549, 215
- Dale & Helou (2002) Dale, D. A., & Helou, G. 2002, ApJ, 576, 159
- Dale et al. (2005) Dale, D. A., et al. 2005, ApJ, 633, 857 Dale, D. A., et al. 2006, in prep.
- Draine & Li (2001) Draine, B. T., & Li, A. 2001, ApJ, 551, 807
- Draine & Li (2006) Draine, B., & Li, A., 2006, ApJ, subm. (astro-ph/0608003)
- Draine et al. (2007) Draine et al. 2007, in prep.
- de Vries et al. (1987) de Vries, H. W., Thaddeus, P., & Heithausen, A. 1987, ApJ, 319, 723
- Engelbracht et al. (2004) Engelbracht, C. W., et al. 2004, ApJS, 154, 248
- Engelbracht et al. (2005) Engelbracht, C. W., Gordon, K. D., Rieke, G. H., Werner, M. W., Dale, D. A., & Latter, W. B. 2005, ApJ, 628, L29
- Gallagher et al. (1991) Gallagher, J. S., Hunter, D. A., Gillett, F. C., & Rice, W. L. 1991, ApJ, 371, 142
- Gordon et al. (2005) Gordon, K.D., et al. 2005, PASP, 177, 503
- Haas et al. (1998) Haas, M., Lemke, D., Stickel, M., Hippelein, H., Kunkel, M., Herbstmeier, U., & Mattila, K. 1998, A&A, 338, L33
- Hinz et al. (2006) Hinz, J. L., Misselt, K., Rieke, M. J., Rieke, G. H., Smith, P. S., Blaylock, M., & Gordon, K. D. 2006, ArXiv Astrophysics e-prints, arXiv:astro-ph/0607265
- Hippelein et al. (2003) Hippelein, H., Haas, M., Tuffs, R. J., Lemke, D., Stickel, M., Klaas, U., Völk, H. J. 2003, A&A, 407, 137
- Houck et al. (2004) Houck, J. R., et al. 2004, ApJS, 154, 18
- Houck et al. (2004) Houck, J. R., et al. 2004, ApJS, 154, 211
- Hunter et al. (1989) Hunter, D. A., Gallagher, J. S., Rice, W. L., & Gillett, F. C. 1989, ApJ, 336, 152
- Hunter et al. (2001) Hunter, D. A., et al. 2001, ApJ, 553, 121
- Jackson et al. (2006) Jackson, D. C., Cannon, J. M., Skillman, E. D., Lee, H., Gehrz, R. D., Woodward, C. E., & Polomski, E. 2006, ApJ, 646, 192
- Jorsater & van Moorsel (1995) Jörsäter, S., & van Moorsel, G. A. 1995, AJ, 110, 2037
- Karachentsev et al. (2002) Karachentsev, I. D., et al. 2002, A&A, 383, 125
- Karachentsev et al. (2003) Karachentsev, I. D., et al. 2003, A&A, 398, 479
- Kennicutt (1998) Kennicutt, R. C. 1998, ARA&A, 36, 189
- Kennicutt et al. (2003) Kennicutt, R. C., et al. 2003, PASP, 115, 928 Kennicutt, R. C. et al. 2006, ApJS, in prep.
- Kobulnicky & Skillman (1997) Kobulnicky, H. A., & Skillman, E. D. 1997, ApJ, 489, 636
- Kobulnicky & Skillman (1996) Kobulnicky, H. A., & Skillman, E. D. 1996, ApJ, 471, 211 Lee, J.C., 2006, PhD Thesis, University of Arizona
- Leroy et al. (2005) Leroy, A., Bolatto, A. D., Simon, J. D., & Blitz, L. 2005, ApJ, 625, 763
- Li & Draine (2001) Li, A., & Draine, B. T. 2001, ApJ, 554, 778
- Li & Draine (2002) Li, A., & Draine, B. T. 2002, ApJ, 576, 762
- Lu et al. (2003) Lu, N., et al. 2003, ApJ, 588, 199
- Galliano et al. (2003) Galliano, F., Madden, S. C., Jones, A. P., Wilson, C. D., Bernard, J.-P., & Le Peintre, F. 2003, A&A, 407, 159
- Madden et al. (2006) Madden, S. C., Galliano, F., Jones, A. P., & Sauvage, M. 2006, A&A, 446, 877
- Melisse & Israel (1994) Melisse, J. P. M., & Israel, F. P. 1994a, A&A, 285, 51
- Melisse & Israel (1994) Melisse, J. P. M., & Israel, F. P. 1994b, A&AS, 103, 391
- Miller & Hodge (1994) Miller, B. W., & Hodge, P. 1994, ApJ, 427, 656 Moustakas, J., et al. 2007, in prep.
- Pilyugin & Thuan (2005) Pilyugin, L. S., & Thuan, T. X. 2005, ApJ, 631, 231
- O’Halloran et al. (2006) O’Halloran, B., Satyapal, S., & Dudik, R. P. 2006, ApJ, 641, 795
- Ott et al. (2001) Ott, J., Walter, F., Brinks, E., Van Dyk, S. D., Dirsch, B., & Klein, U. 2001, AJ, 122, 3070
- Popescu et al. (2002) Popescu, C. C., Tuffs, R. J., Völk, H. J., Pierini, D., & Madore, B. F. 2002, ApJ, 567, 221
- Popescu & Tuffs (2003) Popescu, C. C., & Tuffs, R. J. 2003, A&A, 410, L21
- Puche et al. (1992) Puche, D., Westpfahl, D., Brinks, E., & Roy, J.-R. 1992, AJ, 103, 1841
- Rigby & Rieke (2004) Rigby, J. R., & Rieke, G. H. 2004, ApJ, 606, 237
- Rosenberg et al. (2006) Rosenberg, J. L., Ashby, M. L. N., Salzer, J. J., & Huang, J.-S. 2006, ApJ, 636, 742
- Salpeter (1955) Salpeter, E. E. 1955, ApJ, 121, 161
- Schaye (2004) Schaye, J. 2004, ApJ, 609, 667
- Skillman & Bothun (1986) Skillman, E. D., & Bothun, G. D. 1986, A&A, 165, 45
- Skillman (1996) Skillman, E. D. 1996, ASP Conf. Ser. 106: The Minnesota Lectures on Extragalactic Neutral Hydrogen, 106, 208
- Smith et al. (2006) Smith, J. D. T., et al. 2006, ArXiv Astrophysics e-prints, arXiv:astro-ph/0610913
- Taylor et al. (1998) Taylor, C. L., Kobulnicky, H. A., & Skillman, E. D. 1998, AJ, 116, 2746
- Telesco (1988) Telesco, C. M. 1988, ARA&A, 26, 343
- Thronson & Telesco (1986) Thronson, H. A., Jr., & Telesco, C. M. 1986, ApJ, 311, 98
- Walter & Brinks (1999) Walter, F., & Brinks, E. 1999, AJ, 118, 273
- Walter et al. (2005) Walter, F., Brinks, E., de Blok, W. J. G., Thornley, M. D., & Kennicutt, R. C. 2005, ASP Conf. Ser. 331: Extra-Planar Gas, 331, 269
- Wu et al. (2006) Wu, Y., Charmandaris, V., Hao, L., Brandl, B. R., Bernard-Salas, J., Spoon, H. W. W., & Houck, J. R. 2006, ApJ, 639, 157