The interstellar medium of the Antennae Galaxies
To study the properties of the interstellar medium in the prototypical merging system of the Antennae galaxies (NGC 4038 and NGC 4039), we have obtained (1–0), (2–1) and (3–2) line maps, as well as a map of the 870m continuum emission. Our results are analysed in conjunction with data from X-ray to radio wavelengths. In order to distinguish between exact coincidence and merely close correspondence of emission features, we compare the morphological structure of the different emission components at the highest available angular resolution. To constrain the physical state of the molecular gas, we apply models of photon dominated regions (PDRs) that allow us to fit CO and [Cii] data, as well as other indicators of widespread PDRs in the Antennae system, particularly within the super giant molecular cloud (SGMC) complexes of the interaction region (IAR) between the two galaxies. The modeled clouds have cores with moderately high gas densities up to 4 104 and rather low kinetic temperatures (25K). At present, all these clouds, including those near the galactic nuclei, show no signs of intense starburst activity. Thermal radio or mid-infrared emission are all observed to peak slightly offset from the molecular peaks. The total molecular gas mass of the Antennae system adds up to 1010 M⊙. In the vicinity of each galactic nucleus, the molecular gas mass, 1 – 2 109 M⊙, exceeds that of the Galactic centre region by a factor of almost 100. Furthermore, the gas does not seem to deviate much from the / ratio typical of the disk of our Galaxy rather than our Galactic centre. Alternative heating mechanisms with respect to PDR heating are discussed.
Key Words.:
galaxies: individual: NGC 4038/39 – galaxies: spiral – galaxies: interstellar matter – galaxies: active – galaxies: interactions – radio lines: galaxies1 Introduction
Although contributing only a fraction of the total mass, interstellar matter plays a profound role in mergers of spiral galaxies. Their molecular gas fuels an intense starburst and enormous far-infrared (FIR) luminosities are reached (Sanders & Mirabel 1996). Major mergers between gas-rich galaxies of comparable mass trigger the most luminous starbursts known. Galaxy interactions occurred frequently in the early universe. Hence, studying such interactions will contribute to our understanding of early galaxy evolution as well.
The Antennae galaxies (NGC 4038/39, Arp 244) are the nearest example of such a strongly interacting pair of galaxies. For the distance of the system (see Stanford et al. 1990; Wilson et al. 2000; Gao et al. 2001) we adopt 20 Mpc (1′′ covers 100 pc). Believed to be a symmetric encounter between two normal Sc type spirals, the Antennae have been well-studied at most wavelengths and are the subject of extended numerical simulations. The Antennae system is thought to be a merger in its early or possibly intermediate stages. (1) Optical observations reveal that the highly active star-forming regions are placed in an area between the two nuclei where a population of hundreds of supermassive stellar clusters is found. The majority of these have ages of 4 108 yr or less (Fritze-von-Alvensleben 1999) and the brightest of them are even younger than 107 yr, with a part of their starlight being heavily reddened hinting at large amounts of dust. Infrared Space Observatory (ISO) observations revealed luminous regions of massive star formation that are invisible at optical wavelengths (Mirabel et al. 1998). Their stellar content strongly surpasses that of open stellar clusters (Whitmore & Schweizer 1995; Zhang et al. 2001). (2) In the same region one finds the maxima of FIR emission (Evans et al. 1997; Bushouse et al. 1998) and submm emission (Haas et al. 2000) that are believed to originate in warm dust. (3) This is accompanied by strong peaks of radio emission observed at high angular resolution (Hummel & van der Hulst 1986; Neff & Ulvestad 2000) with the individual sources being partly thermal and coinciding with optical/H knots.
Physical and kinematical properties of the molecular gas are important for our understanding of the triggering of intense star formation in galaxy mergers. Previous observations of CO emission in the Antennae (e.g. Wilson et al. 2000) reveal extremely massive concentrations of molecular gas (108 ), a chaotic velocity field, and evidence of cloud-cloud collisions near the strongest mid-infrared peak.
Gao et al. (2001) claim that, while starbursts are observed in some extended regions in the Antennae, the most intense phase of the starburst is only just beginning. They predict that the Antennae ( 1011 currently) will undergo the much stronger ultraluminous ( 1012L⊙) starburst phase. Their arguments are based on the assumption that the star formation can be modeled using a Schmidt law, the consequences of which have been analysed for Antennae-like systems (Mihos & Hernquist 1996). Assessing these claims requires an accurate analysis of the interstellar gas in its various phases.
Furthermore, several investigations (e.g. Nikola et al. 1998; Fischer et al. 1996) raise evidence of the widespread presence of Photon Dominated Regions (PDRs) in merging systems. This is not unexpected in view of a starburst, initiated a few 10 Myr ago, that must have produced large quantities of B stars radiating soft UV photons at energies below 13 eV. For the central parts of two rather extreme cases of nearby galaxies, namely the “quiescent” galaxy IC 342 and the “starburster” M 82, we have shown that the thermal budget of interstellar molecular gas can be explained predominantly in terms of a PDR scenario (Schulz et al. 2001; Mao et al. 2000). The PDR scenario for the molecular gas in M 82 is confirmed by investigations of Garcia-Burillo et al. (2002), Fuente et al. (2005), and Fuente et al (2006) on the basis of HCO, HCO+, and CO+ observations, respectively. PDRs are also found in the spiral arms of M 83 and M 51 (Kramer et al. 2005).
After a brief kinematical analysis of our data (Sect. 3.2.), we carry out an extended inspection of the morphological structure of tracers for the different physical components of interstellar matter to examine their relationship to the molecular clouds (Sect. 4). This will be succeeded by an excitation analysis of the gas contained in the molecular clouds (Sect. 5). It is our aim to investigate whether a PDR model is applicable to its present state followed by a discussion of other possible heating processes for the bulk of the gas (Sect. 6).
2 Observations
The observations were performed during various seasons from Feb. 1999 to Apr. 2003 at the IRAM 30m-millimetre-radio-telescope (MRT) in Spain and at the 10m Heinrich-Hertz-Telescope (HHT) in Arizona, both in the beam-switching mode using the chopping secondary mirror with a throw of 200′′ (MRT) and 180′′ (HHT) in azimuth at switching frequencies of 0.5 Hz (MRT) and 2 Hz (HHT). The integration time for a single measurement was typically 2 minutes; several positions including the central positions of NGC 4038, 4039 and the InterAction Region (IAR) were repeatedly measured to obtain total integration times of up to 30 minutes per position.
A very good telescope pointing is essential for the complex cloud structure of the Antennae on arcsec scales; this was carefully checked every 30 to 40 minutes on nearby continuum sources. IRAM MRT data with pointing offsets of more than 1.5′′ were ignored. The parallel alignment of the MRT receivers (at 3mm and 1mm) was examined by observing planets, which also yielded the calibration checks. Hence, parallel observations of the CO (2–1) and (1–0) lines guarantee excellent relative pointing and therefore reliable line ratios. In addition, the image sidebands of the MRT receivers were suppressed by more than 10 dB using a Martin Pupplett interferometer filter. Furthermore, the telescope beams are very clean and free of prominent side lobes after improving the antenna, making it an ideal tool for the present study.
-
•
CO (3–2): The 345 GHz SIS mixer receiver at the HHT had a receiver noise temperature of 150K (double side band). The main beam efficiency was 0.55. The main beam size was 22′′ (full width of half maximum, FWHM). Total system noise temperatures (in the system) were typically 1500 – 3000 K.
-
•
CO (2–1): Using the MRT standard facility receivers at 230/220 GHz, calibration measurements of the improved telescope antenna yielded forward and main beam efficiencies of 0.91 and 0.52, respectively; the main beam size was 10.7′′. Total system noise temperatures were about 700 – 800 K.
-
•
CO (1–0): Observations with the 115/110 GHz IRAM standard facility receivers were performed in parallel with the CO (2–1) observations: forward and main beam efficiencies were 0.95 and 0.74, resp., beamwidths were 22′′; the total system noise temperature was about 300 K.
-
•
870m continuum: The HHT 19-channel bolometer array was used in its standard observing mode (see Mao et al. 2002 for details); the beamwidth was 22′′.
The standard facility IRAM and HHT backends were used with a typically 1 MHz spectral resolution. The final spectra were smoothed to channel spacings of 6 kms-1. Linear baselines were removed from the spectra.
The intensities of the spectra are given in units of main beam brightness temperature (). To derive line ratios useful for a well-constrained excitation analysis, absolute calibration of the spectral intensities had to be better than 10%, which was achieved by observations of planets.
3 Results
3.1 Spectra and maps
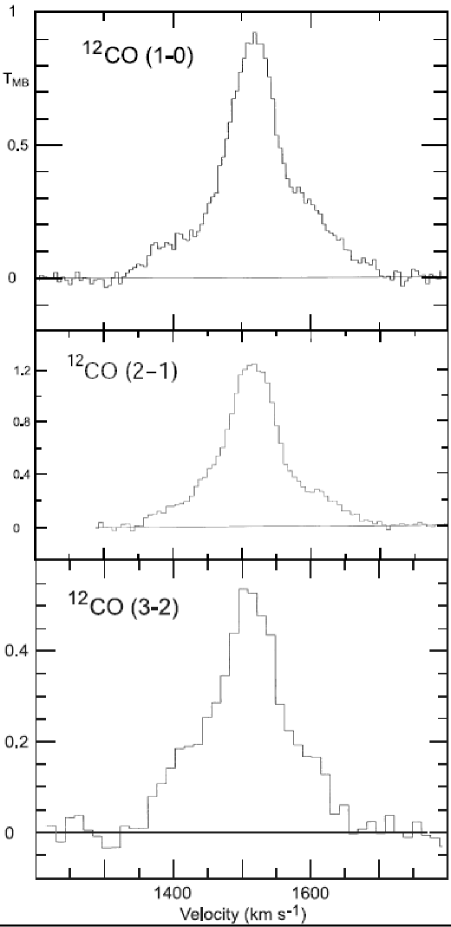
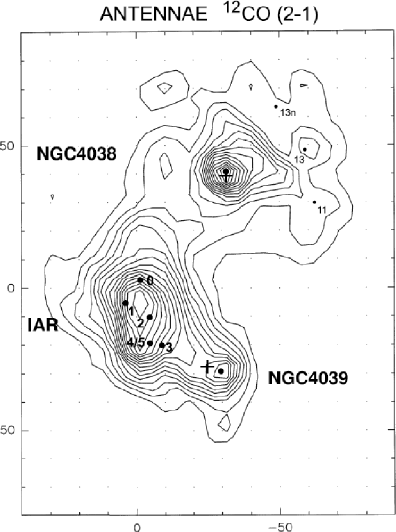
Figure 1 depicts the spectra at the IAR, and Figure 2 shows the map of integrated intensity of the CO (2–1) line with 10′′ spacing, covering the entire target including the positions of both galactic centres and the IAR. Figure 3 presents CO (2–1) channel maps, and Figure 4 displays the corresponding spectra of the inner part of the map allowing us to identify groups of cloud complexes at different velocities. Since the CO (2–1) beam covers an area with a linear size of 1 kpc, it is not possible to resolve individual GMCs like e.g. SgrB2 in our own Galaxy.
The intensity distribution shows identical features within the noise for all three mapped CO lines. Most of the CO emission originates from the IAR, which is more extended than the nuclear regions.
Our =2–1 map is the highest resolution CO map published so far of the Antennae representing the entire flux. We can identify both galactic nuclei, the IAR, and the western arc of emission in NGC 4038 surrounding the galaxy from the northeast (weak emission) to the southwest (stronger emission). Furthermore, although buried in the map of total integrated CO (2–1) intensity, some of the Super Giant Molecular Clouds (SGMCs) reported by Wilson et al. (2000) are indicated in the spectra (Fig. 4) and channel maps (Fig. 3) of the corresponding velocity ranges (for details see Sect. 3.2.). This also holds for the knot 9′′ northwest of SGMC 1 in the map of Wilson et al. (their Fig. 1), which is not addressed there but easily identified as a local maximum; we denote it as SGMC 0 (see Fig. 2).
13CO (1–0) and (2–1) spectra were obtained at the three emission maxima (NGC 4038, IAR and NGC 4039). The pointing accuracy of these spectra (1′′) was established by observing in parallel. For these three emission maxima we present line ratios (Table 1) which are needed to evaluate the physical state of the cold gas (see Sects. 5 and 6).
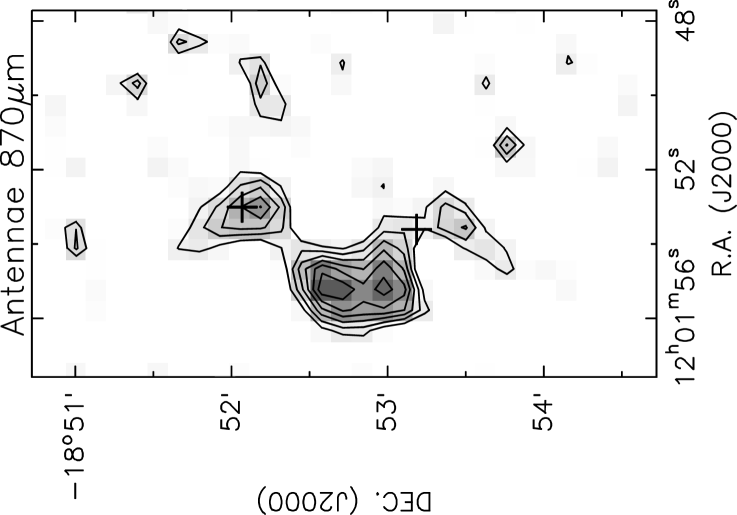
The 870m continuum map is displayed in Fig. 5. The observed 870m flux of NGC 4038, the IAR, and NGC 4039 is 195, 420, and 115 mJy, respectively. The total flux of the Antennae is about 730 mJy. The values of Zhu et al. (2003), being corrected for line emission, are slightly lower for NGC 4038 and NGC 4039 but only half of our value for the IAR.

3.2 Kinematics
NGC 4038
The CO (2–1) spectra of Fig. 4 show that the galactic disk gas of NGC 4038 is much less disturbed than that of the IAR and NGC 4039. The shape of the central CO (2–1) spectrum of NGC 4038 deviates only slightly from a Gaussian. It does not allow us to distinguish different velocity components any more than does the series of channel maps (Fig. 3). The line shape (centred at 1640 km s-1) and FWHM line width of 90 km s-1 are in accordance with the nuclear region not being heavily disrupted by anomalous motions due to the encounter. The small velocity gradient in the disk from 1570 in the southeast of NGC 4038 to 1650 in the west agrees with counterclockwise rotation (Hibbard et al. 2001) and an almost face-on view. The western arc shows a different velocity field rising from 1520 in its northern part to 1600 in the west and to 1700 in the southwest. Some of the spectra are double-peaked and one can identify both the disk gas and the arc component; hence, the arc component should not be interpreted as a normal spiral arm-like feature but, more likely, as a streamer caused by the galaxy interaction.
IAR
In the IAR all the CO (2–1) spectra (Fig. 4) have non-Gaussian shapes; some of them can easily be decomposed into two or more components. The CO (2–1) lineshapes look very similar to those of CO (1–0). The peak emission is centred at a lower velocity than that of both galactic nuclei (1520 km s-1), but it ranges from 1350 km s-1 to 1720 km s-1 in the wings. Lineshapes change drastically with position. The SGMCs of Wilson et al. (2000) can be identified - some of them only tentatively - in our channel maps of Fig. 3: SGMC 1 (weakly) as well as SGMC 2 and 3 in channel maps No. 4 and 5, SGMC 4 in map No. 5, SGMC 5 (weakly) in map No. 6; SGMC 0 north of SGMC 1 is indicated in our channel maps No. 2 and 3, which may be associated with the strong component at 1390 kms-1, most prominently seen 10′′ north of the CO (2–1) maximum in the IAR (Fig. 4). In the southern part of the IAR we also begin to observe the disk gas of NGC 4039, and IAR gas components show up throughout the entire eastern part of the NGC 4039 disk.
Direct evidence of cloud collisions and infall are difficult to obtain since the 3-dimensional positions of the clouds are unknown.

NGC 4039
The spectra attributed to NGC 4039 (nucleus centred at 1665 km s-1) are mostly non-Gaussian and partly much broader than those of NGC 4038. The observed velocity gradient across the disk from 1640 (east) to 1800 (southwest) is larger than in NGC 4038. Several spectra show more than one emission component; a bridge of CO connects NGC 4039 to the IAR. The disk of NGC 4039 therefore appears to us more edge-on than that of NGC 4038 and/or is more heavily disturbed by the interaction, the latter assumption being supported by the positional overlap with the IAR in the east. If part of the gradient is due to rotation, NGC 4039 also rotates counterclockwise. At the southwestern edge we see some indication of a spiral arm.
If NGC 4039 is located in front of NGC 4038 with respect to us (Hibbard et al. 2001), then both galaxies are approaching each other. This could enhance interaction processes in the future, possibly leading to a final coalescence.
4 Gas distribution and cloud morphology
In order to discuss the physical state of the gas of the Antennae and its main heating mechanism(s) on the basis of our CO measurements, it is necessary (1) to compare our data with other CO observations and (2) to closely inspect the distribution of other tracers of the interstellar medium also thought to be related to star formation, at all available wavelengths from low-frequency radio emission to X-rays. To distinguish exact spatial coincidences and nearby associations and to provide a broader picture of the gas, dust, and star-formation activity in the Antennae,we attempt here for the first time to perform such an inspection to a very high positional accuracy of 1′′, employing maps with the highest angular resolution.
We start with the CO maps, continuing with FIR and submm emission from the cold dust which should be correlated to the emission of cool molecular gas. Subsequently, we consider radio continuum, mid-infrared (MIR), near-infrared (NIR), and even the X-ray emission thought to be related to star formation.
4.1 CO maps
There is excellent agreement between our CO (2–1) map and the CO (1–0) interferometer map of Wilson et al. (2000), the CO map with the highest angular resolution available. No positional difference of any feature could be observed between the maps. Because of this excellent agreement, we will frequently use the interferometric map for morphological comparisons. We do not, however, consider their data to derive line ratios because (1) the resolution of the Wilson et al. map is much higher than in our maps, making beam size corrections uncertain, and because (2) Wilson et al. give only a rough overall estimate of their missing flux, which could vary from source to source.
There is also good correlation to the single dish CO (1–0) map of Zhu et al. (2003), even including their channel maps. However, we do not observe significant differences in the CO (1–0) and (3–2) line profiles at positions 20′′ north of the IAR centre (see Sect. 6.1.1.). We also notice that the positions of SGMC 1 - 3 indicated in their channel maps (their Fig. 7) are located at positions offset by up to 20′′ from our map and that of Wilson et al. (2000), and SGMC 4/5 was left out.
There is also good correspondence to the CO (1–0) 6′′ interferometric map of Stanford et al. (1990) and the single-dish map of Gao et al. (2001), although the comparison with the latter map is limited by its low angular resolution (55′′).
4.2 FIR and submm emission
At the IAR the distribution of cold dust emission (FIR and submm continuum) is in accordance with the CO maps within the positional uncertainties. Our 870 continuum map (Fig. 5) shows the same morphology as that of Zhu et al. (2003). Cold dust and molecular gas could be well-mixed here.
This correspondence is more difficult to observe for the other regions of the Antennae system. The emission peak of the NGC 4038 nucleus in our 870 map - in accordance with the 160 emission by Bushouse et al. (1998) - is offset to the south compared to that of Zhu et al. (2003), but all three maps peak south of both the strong CO peak and the I-band centre. On the other hand, at 60 the maximum is observed north of the CO and I-band peaks (Evans et al. 1997, Kuiper Airborne Observatory with a beam size of 17′′), and the entire 60 map of NGC 4038 shows little correspondence to either 15 or 160/870 emission. Not unexpectedly, the cold and hot dust trace different environments, which deserves further investigation.
The cold dust in the NGC 4038 western arc still remains an enigma: our 870 map does not have sufficient sensitivity; the area is not part of the map of Zhu et al. (2003), and 15 and 60 peaks do not coincide here at all. The nucleus of NGC 4039 is very weak at 870 but well-identified by tracers of warmer dust at 60 and 15m, typical of a disturbed galactic nuclear region.
4.3 Radio continuum and MIR emission
All the radio continuum maps with high angular resolution are morphologically identical to a precision of better than an arcsec (Hummel & van der Hulst 1986 at 6/20 cm; Neff & Ulvestad 2000 at 4/6 cm; Chyzy & Beck 2004 at 6 cm). The radio emission peaks coincide within 1′′ with those of the MIR 15 emission (Mirabel et al. 1998), which is interpreted to originate in warm dust. These emission maxima are associated with corresponding CO maxima, but none of the CO peaks is exactly identical (offsets 0.5′′ – 4′′) to those of 15m/radio emission (this is most obvious when using the interferometric CO map of Wilson et al. 2000).
The radio continuum emission has a thermal component from free-free radiation of Hii gas and a nonthermal component that is likely to be tracing synchrotron radiation from supernova remnants (SNRs). Neff & Ulvestad (2000) analysed the spectral indices of the radio flux (S). For the maxima of both galactic nuclei, they find indices of about –0.6. For most of the sources in the IAR, they find flat spectra (–0.5). They explicitly listed knots corresponding to SGMC 0,1,3, and 4/5 among the thermal sources. Rather flat spectra are also found for the knots of the western arc of NGC 4038, except for the knot of area 11 of Neff & Ulvestad ( = –0.77 0.22, where, on the other hand, Hummel & van der Hulst (1986) get = –0.4 0.2).
Flat radio spectra arise from Hii regions with recent (10 Myr) star formation. Neff & Ulvestad (2000) estimated 104 O 5 stars needed to cause the thermal radio flux of the IAR. The exact coincidence of some of the radio knots with H maxima (Amram et al. 1992; Whitmore et al. 1999; a one-to-one correlation is not expected due to absorption of the optical light by dust) further supports this picture. The sources of the ionizing UV radiation must be clusters of early type stars that also heat the dust in their close neighbourhood; this produces the extremely good correlation to the 15 map. The offset of the Hii regions relative to the SGMCs implies that the SGMCs do not coincide with the starburst sites of the IAR and the western arc of NGC 4038 produced by the galactic interaction, but they are sites of potential future star formation. Their neighbourhood to the clusters/superclusters causes their exposure to a strong UV radiation field that is discussed in more detail in Sect. 5.2.1.
In the north eastern part of the Antennae (NGC 4038 East), Hummel & van der Hulst (1986) find a higher-than-average non-thermal fraction in the extended diffuse radio emission due to SNRs that had time to expand. This points to a higher age for this region compared to the IAR (see also Zhang et al. 2001). The high fraction of non-thermal emission near the two galactic nuclei indicates that SNRs are more numerous than in normal galactic centres. This is very likely a consequence of the galaxy interaction.
4.4 Near-infrared
NIR images of regions of enhanced star formation in the I-band are generally interpreted to be dominated by emission from red giant stars, so strong extended I-band emission should indicate older star birth sites in a starburst system and also older stars in the nuclear regions of both disk galaxies. On inspecting the I-band image of Whitmore et al. (1999) one realizes - not surprisingly - an offset of the galactic nuclei to the CO maxima of a few arcsec. The southwestern CO “spiral arm” of NGC 4039 corresponds well to the I-band morphology. Considerably less I-band emission from “point sources” is seen at the IAR. This should not be attributed entirely to high extinction because it also holds for regions where the extinction is low (Whitmore & Schweizer 1995). Stronger I-band emission from pointlike sources shows up (1) in NGC 4038 East which has already been suggested as being older than the IAR starburst site (e.g. Zhang et al. 2001 and Sect. 4.3.), and (2) in the southern part of the NGC 4038 western arc. For the latter region we observe a general correlation with CO emission, but again all I-band maxima are offset to their corresponding CO cores (the offsets are random and cannot be artefacts caused by inaccurate pointings).
All this hints at a sequence of star formation from the most recent events in the IAR and perhaps the northern part of the NGC 4038 western arc (where we find optical emission and CO but very little I-band emission) to the older sites of activity in the southern part of the western arc and in NGC 4038 East. This basically agrees with star cluster age distributions given by Kassin et al. (2003), Brandl et al. (2005), and Mengel et al. (2005). The locations of these sites of star formation all do not coincide with the CO clouds.
4.5 X-Ray emission
X-ray emission is thought to originate in SNRs or X-ray binaries (preferably the hard component), either from a hot diffuse interstellar medium or from shocked gas (mostly the soft component). When inspecting high angular resolution maps by Fabbiano et al. (1997, 2001), it is striking that X-ray emission (both pointlike sources and diffuse emission) is strong at both galactic nuclei, near NGC 4038 East and in the southern part of the NGC 4038 western arc but is fainter at the IAR. Its weakness at the IAR is likely to be real since it is observed for both kinds of sources and at positions of high, as well as low, extinction (for regions of low extinction see Whitmore & Schweizer 1995).
The diffuse X-ray emission in both galactic nuclei is stronger than in normal spirals. The hot-gas component should be close to pressure equilibrium with the cold gas component (Fabbiano et al. 2003). The softer spectrum of the NGC 4038 nucleus is interpreted as originating predominantly in hot winds from star-forming regions; the NGC 4039 nucleus also contains a harder spectral component attributed to X-ray binaries due to enhanced supernova activity (Zezas et al. 2002).
Although we again find no exact positional coincidence with other images, the correspondence of X-ray bubbles (Fabbiano et al. 2001) with locations of suspected older starburst regions (see the I-band image of Whitmore et al. 1999) in NGC 4038 East and the southern part of the western arc is noticeable. The correspondence of diffuse (non-thermal) radio and diffuse X-ray emission (Neff & Ulvestad 2000) favours the idea that SNRs heat the hot coronal gas (Read et al. 1995). On the other hand, the lower flux of X-ray emission in the IAR is consistent with (1) an absence of strong shocks on very large scales and (2) a low abundance or absence of evolved SNRs; if SNRs exist in the IAR, they must predominantly be fairly young (107 yr).
5 Excitation analysis
In this section we investigate the applicability of two different models to explain the excitation of the interstellar gas and to determine its physical parameters.
5.1 LVG radiative transfer models
Although frequently applied, a standard radiative transfer analysis using an LVG (Large-Velocity-Gradient) line escape-probability code to model observed CO transitions has certain disadvantages, particularly when used for large cloud complexes, also discussed by Schulz et al. (2001). LVG models use gas temperatures and densities as fixed input parameters despite the fact that for kpc-sized regions the temperature and density are unlikely to be constant. Temperature gradients considerably influence the excitation of molecular lines.
Our own attempt to model our CO observations of the IAR yields no sensible results. The ratio of 13CO (2–1) and (1–0) can be fitted (both lines optically thin) for low gas temperatures and intermediate densities ( = 30 K: = 103 cm-3; 10 K: = 5 103 cm-3), but the ratio of 12CO (2–1) and (1–0) (see Fig. 6, lowest panel) demands a very low gas temperature and/or subthermal excitation for the CO (2–1) emission, which both contradicts the observed intensity of the CO (3–2) line. Because of the limited number of observed lines, the application of a two-component model makes little sense.
Zhu et al. (2003) attempt to fit their CO observations of the Antennae. They report that, at least for the IAR, the observed line ratios require spatial temperature (and possibly also density) gradients. Even a two-component LVG model with different densities and temperatures yields, however, results that are not well-confined. Moreover, their obtained CO line LVG models seem to suggest - as in several other cases - that the densest gas component is warmer (50K) than the less dense component, which should be questioned for kpc-size regions; in fact, investigations of the central region of the Galaxy (e.g. Hüttemeister et al. 1998) and of the galaxy IC 342 (Schulz et al. 2001) yield the opposite: the dense gas component is cool. Furthermore, LVG models hint at neither the physical heating process nor the chemistry.
5.2 Models of Photon Dominated Regions (PDRs)
5.2.1 Indications of PDRs
By now there is continously rising evidence that soft UV radiation with energies below 13.6 eV is penetrating huge areas of both our own and external galaxies that is inhomogeneously filled with molecular clouds. Consequently, one should consider applying PDR models in order to physically describe the interstellar matter. Goicoechea et al. (2004) analyse far infrared (FIR) spectroscopic observations of the Sgr B2 region of our own Galactic centre in terms of such models. Mochizuki & Nakagawa (2000) successfully model observations of the [Cii] and FIR emission of even larger areas of the inner Galactic plane. Wolfire et al. (1990) and Stacey et al. (1991), and, more recently, Malhotra et al. (2001) have analysed data of atomic fine structure lines and the FIR continuum in many galaxies in terms of PDR models. All these investigations show that PDR models are a useful tool for explaining observations of the diffuse interstellar matter not only on scales of individual clouds but also on the much larger linear scales characterising extragalactic studies.
Models explaining the heating of dense molecular clouds with PDRs were established for galactic objects like the Orion nebula where atomic lines (e.g. [Oi], [Ci], [Cii]) on the surface and molecular lines (e.g. CO) deeper inside the clouds are successfully modeled simultaneously (Stacey et al. 1993 and references therein). As indicated in the introduction, such analyses have also been successfully performed on kpc scales for the nuclear regions of the ‘normal‘ spiral galaxy IC 342 (Schulz et al. 2001), and the irregular ‘starburster‘ M 82 (Mao et al. 2000).
For the Antennae, many indications of the existence of widely-distributed PDRs have been found:
-
•
A map of 158m [Cii] emission (Nikola et al. 1998) reveals a distribution that is very similar to CO (1–0) (Gao at al. 2001) observed with the same beam size of 55′′. Nikola et al. show that the [Cii] emission originates mostly in PDRs and that contributions from Hii regions, as well as from extended low-density gas, are negligible (see also Kramer et al. 2005). Nikola et al. obtain a value for the UV radiation field lower than 1000 (in units of the Draine-field , see Sect. 5.2.2.), but, on the other hand, admit that their single-component fits for the galactic nuclei and for the IAR are very crude approximations, i.e. averages over huge areas. Directly comparing the [Cii] and CO (1–0) (Gao et al. 2001) line intensities , both observed with a 55′′ beam size, we obtain (in units of Jy) a ratio of 2800 for the IAR, a value between those typical of normal non-starbursting galaxies (1000–1300) and those typical of starbursters (6000; see Stacey et al. 1993). For the nucleus of NGC 4038 we find a value of 1800; for NGC 4039, see below.
-
•
Gilbert et al. (2000) analysed NIR spectra (2 to 2.5 m) with a spectrometer slit crossing the mid-IR ISO peak of the IAR and the NGC 4039 nucleus. The vibrationally excited H2 lines extending over an area of 200 pc across the IAR are interpreted in terms of a PDR (rather than a shock) model with a UV radiation field of 5000 times the Draine field. The extent of the emission area suggests that the UV photons travel much farther than suggested by their free path length within a smooth medium of the density modeled () = 104 – 105 cm-3). This implies that the medium is extremely clumpy, a since well-established scenario for interstellar clouds (e.g. Wilson & Walmsley 1989). Br emission indicates existing Hii regions associated with the PDRs in the IAR, while this is weak or absent near the NGC 4039 nucleus where star formation is currently weak.
-
•
Hot dust seen at 12 – 17 m (see Sect. 4.3.) is associated with the nuclear environment of the two galaxies, the western starforming ring of NGC 4038 and the IAR (Mirabel et al. 1998; Vigroux et al. 1996); it is heated by absorption of photons that are powerful enough to also ionize Ne, producing [Neii] and [Neiii] lines that are observed to be well-correlated with the mid-IR emission.
-
•
Fischer et al. (1996) performed FIR spectral imaging of fine structure lines of atomic oxygen and carbon. They find that the ratio of [Cii] 158m/[Oi] 63m provides strong evidence that both lines arise from PDRs and derive a UV radiation field of up to 2500-times the Draine field (see Sect. 5.2.2.).
-
•
Within the IAR, many super massive stellar clusters are observed as partly very young (Whitmore et al. 1999) and therefore as containing a large number of B stars providing the observed UV field that is heating the gas clouds mostly from the outside.
By now, CO line radiation from a galaxy merger like the Antennae has never been analyzed with PDR models, but the variety of results cited above indicates that such an approach is reasonable.
5.2.2 PDR model properties
The “KOSMA- PDR models” applied here are described by Köster et al. (1994), Störzer et al. (1996), Störzer et al. (2000), Zielinski et al. (2000) and Röllig et al. (2006). The most recent investigation slightly modified the PDR code after a comparison with equivalent codes of other research groups. The codes calculate model clouds illuminated by UV photons between 6.2 and 13.6 eV with a strength given in units of the local galactic interstellar radiation field = 2 10 (Draine 1978). An important improvement of PDR with respect to LVG models is achieved by calculating the temperature gradients. This yields CO line ratios different from those of fixed-temperature models.
The PDR models used here adopt plane-parallel layers of variable thickness illuminated by UV photons from both sides, as well as spherical clumps of variable radius illuminated from all sides. The plane parallel code (Köster et al. 1994) only permits a fixed density, whereas the spherical clump code (Störzer et al. 1996, Röllig et al. 2006) allows a fixed density and a power-law density distribution with as a free parameter; the clumps have a fixed size, the density starts with a value chosen at the surface and then rises with decreasing radius but is finally again fixed for the inner 10% of the radius. Those models with different geometries are compared below. One reason to do this is that the results for IC 342 (Schulz et al. 2001) were obtained assuming plane-parallel and those for M 82 (Mao et al. 2000) using spherical geometry.
It is obvious that even the model with variable clump density operates with still very idealised conditions representing only first-order approximations to the real ones. For example, the structure of molecular clouds is rarely spherical but often filamentary, and the assumption of equal illumination from all sides is unrealistic. Furthermore, to model the few measured line ratios we are only able to use an “average” PDR model. Averaging over our beam, filling several hundred parsec, it is impossible to obtain detailed physical properties for the several components of the interstellar gas that is observed (our smallest beam covers 1 kpc). In particular, it is difficult to model simultaneously the warm atomic gas (observed in atomic fine structure lines) and the cool molecular part of the clouds because their physical properties are very different. This is also discussed by Kramer et al. (2005), who apply PDR models to atomic fine structure lines and CO observations of the galaxies M 83 and M 51.
Even for the molecular part alone a difficulty arises when modeling extragalactic 12CO/ line ratios. These ratios are as low as 2 to 4 for the dense parts of galactic clouds observed with high spatial resolution, in agreement with model results. But for extragalactic objects the observed ratios always exceed 7. The line centre of is optically thick for large portions of molecular clouds, whereas can only be saturated in their densest parts. We therefore expect the low-density gas, which shows a pedestal of weak 12CO emission between the dense regions, to produce even weaker 13CO emission than the dense cores. Within our beam, we in fact observe regions often characterised not only by dense clumps but also by diffuse gas with comparatively high 12CO/ line intensity ratios. As a consequence, observed ratios are on the order of 10 to 20 for the brightest parts of the Antennae and many other galaxies. This will probably also explain diffferences in 12CO and 13CO line maps observed in the future as seen in other galaxies, although both lines are emitted physically from the same regions.
Nevertheless, this averaging problem has little influence on the resulting total hydrogen column density. Moreover, we can derive meaningful average parameters indicating the general physical state of the cloud complexes, in particular the temperature and density structure, which mainly determine the relative intensities of the different -level transitions.
| cloud | ) 3) | |||||||
|---|---|---|---|---|---|---|---|---|
| 104 cm-3 | 1022cm-2 | 109 | ||||||
| 4038 | 0.8 | 0.7 | 0.66 | 11 | 10 | 3.5 | 7 (5) | 1.8 |
| 6) | 1.05 | 0.9 | 15 | |||||
| IAR | 0.75 | 0.84 | 0.59 | 16 | 14 | 2.5 | 10 (6) | 3. |
| 6) | 0.86 | 0.68 | 28 | |||||
| 4039 | 0.68 | 0.50 | 16 | 2.0 | 9 (4) | 1.3 | ||
| 6) | 0.85 | 0.80 | 17 |
1) ratio of (2–1) to (1–0) and (3–2) to (1–0) line peak intensities for and 13CO,
resp. The (2–1) to (1–0) ratios are calculated for a 10.5′′ beam size using the source sizes of
Wilson et al. (2000). (3–2) to (1–0) ratios are taken directly from our data observed
with a beam size of 22′′ (errors are within 15 %)
2) ratio of and intensities as directly observed
3) gas density of the cloud cores from the PDR models; for the different models applied see text
of Sect. 5.2.3. Estimated accuracy 30 %.
4) determined PDR model column densities (and, in brackets, values simply applying
the standard factor, see Sect. 6.1.2.)
5) calculated from determined column densities with cloud complex sizes by Wilson et al. (2000);
inclusion of the gas of the extended CO pedestal emission raises the total gas mass to
.
Masses should be accurate to a factor 2, but note that the value might be more uncertain
for NGC 4039 (see Sect. 6.1.2.)
6) values calculated from the spectra of Zhu et al. (2003) for a 10.5′′ beam size using source
sizes of Wilson et al. (2000).
5.2.3 PDR model results
CO lines
Ratios of lines emitted from different -levels and 12CO/ line ratios are listed in Table 1. For two reasons we use observed peak main beam brightness temperatures instead of integrated line intensities for our modeling: (1) most of the spectra are very complex showing several distinct components that are difficult to be accurately disentangled; (2) values of integrated intensity suffer considerably more from baseline problems than do peak values. Integrated intensities are only taken to derive gas masses.
The average interstellar UV radiation field is confined to values between = 500 and = 3000 (see Sects. 5.2.1. and 5.2.2.). Higher values are only found in regions much smaller than 1 kpc (like Hii regions), and lower values would contradict the reported IR and FIR line fluxes. The influence of onto the CO line ratios is discussed by Störzer et al. (2000). Raising without changing other parameters raises the 12CO/13CO line ratios and lowers the CO (1–0) line with respect to the (2–1) and (3–2) emission. This trend can be compensated for by slightly varying other model parameters, but all these variations within a range confined by our observed CO line ratios leave the total H2 column densities virtually unchanged. Nevertheless, our chosen value of = 1000 is strongly constrained by the observed ratio of [Oi] and [Cii] emission (see below).
In order to check the validity of the different subsequently evolved PDR models applied to different galaxies (see Sect. 5.2.2.), we compare the three different available ways of modeling PDRs, i.e. (1) plane-parallel, (2) spherical with fixed gas density, and (3) spherical with a power-law density distribution. For our specific sets of observed line ratios, we obtain specific results in accordance with Störzer at al. (1996). Small clump sizes (or thin layers for the plane-parallel cloud) are generally demanded by the observed 12CO/13CO ratios. The models with a constant volume density (plane-parallel versus spherical) yield very similar values for clump diameters (resp. thicknesses of cloud layers) of about 0.1 pc, of gas column densities of about 5 1021 per velocity interval (1.2 kms-1), and of inner CO core radii (where the density of the produced CO exceeds 50% of its central value) of about 0.01 pc.
The spherical models operate with fixed total cloud sizes. Comparing spherical models with constant or variable ( = 1.5) gas volume density (see Fig. 6, panels a and b), the resulting total cloud size is 4 times larger in the latter case, but the resulting total column densities and the inner core radii (0.01 pc) - where the gas temperature is low and the CO density is above 50% of its central value - are all identical. Furthermore, all three PDR models yield within 20 % the same total gas density of the inner cores (about 3 104 cm-3) as is given in Table 1.
Regarding these agreements, on the one hand, and our 1-kpc-size beam and the small number of observed transitions, on the other, it appears unjustified to calculate models which are even more detailed, e.g. introducing a size spectrum of clumps (Störzer et al. 2000; Zielinski et al. 2000).


For three areas where we have also observed spectra, we calculated specific model parameters including gas masses listed in Table 1. Gas densities contained in our models are rather well-constrained by the observed line ratios of the CO -ladder. We note that, for the model with a variable density ( = 1.5), values at the outer edge of the model clump of 1000 are unrealistic because they lead to densities for the small inner cloud cores being too low ( 104 cm-3) to yield observable CO line antenna temperatures for the obtained cloud radii (significantly confined by the 12CO/ line ratios). We also emphasise that, for sensible clump sizes (yielding moderate optical depths of the CO lines), a considerable fraction of gas within the inner cloud cores should not considerably undercut the critical density to thermally excite the CO (3–2) line in the optically thin case () = 5 104 cm-3) since the CO (3–2) line peak intensity reaches 50–65% of that of the (1–0) line. For the CO (4–3) line peak intensity we expect a value of 20% to 30% of the CO (1–0) value.
Atomic lines
The modeled line ratio of [Oi] 63m and [Cii] 158m emission (1.3), which is very sensitive to the radiation field, agrees with the observed value of 1.4 (Fischer et al. 1996, their beam encompassing both galactic nuclei and the IAR). Calculated line ratios of [Cii] and CO (1–0) line emission of the IAR and NGC 4038 (3400 and 2300 in units of Jy, respectively) agree within 30% with the observed values (2700 and 1800, respectively; Nikola et al. 1998 and Gao et al. 2001; for NGC 4039 such a comparison is not meaningful due to its position close to the IAR). Taking beam and possible source size differences into account, this agreement is very satisfactory, implying that all these lines should be emitted from the same regions.
6 Discussion
6.1 The physical state of the gas
6.1.1 Molecular excitation and 12CO/ line ratios
The good agreement between maps of different CO transitions (see Sect. 4.1.) also includes lineshapes. CO (1–0), (2–1), and - for positions where the signal-to-noise ratio allows a decent comparison - also CO (3–2) profiles are quite similar, particularly for those positions where the lines show several components. Therefore, line ratios (and hence excitation conditions) should be similar for all these spatial components, including the IAR. In particular, this is also the case for the spectra 15′′ to 25′′ north of the IAR maximum where Zhu et al. (2003) report considerable differences for the CO (1–0 and (3–2) line shapes. They concluded that the velocity components exhibit completely different excitation conditions in this area.
The gas must be highly inhomogeneous on very much smaller scales than our spatial resolution: model clumps have sizes of 0.1 to 0.5 pc. This is a typical clump size for galactic molecular clouds (in M 17: 0.05 to 0.2 pc, Reid & Wilson, 2006). Our models (see Sect. 5.2.3.) show that most of the CO emission arises from small moderately dense (5 104 cm-3) cores. Adding up the clumps at all observed velocities with total sizes of the cloud complexes as observed by Wilson et al. (2000) and correcting with filling factors derived from ratios of observed to modeled line temperatures, we end up with the masses given in Table 1.
Most of the material in the interior of the clouds is at low temperatures (30K). This accords with derived dust temperatures (Haas et al. 2000) and with the fact that no signs of an ongoing extreme starburst are observed in the CO clouds - the knots of intense thermal radio emission are all slightly offset from the molecular peaks (see Sect. 4.3.; this cannot be caused by pointing offsets since the offset directions are random).
From the diffuse synchrotron component of the radio emission, Hummel & van der Hulst (1986) estimate a magnetic field strength of 40 G, a high value for such an extended region very likely being generated by compression of the ISM. We see evidence of a scenario where the generated young superclusters of stars meanwhile have partly disrupted their parent clouds and the ISM has been reorganised since then to its present distribution where starburst activity is rather low.
The state of the gas close to both galactic nuclei is not very different from the gas of the IAR according to our analysis, although the star-forming rate compared to molecular gas mass should have been lower near the nuclei in the recent past than in the IAR. We derive this from inspecting the ratio of thermal radio continuum (Neff & Ulvestad 2000) to CO flux.
6.1.2 Molecular masses
Our modeled gas masses (Table 1) agree with Wilson et al. (2000), adding up to about 1010 for the entire system, which is about twice the value for our own Milky Way (Combes 1991). We should admit that the value for the NGC 4039 nuclear region is an upper limit and quite uncertain, because our CO spectra at this position are possibly blended with emission from the IAR (it is not possible to separate IAR components from the broad spectra here). Wilson et al. (2003) also investigated the cloud mass spectrum and obtained a range of SGMC masses of 2 106 to 109 for the IAR and find consistency of such very high cloud masses with the idea of the formation of a “young super cluster” population several Myr ago, as reported by Whitmore & Schweizer (1995). Gao et al. (2001) obtain a total of 1.5 1010 using a standard conversion factor of 3 1020 ()-1. Also using this factor, Sanders & Mirabel (1985) get 2.6 109 M⊙ for the IAR, while Zhu et al. (2003) obtain 4 109 M⊙ for the entire Antennae system. Stanford et al. (1990) get about 50% of the values of Wilson et al. (2000) for both nuclei (for which they assume smaller sizes) and the IAR. If we use the same standard conversion factor mentioned above to determine gas column densities derived from integrated line intensities, we obtain the values listed in Table 1 in brackets. The values agree with the PDR modeling results within a factor of about 2 which we regard to be the anyhow accessible accuracy. Hence, we find no evidence of a significantly lower value than for Galactic disk clouds particularly for the IAR, in contrast to the results for the Galactic centre (Dahmen et al. 1998) and other galaxies that are supposed to be starburst galaxies such as M 82 (Weiss et al. 2001) and NGC 253 (Mauersberger et al. 1996) or even ultra luminous infrared galaxies (ULIRGs, see Solomon et al. 1997). The reason to meet such conditions within the IAR could be that the environment is different from that in a galactic nucleus. The gas close to the centres of the Antennae galaxies, on the other hand, can originate to a large fraction from inflow of ‘normal‘ galactic disk material like what is encountered in the solar neighbourhood. However, this argument of gas inflow also holds for ULIRGs. A possible explanation for this difference between galaxies undergoing strong nuclear starbursts and the central regions of NGC 4038 and NGC 4039 may be the linear scale: The low ratios in ULIRGs and the Galaxy refer to the central few 100 pc, while the regions studied here are larger. Consequently, if regions exist close to the centres of the Antenna galaxies with conversion factors such as found in NGC 253 or in ULIRGs, they must be considerably smaller than 1 kpc (the size covered by our smallest beam).
The total mass of the ionized gas in the radio knots (thermal component) is about 108 (Hummel & van der Hulst 1986). The total dust mass is 108 (Haas et al. 2000) in agreement with a normal galactic gas-to-dust ratio of order 100.
Zhu et al. (2003) modeled their CO observations using an LVG model. For the inner kpc of NGC 4038 they find = 43 K and ) = 3.5 103 cm-3. Compared to our PDR model results this density appears to be too low, also in the light of both their reported CO (3–2)/(1–0) line ratio of 0.9 and the critical density of the CO (3–2) line. For the IAR, Zhu et al. suggest a two-component solution with (A) = 30 – 130 K and ) = 1 – 8 103 cm-3, and (B) = 40 – 200 K and ) 3 104 cm-3. Applying a CO/H2 abundance ratio of 10-4 they obtain from their LVG modeling molecular gas masses of the IAR of about 1.5 108 M⊙, which is a factor of 10 lower than what they obtained with the standard factor (1.8 109 M⊙). The mass from their LVG modelling is also much lower than the values of the other studies. Zhu et al. conclude that CO could be underabundant by a factor of 10, which seems not to be very likely in view of the star formation activity in the IAR. Furthermore, the result that the denser component (B) is warmer than component (A) is questionable when averaging over huge areas of kpc size (see Sect. 5.1.), also in view of the derived low dust temperatures (NGC 4038 and IAR: 30K, NGC 4039: 21K; see Amram et al. 1992, Haas et al. 2000).
If our derived gas masses (Table 1) are correct, huge amounts of gas are located within a radius of about 1 kpc of the galactic nuclei, almost a factor of 100 more than in the same area of the Milky Way. This agrees with the results of the Casasola et al. (2004) study of the gas content of 1038 interacting galaxies. Although no direct observational evidence exists in the case of the Antennae, it is plausible that the strong disturbance of the kinematical balance of a galaxy is resulting in mass inflow toward the central region.
6.2 Alternative heating processes of the gas
We have identified the soft UV radiation from B stars as one of the major heating sources for the gas of the Antennae that causes widespread PDRs (see Sect. 5.). In this section we try to investigate the contributions of other possible heating mechanisms, particularly for the IAR.
Shocks
Indicators of the presence of shocks in the ISM may be vibrationally-excited H2 emission, X-ray emission, and emission from molecular species produced in shocks like SiO. Indirect evidence for shocks can be provided by the existence of numerous SNRs.
Gilbert et al. (2000) have analyzed near-IR spectra (2.03 - 2.45 m containing several H2 lines at very different excitation levels) observed in a compact star cluster of the IAR (at the position of the brightest 15m knot identified by Mirabel et al. 1998, 20′′ east of the NGC 4039 nucleus) entirely in terms of a clumpy PDR. This is strongly supported by low values of [Sii]/H line intensity ratios observed in the optical knots of the IAR, which are indicative of photoionization of the Hii gas rather than shock heating (Whitmore et al. 2005). Gilbert et al. (2000) take shocks by SNRs or merger-induced cloud collisions into account only for the NGC 4039 nucleus because they find that, due to the absence of Br emission, star formation activity should currently be low.
Analysing the radio emission of the IAR, Neff & Ulvestad (2000) have shown that most SNRs must be very young: They estimate that there are 104 O 5 stars needed to produce the thermal component. Using life times of a few Myr for these stars one would expect a SN rate of 0.01 per year if they were formed continually over the past few Myr. On the other hand, the nonthermal radio component implies a more than 20-times higher SN rate. The discrepancy can only be solved by assuming that all the O stars have been formed within a short period of time a few Myr ago, thus implying that their SN shocks have not yet propagated over large distances to heat up a mayor fraction of the molecular clouds.
Furthermore, the X-ray emission is not very strong throughout the IAR, particularly in the region near the CO line maxima and the locations of the youngest star clusters (Zhang et al. 2001); it is stronger in other regions thought to host older sites of star formation. It might be expected in a merger system that on small scales the hot gas is not everywhere in pressure equilibrium with the cooler matter and shocks might be present in a system with a recent starburst. But all the observed phenomena lead us to the conclusion that at present massive shock heating either due to SNRs or due to cloud collisions is not likely to be the dominant heating source for the SGMCs of the IAR. Nowhere does its dense gas show signs of strong shocks on large scales. Nevertheless, it cannot be excluded that heating by shocks plays a more important role in other parts of the merger system.
Cosmic rays (CRs)
The dominant source of CR protons contributing to the heating of molecular clouds is assumed to be SNRs. Evidence of large numbers of extended (and therefore older) SNRs detected by hard X-ray emission is more rarely found in the IAR than in regions that are thought to be older: NGC 4038 East and the southern part of the NGC 4038 western arc (see Read et al. 1995). The diffuse soft X-ray thermal emission (50% of the total X-ray emission) thought to be generated by stellar winds and SN explosions heating the thin hot component of the ISM suggests a SN rate of 0.006 yr-1 for the Antennae system (Fabbiano et al. 1997). The compact SNRs postulated by Neff & Ulvestad (2000) from non-thermal radio emission (see above) are still too young to transport their particles over large distances through the IAR.
Farquhar et al. (1994) correlated gas temperature and abundance of several atomic and molecular species versus the CR rate. Taking derived dust temperatures representative of the inner parts of molecular clouds of 30K would yield a maximum CR flux of 150-times that of the galactic value if the clouds were predominantly heated by CRs. Taking this estimate for the CR flux, the ratio of abundances of Oi and Cii should be higher than 103 (Farquhar et al.). This conflicts with measured [Oi] and [Cii] lines (Fischer et al. 1996), which are otherwise found to be typical of PDRs.
A good correlation between CO and radio continuum emission is difficult to interpret in terms of dominant CR heating of the molecular clouds even if an exact distinction of thermal (due to hot young stars) and nonthermal (due to SNRs) radio emission is achieved, because one also tends to find large quantities of O and B stars at sites with supernovae.
Other “caveats” come from the following problems. (1) Charged CR particles are affected by magnetic fields (and also MHD waves) and therefore could fail to effectively penetrate cloud complexes. (2) Models of CR heating (Suchkov et al. 1993, Farquhar et al. 1994) predict that the molecular gas temperature is almost independent of gas density, although temperature gradients as a function of density are widely observed in molecular clouds, a situation which has led many investigations to invoke at least two gas components whenever their modeling was unable to implement temperature (and density) gradients.
The argument that the time scale of CR diffusion, particularly in the presence of magnetic fields, is shorter than the time scale for producing UV radiation from late B stars might not be important since all activity is very young in the case of the Antennae. Nevertheless, the contribution of CRs to the heating of the SGMCs in the Antennae is difficult to determine; it is likely that it is not dominant in the IAR, but it may be different locally in other parts of the Antennae.
Ambipolar diffusion
Heating the extremely clumpy molecular cloud gas by ambipolar diffusion (ion slip) can not be completely excluded anywhere, but clear evidence in favor or against this mechanism is difficult to obtain. When a cloud is compressed, the magnetic field strength B will increase with gas density by ny with y 2/3 . As the friction of ionized and neutral gas also increases, y will be reduced, which decreases the heating efficiency. If, furthermore, the magnetic field gradient is smallon scales compared to the size of a molecular cloud, heating by ion slip weakens further (Scalo 1977). Hence, ambipolar diffusion might be quite important in the last stages of cloud-collapse forming stars, but it should not dominate the giant molecular cloud complexes discussed here.
7 Conclusions
From our CO line analysis probing the molecular gas of the Antennae system, we draw the following conclusions in conjunction with many other data in the literature:
(1) We observe CO maxima embedded within a pedestal of CO emission at the positions of the super giant molecular cloud complexes (SGMCs, Wilson et al. 2000) that are much larger than Sgr B2 near our Galactic centre.
(2) Most of the IAR gas is found at significantly lower velocity than the gas near the two galactic nuclei, indicating that it is expelled from the merger system. One can find several velocity components that can be identified with the SGMCs. The NGC 4038 disk shows a smooth velocity gradient, whereas the large western arc is kinematically separated from the disk and should be interpreted not as a spiral arm but as a separated filament caused by the interaction. The disk of NGC 4039 shows the same east-west gradient but a large fraction of its velocity structure is contaminated by IAR gas components, and its nuclear spectrum looks much more disturbed by the encounter than does the NGC 4038 spectrum.
(3) Classical large-velocity-gradient (LVG) models do not hint at the physical mechanism heating the gas. Recent model approaches yield poor fits and parameters for the molecular gas of the Antennae which are not very conclusive. Also, it results in a total gas mass that is 10-times lower than in several other studies.
On the other hand, in the literature we find widespread evidence of PDRs in the Antennae system. Our PDR model is able to reproduce the observed CO line ratios with a single component. All three of our model geometries yield consistent results constraining the gas parameters within sensible limits. The model clouds are much smaller than the SGMCs, which indicates that the gas is highly clumped, thus allowing the UV radiation to penetrate large areas. Observed and modeled CO and [Cii] line intensities are in accordance with the idea that a large fraction of the [Cii] emission originates in PDRs forming the outer layers of the identified molecular cloud complexes that in some cases are also associated with regions of moderate thermal free-free emission, i.e. Hii regions. The CO excitation conditions averaged over a kpc scale appear to be approximately uniform across the merging system. We predict a CO (4–3)/(1–0) line intensity ratio of 0.18 to 0.26.
Regarding the successful application of PDR models for the Antennae system as well as for galaxies like IC 342 (Schulz et al. 2001) and M 82 (Mao et al. 2000), one might suspect that PDR scenarios are generally found to be widespread in the interstellar medium of spiral galaxies.
(4) The modeled cloud cores have a moderately high density up to 4 104 cm-3 at low temperature (25K). The clouds show no signs of intense starburst activity: like thermal radio or MIR emission, such signs are all observed to be offset from the molecular peaks. The molecular gas mass contained in the nuclear 1 kpc of NGC 4038 and NGC 4039 exceeds that of the central 1 kpc of the Milky Way by a factor of almost 100, and the gas, including the IAR, does not seem to deviate much from a normal Galactic disk gas factor. The gas/dust ratio appears to be the normal Galactic value of 100. The bulk of the gas of the SGMCs found in the IAR adds up to 3 109 , the total molecular gas mass of the system (1010 ) is about twice the total gas mass of the Milky Way.
(5) We tried to examine the contribution of non-PDR heating sources for the gas seen in CO. Cosmic rays are likely to contribute to the heating of the cold molecular gas, but at least within the IAR they do not appear to be the dominant heating source because of the low X-ray flux here. In addition, the ratio of the [Oi] and [Cii] line intensities does not support a high CR flux. Turbulent friction and shocks can also not be ruled out, although at least within the IAR there is no strong evidence for a dominant contribution if the interpretation of H2 line emission in terms of PDRs is correct (Gilbert et al. 2000). Moreover, a gas temperature of 25K for the interior of the clouds obtained from our model does not favour the existence of strong extended shocks.
(6) Careful comparison of maps for various indicators for star formation points to various ages for the different starburst areas in the Antennae system. In order to obtain a more detailed picture of the evolution of this prototypical system, it appears worthwhile to use probes of different states of excitation at much higher spatial resolution. In particular, very accurate intensities of molecular line series observed with interferometers are needed to obtain sensible line ratios to investigate the conditions on scales considerably smaller than 1 kpc.
Acknowledgements.
We would like to thank the HHT staff members for their engaged support of our sometimes very experimental project. Ute Lisenfeld heped with the observations at the IRAM MRT. Frank Bertoldi, Carsten Kramer, Karl Menten, Jürgen Stutzki, and Axel Weiss, as well as the anonymous referee, contributed useful discussions and comments.References
- (1) Amram, P., Marcelin, M., Boulesteix, J., Le Coarer, E., 1992, A&A, 266, 106
- (2) Brandl, B.R., Clark, D.M., Eikenberry, S.S., et al., 2005, ApJ, 635, 280
- (3) Bushouse, H.A., Telesco, C.M., Werner, M.W., 1998, AJ, 115, 938
- (4) Casasola, V., Bettoni, D., Galletta., G., 2004, A&A, 422, 941
- (5) Combes, F., 1991, ARA&A, 29, 195
- (6) Chyzy, K.T., Beck, R., 2004, A&A, 417, 541
- (7) Dahmen, G., Hüttemeister, S., Wilson, T.L., Mauersberger, R., 1998, A&A, 331. 959
- (8) Draine, B.T., 1978, ApJS., 36, 595
- (9) Evans, R., Harper, A., Helou, G., 1997, in Extragalactic Astronomy and the Infrared, eds. G.A. Mamon, T.X. Thuan, J.T.T. Van (Paris: Ed. Frontieres), 143
- (10) Fabbiano, G., Schweizer, F., Mackie, G., 1997, ApJ, 478, 542
- (11) Fabbiano, G., Zezas, A., Murray, S.S., 2001, ApJ, 554, 1035
- (12) Fabbiano, G., Krauss, M., Zezas, A., Rots, A., Neff, S., 2003, ApJ, 598, 272
- (13) Farquhar, P.R.A., Millar, T.J., Herbst, E., 1994, MNRAS, 269, 641
- (14) Fischer, J., Shier, L.M., Luhmann, M.L., Satyapal, S. et al., 1996, A&A, 315, L97
- (15) Fritze-von Alvensleben, U., 1999, A&A, 342, L25
- (16) Fuente, A., Garcia-Burillo, S., Gerin, M., et al., 2005, ApJ, 619, L155
- (17) Fuente, A., Garcia-Burillo, S., Gerin, M., et al., 2006, ApJ, 641, L105
- (18) Garcia-Burillo, S., Martin-Pintado, J., Fuente, A., Usero, A., 2002, ApJ, 575, L55
- (19) Gao, Y., Lo, K.Y., Lee, S.-W., Lee, T.-H., 2001, ApJ, 548, 172
- (20) Gilbert, A.M., Graham, J.R., McLean, I.S., et al., 2000, ApJ, 533, L57
- (21) Goicoechea, J.R., Rodriguez-Fernandez, N.J., Cernicharo, J, 2004, ApJ, 600, 214
- (22) Haas, M., Klaas, U., Coulson, I., Thommes, E., Xu, C., 2000, A&A, 356, L83
- (23) Hibbard, J.E., van der Hulst, J.M., Barnes, J.E., Rich, R.M., 2001, AJ, 122, 2969
- (24) Hüttemeister, S., Dahmen, G., Mauersberger, R., 1998, A&A, 334, 646
- (25) Hummel, E., van der Hulst, J.M., 1986, A&A, 155, 151
- (26) Kassin, S.A., Frogel, J.A., Pogge, R.W., Tiede, G.P., Sellgren, K., 2003, AJ 126, 1276
- (27) Köster, B., Störzer, H., Stutzki, J., Sternberg, A., 1994, A&A, 284, 545
- (28) Kramer, C., Mookerjea, B., Bayet, E., et al., 2005, A&A, 441, 961
- (29) Malhotra, S., Kaufman, M.J., Hollenbach, D., et al., 2001, ApJ, 561, 766
- (30) Mao, R.Q., Henkel, C., Schulz, A., et al., 2000, A&A, 358, 433
- (31) Mao, R.Q., Yang, J., Henkel, C., Jiang, Z.B., 2002, A&A, 389, 589
- (32) Mauersberger, R., Henkel, C., Wielebinski, R., Wiklind, T., Reuter, H.-P, 1996, A&A, 305, 421
- (33) Mengel, S. Lehnert, M.D., Thatte, N., Genzel, R., 2005, A&A, 443, 41
- (34) Mihos, J.C., Hernquist, L., 1996, ApJ, 464, 641
- (35) Mirabel, I.F., Vigroux, L., Charmandaris, V., et al. 1998, A&A, 333, L1
- (36) Mochizuki, K., Nakagawa, T., 2000, ApJ, 535, 118
- (37) Neff, S.G., Ulvestad, J.S., 2000, AJ, 120, 670
- (38) Nikola, T., Genzel, R., Herrmann, F., et al., 1998, ApJ, 504, 749
- (39) Read, A.M., Ponman, T.J., Wolstencroft, R.D. 1995, MNRAS, 277, 397
- (40) Reid, M.A., Wilson, C.D., 2006, ApJ, 644, 990
- (41) Röllig, M., Ossenkopf, V., Jeyakumar, S., Stutzki, J., Sternberg, A., 2006, A&A, 451, 9177
- (42) Sanders, D.B., Mirabel, I.F., 1985, ApJ, 298, L31
- (43) Sanders, D.B., Mirabel, I.F., 1996, ARA&A, 34, 749
- (44) Scalo, J.M., 1977, ApJ, 213, 705
- (45) Schulz, A., Güsten, R., Köster, B., Krause, D., 2001, A&A, 371, 25
- (46) Solomon, P.M., Downes, D., Radford, S.J.E., Barrett, J.W., 1997, ApJ, 478, 144
- (47) Stacey, G.J., Geis, N., Genzel, R., et al., 1991, ApJ, 373, 423
- (48) Stacey, G.J., Jaffe, D.T., Geis, N., et al., 1993, ApJ, 404, 219
- (49) Stanford, S.A., Sargent, A.I., Sanders, D.B., Scoville, N.Z., 1990, ApJ, 349, 492
- (50) Störzer, H., Stutzki, J., Sternberg, A., 1996, A&A, 310, 592
- (51) Störzer, H., Zielinsky, M., Stutzki, J., Sternberg, A., 2000, A&A, 358, 682
- (52) Suchkov, A., Allen, R.J., Heckman, T.M., 1993, ApJ, 413, 542
- (53) Vigroux, L., Mirabel, F., Altieri, B., et al., 1996, A&A, 315, L93
- (54) Weiss, A., Neininger, N., Hüttemeister, S., Klein. U., 2001, A&A, 365, 571
- (55) Whitmore, B.C., Schweizer, F., 1995, AJ, 109, 960
- (56) Whitmore, B.C., Zhang, Q., Leitherer, C., et al., 1999, AJ, 118, 1551
- (57) Whitmore, B.C., Gilmore, D., Leitherer, C., et al., 2005, AJ, 130, 2104
- (58) Wilson, C.D., Scoville, N.Z., Madden, S.C., Charmandaris, V., 2000, ApJ, 542,120
- (59) Wilson, C.D., Scoville, N.Z., Madden, S.C., Charmandaris, V., 2003, ApJ, 599, 1049
- (60) Wilson, T.L., Walmsley, C.M., 1989, A&AR, 1, 141
- (61) Wolfire, M.G., Thielens, A.G.G.M., Hollenbach, D., 1990, ApJ, 358, 116 x
- (62) Zezas, A., Fabbiano, G., Rots, A.H., Murray, S.S., 2002, ApJ, 577, 710
- (63) Zhang, Q, Fall, S.M., Whitmore, B.C., 2001, ApJ, 561, 727
- (64) Zhu, M., Seaquist, E.R., Kuno, N., 2003, ApJ, 588, 243
- (65) Zielinski, M., Stutzki, J., Störzer, H., 2000, A&A, 358, 723