Search for Pulsed VHE Gamma-Ray Emission from Young Pulsars with H.E.S.S.
Abstract
Aims. We present the results of a search for pulsed very-high-energy (VHE) -ray emission from young pulsars using data taken with the H.E.S.S. imaging atmospheric Cherenkov telescope system.
Methods. Data on eleven pulsars, selected according to their spin-down luminosity relative to distance, are searched for -ray signals with periodicity at the respective pulsar spin period. Special analysis efforts were made to improve the sensitivity in the 100 GeV -ray energy domain in an attempt to reduce the gap between satellite and ground-based -ray instruments.
Results. No significant evidence for pulsed emission is found in any data set. Differential upper limits on pulsed energy flux are determined for all selected pulsars in the approximate -ray energy range between 100 GeV and TeV, using different limit determination methods, testing a wide range of possible pulsar light curves and energy spectra.
Conclusions. The limits derived here imply that the magnetospheric VHE -ray production efficiency in young pulsars is less than of the pulsar spin-down luminosity, requiring spectral turnovers for the high-energy emission of four established -ray pulsars, and constrain the inverse Compton radiation component predicted by several outer gap models.
Key Words.:
Gamma-rays: observations – Pulsars: individual: Crab pulsar, Vela pulsar, PSR B125963, PSR B150958, PSR B1706441 Introduction
Rotating neutron stars are known to convert a significant part of their rotational energy into radiation originating from within the magnetosphere. This emission is observable as a periodic signal at the neutron star rotation frequency (the pulsar phenomenon). For many of the known young and energetic pulsars, the emitted luminosity peaks at X-ray or -ray energies (see Thompson et al. 1999, and references therein), usually attributed to curvature radiation of accelerated electrons in the strong magnetic fields pervading the pulsar magnetosphere. The luminosity of the pulsed high-energy emission was found to correlate significantly with the energy loss rate of the pulsar, i.e. its spin-down power (Dermer & Sturner 1994; Cheng et al. 2004), which relates to the magnetic field at the neutron star surface, , approximately as , with as the angular frequency of the pulsar rotation. For most of the pulsars with established -ray emission (Fierro et al. 1998; Kuiper et al. 1999), there is evidence for a turnover in the pulsed spectrum at a critical energy in the sub-GeV to 10 GeV range. Note that no such turnover has been found up to 10 GeV in the case of PSR B170644 (Thompson et al. 1996).
Currently, two different scenarios for magnetospheric -ray emission are discussed, placing the emission regions either near the magnetic poles of the neutron star (polar cap model, Sturrock 1971; Ruderman & Sutherland 1975; Daugherty & Harding 1996; Rudak & Dyks 1999; Dyks & Rudak 2004) or near the null surface in the outer magnetosphere of the pulsar (outer gap model, Cheng et al. 1986a, b; Chiang & Romani 1992, 1994; Romani 1996; Zhang & Cheng 1997; Cheng et al. 2000). Both models predict a cutoff in the curvature radiation spectrum at -ray energies of the order of GeV up to several tens of GeV. However, the cutoff is of a different physical nature in the two models: while in the case of the polar cap model, the maximum energy of curvature radiation photons escaping the magnetosphere is limited by pair production in the polar magnetic field, the maximum energy of the accelerated electrons determines the maximum photon energy in the outer gap scenario. This results in different predicted light-curves, spectral shapes, and cutoff energies of the emitted high-energy radiation in the two models. Note that the predictions of outer gap models generally depend more strongly on model parameters, such as the inclination between the magnetic and rotational axes and the viewing angle to the observer, than is the case for polar cap models. Additionally, in some outer gap model calculations, a spectral component in the TeV range due to inverse Compton (IC) up-scattering of soft ambient seed photons by the accelerated electrons is predicted (e.g. Hirotani & Shibata 2001b; Hirotani et al. 2003; Takata et al. 2006). The boosted TeV photons, the flux of which is determined by the seed photon density, are more likely to escape due to the lower magnetic field strength in the outer magnetosphere compared to the polar cap regions.
Bridging the space between the distinct polar cap and outer gap models, particle acceleration within the slot gap (Arons 1983), a narrower region between the last open magnetic field line and the pair-plasma region of the polar cap, has been discussed in the context of high-energy radiation. However, so far slot gap calculations have been used primarily to model details of pulsed high-energy light-curves (Dyks & Rudak 2003; Muslimov & Harding 2003) without reproducing the corresponding energy spectra in the GeV range or predicting spectra for TeV energies.
Pulsars with established -ray emission components have been subject to intensive searches for pulsed very-high-energy (VHE, energies above GeV) -ray emission by ground based instruments. Up to now, no evidence for pulsed emission has been found in these observations (Yoshikoshi et al. 1997; Chadwick et al. 2000; de Naurois et al. 2002; Lessard et al. 2000; Aharonian et al. 2004a), and upper limits on the pulsed VHE -ray flux have been derived under various assumptions on the characteristics of the pulsed emission. However, the IC component predicted by outer gap models has not yet been significantly constrained.
The superior sensitivity of the H.E.S.S. detector with respect to previous instruments (see e.g. Ong 2006), combined with its Southern Hemisphere location, puts the predicted pulsed IC component from outer gap models within reach of testability, motivating a new search for pulsed VHE emission from the known -ray pulsars. A significant amount of H.E.S.S. data were accumulated in a survey of the inner Galaxy (Aharonian et al. 2006d), resulting in the detection of numerous new sources of VHE -rays, many of which are apparently associated with pulsars. Thus, in addition to the known -ray pulsars, these data can be used to search for pulsed emission from promising young, energetic pulsars.
The paper is structured as follows: in Section 2 the selection criteria of the studied pulsar sample are explained, Section 3 introduces the H.E.S.S. instrument and data analysis, in Section 4 the methods employed in the search for variability and the flux limit determination are explained, and finally, the results are presented and discussed in Sections 5 and 6, respectively.
2 Pulsar Candidate Selection
The prime candidates for the search for VHE -ray emission are the pulsars with established -ray emission at energies below GeV which have been detected by CGRO instruments. Four of them, PSR B053121 (Crab pulsar), PSR B083345 (Vela pulsar), PSR B170644, and PSR B150958 were the subject of pointed H.E.S.S. observations and many hours of observations were obtained for each of them in the years 2002 to 2005. In addition, a significant number of known pulsars were observed as part of the H.E.S.S. survey of the Galactic Plane in 2004 and 2005, or lie within the field of view of observations of other H.E.S.S. targets. The location of the H.E.S.S. site in the southern hemisphere limits the declination of observations to .
Apart from the known -ray pulsars, other candidates for which H.E.S.S. data were available were selected from the ATNF pulsar catalogue (see Manchester et al. 2005, and references therein) if their spin-down flux was greater than . Table 1 lists all candidates chosen along with selected measured and derived characteristics collected from the literature.
| Pulsar name | Age | Rank | |||||||
|---|---|---|---|---|---|---|---|---|---|
| PSR | |||||||||
| B0531+21 | J0534+2200 | 33.1 | 2 | 1.24 | 38.7 | 38.1 | 37.8 | 98.0 | 1 |
| B083345 | J08354510 | 89.3 | 0.29 | 11.3 | 36.8 | 37.9 | 33.8 | 4.45 | 2 |
| B170644 | J17094429 | 102 | 1.8 | 17.5 | 36.5 | 36.0 | 31.2 | 2.72 | 6 |
| B150958 | J15135908 | 151 | 4.4 | 1.55 | 37.3 | 36.0 | 154 | 4.22 | 7 |
| J17472958 | 98.8 | 2.5 | 25.5 | 36.4 | 35.6 | 24.9 | 2.42 | 13 | |
| B125963 | J13026350 | 47.8 | 1.5 | 332 | 35.9 | 35.5 | 3.3 | 2.87 | 15 |
| J18111925 | 64.7 | 5 | 23.3 | 36.8 | 35.4 | 17.1 | 5.92 | 18 | |
| J15245625 | 78.2 | 3.8 | 31.8 | 36.5 | 35.3 | 17.7 | 3.46 | 19 | |
| J14206048 | 68.2 | 7.7 | 13 | 37.0 | 35.3 | 24.1 | 7.13 | 22 | |
| J18261334 | 101 | 4.1 | 21.4 | 36.4 | 35.2 | 27.9 | 2.51 | 23 | |
| J18012451 | 125 | 4.6 | 15.5 | 36.4 | 35.1 | 40.4 | 1.95 | 30 | |
Some peculiarities of individual pulsars are pointed out in the following. PSR J17472958, situated in a bow-shock pulsar wind nebula (PWN) is detected as a compact X-ray source (Gaensler et al. 2004). The only binary pulsar in the present sample, PSR B125963 orbits a Be-star companion. Its magnetic field is interestingly low ( G), suggesting a high cutoff energy in polar cap models. It has been discovered as an emitter of transient X-rays (Cominsky et al. 1994) and VHE -rays (Aharonian et al. 2005), however, pulsed high-energy emission has not so far been detected. PSR J14206048 is embedded in a PWN and identified with a compact X-ray source (Ng et al. 2005) within the Kookaburra complex, from which VHE -ray emission was recently detected (Aharonian et al. 2006a). PSR J18111925, for which pulsed emission has been detected up to hard X-rays (Gavriil et al. 2004), is located in the composite supernova remnant G11.20.3. All of the selected pulsars are visible at radio wavelengths with the exception of PSR J18111925 which is only seen in X-rays.
All available H.E.S.S. data were searched for the respective pulsar to be in the field of view with a maximum angular distance of ° between the pulsar position and the H.E.S.S. pointing direction.
3 VHE Gamma-Ray Detection and Data Analysis
3.1 The H.E.S.S. Detector
The High Energy Stereoscopic System (H.E.S.S., Hofmann 2003), an array of imaging atmospheric Cherenkov telescopes located in Namibia at S E and 1800 m a.s.l., detects cosmic VHE -rays by imaging the Cherenkov emission of their air showers in the atmosphere using optical telescopes. Each telescope has a tessellated spherical mirror with 13 m diameter and area (Bernlöhr et al. 2003; Cornils et al. 2003) and is equipped with a camera of 960 -photomultiplier tubes providing a total field of view of in diameter (Vincent et al. 2003). During the stereoscopic observations, an array trigger requires the simultaneous detection of air showers by several telescopes at the hardware level (Funk et al. 2004), allowing a suppression of background events and the assignment of GPS timestamps to each triggered air shower, without the need of an offline synchronisation of the individual telescopes. After digitisation, the event data are stored on disk by the data acquisition system (Borgmeier et al. 2003).
Following the calibration of the recorded air shower data (Aharonian et al. 2004b), each telescope image was parametrised by its centre of gravity and second moments (Hillas 1985) followed by the stereoscopic reconstruction of the shower geometry providing an angular resolution of for individual -rays. The -ray energy was estimated from the image intensity and the shower geometry with a typical resolution of . In order to reject the vast background of cosmic-ray showers, -ray candidates are selected using cuts on image shape scaled with their expectation values obtained from Monte Carlo simulations. Details of the analysis technique can be found in Aharonian et al. (2006c). The selection cuts used for this analysis were optimised on simulations of a -ray point source with 10% of the flux of, and the same spectral shape as, the VHE -ray emission from the Crab Nebula. These cuts, in the following called standard, allow the detection of sources with 1% Crab Nebula flux at energies above GeV with a significance of 5 within 25 hours at a zenith angle of 20. Note that the threshold energy above which -ray sources can be detected increases with the zenith angle of observation.
3.2 Low Energy Optimisation
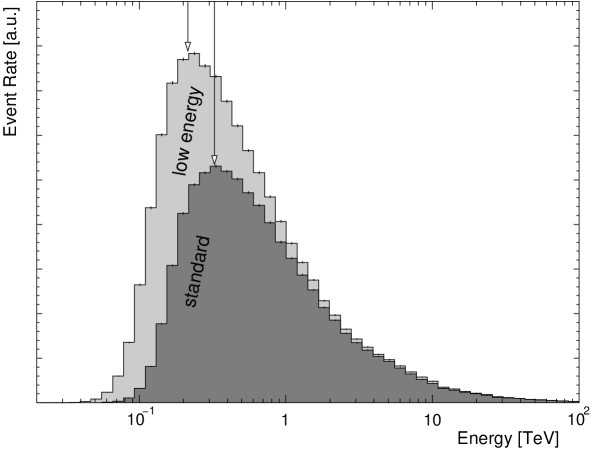
Since observational data indicate steep cut-offs in high-energy (GeV) -rays, special low-energy cuts have been applied to reduce the gap in observational coverage between satellite and ground based -ray observations of young pulsars. Table 2 lists the values of the two samples of selection cuts used in this analysis. See Aharonian et al. (2006c) for a detailed description of the individual cuts. The low energy cuts were optimised on simulated -rays to yield the best sensitivity for steep spectrum sources () with energies below 500 GeV. Figure 1 shows the rate of simulated -ray events for a Crab-like source spectrum () passing the standard (dark grey) and low energy (light grey) selection cuts as a function of -ray energy for a typical zenith angle of 20°. The peak of the distribution is commonly defined as the threshold energy. The low energy cuts result in an energy threshold lowered by a factor of 1.5 with respect to the standard cuts. Although the number of selected events is higher by 50%, the background rejection efficiency of the low energy cuts is worse by more than a factor of 3. Thus, the extension of the detectable -ray energy range is achieved only at the expense of decreased sensitivity, especially at higher energies.
| Cuts | Size | MRSW | MRSL | Tail cuts | ||
|---|---|---|---|---|---|---|
| [p.e.] | TeV | [p.e.] | ||||
| Standard | 80 | 100 | 0.0125 | 5/10 | ||
| Low energy | 40 | 0.5 | 0.024 | 4/7 |
In order to quantify possible systematic effects of the low energy cuts on the energy spectrum determination, data from observations of the Crab Nebula were used to reconstruct the differential energy spectrum for both sets of cuts. In Figure 2 the open points show the spectrum of unpulsed -rays determined with the standard cuts. The solid line indicates the best-fit power law with exponential cutoff taken from Aharonian et al. (2006c), Table 5. The full points result from the analysis with low energy cuts, showing minor systematic differences in the absolute flux normalisation (10%).

3.3 Point Source Analysis
Observation runs are selected according to standard quality selection criteria, ensuring stable detector and atmospheric conditions as described in Aharonian et al. (2006c). The data were analysed using the standard method for the search for point sources without considering any time variability. The number of events in a circular region around the source position with radius is compared to the number of counts in several background regions of the same size, arranged on a circle around the centre of the field of view with radius . For each run, the background normalisation is determined by the number of background regions used. For data sets comprised of several different offsets, as is the case for most of the selected pulsars, the background normalisation for each run was weighted by its relative acceptance for a given offset. This acceptance was derived from data of H.E.S.S. observations without significant -ray emission within the field of view (see also Berge et al. 2006).
4 Periodicity Analysis
In order to test for pulsed -ray emission at the pulsar position, the timestamps of each recorded shower passing selection cuts were transformed from the observer’s frame into the pulsar frame and then folded with the pulsar spin period. The resulting unbinned distribution of pulsar phases corresponding to each shower event was tested for variability. In cases where no significant periodicity was found, flux limits were determined under various assumptions concerning pulse shape and position.
4.1 Timing Corrections
The time of arrival (TOA) for each shower event recorded by the telescope array is determined with a central trigger GPS clock (Funk et al. 2004), achieving an accuracy of better than s. Each TOA was transformed to the pulsar frame using the following corrections:
| (1) |
Here, represents the transformation from GPS time to International Atomic Time, the classical transformation to the solar system barycentre using the solar system ephemerides DE200 from the Jet Propulsion Laboratory (Standish 1982) and and are general relativistic corrections for the gravitational influence of the sun (Backer & Hellings 1986) and the redshift induced by all major bodies in the solar system (Fairhead et al. 1988), respectively. The correction term applies only for pulsars in binary systems, i.e. PSR B125963, and corrects for the pulsar motion in its binary orbit according to Blandford & Teukolsky (1976). The correction software used for this analysis was cross-checked with the commonly used pulsar timing utility TEMPO (Taylor et al. 2000). Furthermore, the timing capability of H.E.S.S. was demonstrated by measuring the optical light-curve of the Crab pulsar with high precision (Hinton et al. 2006).
4.2 Tests for Pulsed Emission
The corrected TOA was subsequently folded with the timing parameters of the target pulsar (pulsar ephemeris) obtained from radio or X-ray observations. For each event TOA , the pulsar phase was determined according to
| (2) |
where denotes the floor function, and with as the number of pulsar rotations
| (3) |
where the parameters , , , , and are the reference time, the corresponding number of rotations, frequency, and first and second frequency derivative, respectively, which altogether represent the timing parameters of the pulsar ephemeris. Table 3 lists the references for the ephemeris used for each pulsar along with the respective reference times depending on the number of different parameter sets.
| Pulsar | [MJD] | References |
| B0531+21 | (1) | |
| B083345 | (2) | |
| B125963 | (2) | |
| J14206048 | 53156, 53493 | (2) |
| B150958 | (2) | |
| J15245625 | 53650 | (2) |
| B170644 | 52773, 52915 | (2) |
| J18261334 | 53130, 53449 | (2) |
| J17472958 | 52613⋆ | (2) |
| J18012451 | 52503⋆ | (3) |
| ⋆Valid timing information was not available for all data within the H.E.S.S. data set. | ||
For the X-ray pulsar PSR J18111925 and the radio pulsars PSR J18012451 and PSR J17472958 there were no contemporaneous observations available from which the pulsar timing parameters could have been deduced. For these pulsars, the most recently published timing solution was used, assuming that the pulsar phase determined with the known parameters is accurate enough to reveal the periodicity of a potential signal. In particular, this assumes that no glitches or other major frequency changes occurred within the time range between the H.E.S.S. observations and the measurement of the timing parameters.
The unbinned phase distribution of events was tested for significant periodicity, i.e. for a significant deviation from a flat distribution, using several statistical tests. The Pearson -test tests for a constant distribution of phases in a number of phase bins, which was set to 20 in order to give acceptable coverage for any of the considered data sets. The -test (Buccheri et al. 1983) checks for a combination of fundamental sine and cosine harmonics up to the -th order and is independent of any binning. Here, the - and -tests for single and double peak profiles are employed. Additionally the -test (de Jager et al. 1989), a more powerful generalisation of , was performed to increase the sensitivity to unknown pulse profiles. Finally, a rather different approach which checks for maximum deviations from the uniform phase distribution, the Kuiper-test (Jetsu & Pelt 1996), was used.
In order to test for spurious signals induced by possible systematic effects in the H.E.S.S. event data, the tests were also applied to the phase series of background events, i.e. events from sky regions used in the background determination for the unpulsed -ray excess (cf. Sec. 3.3).
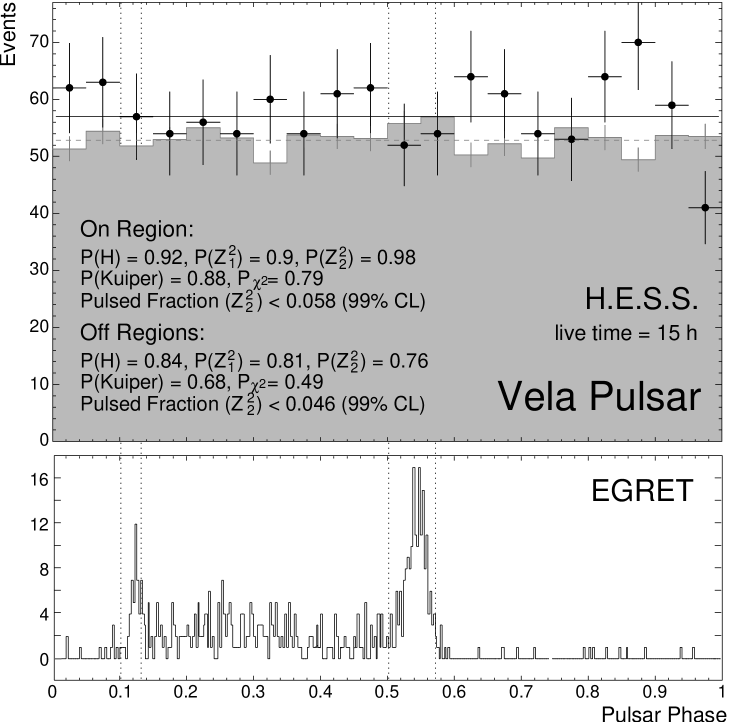
As an example, the distribution of event phases from observations of the Vela Pulsar (PSR B083345) is shown in Fig. 3, obtained using the standard cuts. The difference between on and off results from the known -ray excess from HESS J0835456 at the position of the pulsar (see Table 5). No significant deviation from uniformity was found with any of the statistical tests for pulsations.
4.3 Flux Limit Determination
Several methods were applied to obtain limits on the -ray flux from the selected pulsars. They differ in the assumptions made concerning the characteristics of the pulsed emission, in particular concerning the form of the light-curve and the phase position.
In the most conservative approach, without any assumptions on the temporal structure or spectrum of a possible signal, the energy flux is calculated using the standard analysis as described in Sec. 3.3. This method considers all events in the direction of the pulsar, i.e. in the on-region, ignoring any possible variations and is referred to as the unpulsed method. The flux is calculated event-wise for the on- and off- (background) regions within the same field of view separately, accumulated in bins of energy, and subsequently subtracted to yield the excess flux (Aharonian et al. 2005c). Note that due to the finite width of the energy bins, the reconstructed flux is weakly dependent on the -ray energy spectrum for which the detector efficiency was calculated. Finally, the flux obtained in this way is converted into a 99% confidence level upper limit using the method of Feldman & Cousins (1998). As some of the pulsars in this sample show significant unpulsed -ray emission, the flux limits derived can be considerably higher than the nominal H.E.S.S. -ray flux sensitivity since the unpulsed -ray emission is an additional background to the pulsed emission.
The second method takes advantage of the pulse position and shape as measured in other energy domains, assuming similar characteristics for the hypothetical VHE -ray emission. In particular for the known -ray pulsars this approach seems reasonable, since the -ray emission mechanism is expected to be similar at VHE -ray energies, especially for photons originating from curvature radiation. For each pulsar, a known pulse profile was chosen according to the energy band of the emission, taking the highest photon energies. For these pulse profiles, an on- and an off-phase domain were assigned (on-off-pulse method), representing the pulsar phases for high and low (or no) emission, respectively. Table 4 lists the used on-phase intervals and their corresponding energy bands for all pulsars. The phase intervals are given relative to the reference phase which is coincident with the highest peak of the respective radio profile. For example for the Vela pulsar, the on- and off-phase domains were chosen based on the light-curve measured using EGRET at GeV energies (Fierro et al. 1998), as indicated by the dotted lines in Fig. 3. Note that any possible contribution from inter-pulse domains, the phase range between the on-pulse domains, to the pulsed signal are neglected in this method. For the pulsars without established -ray emission, the selected phase region always covers 20% of the profile around the reference phase. The VHE -ray flux was then calculated as for the unpulsed method, but using the off-phase events in the direction of the pulsar for background estimation, instead of the events in the off-regions within the field of view. If there was no significant unpulsed signal visible within a data set and no known VHE -ray source coincident with the target pulsar, i.e. for PSR J15245625, PSR B170644, and J18012451, the off-event statistics were increased by including those events which were in the off-regions of the field of view and additionally had phases falling in the assigned off-phase domain. In these cases the background normalisation was adjusted accordingly.
| Pulsar | On pulse phases | Energy | Reference |
|---|---|---|---|
| B0531+21 | -ray | (1) | |
| B083345 | -ray | (1) | |
| B125963 | Radio | (2) | |
| J14206048 | Radio | (2) | |
| B150958 | -ray | (3) | |
| J15245625 | Radio | (2) | |
| B170644 | -ray | (4) | |
| J18261334 | Radio | (2) |
The on-off-pulse method is less reasonable for those pulsars for which pulsed emission is known only at low energies, especially at radio wavelengths, since the -ray production mechanism may be completely unrelated to that of the low energy emission.
Therefore, a third approach was also applied, that does not rely on knowledge of the phase position of the pulse, but only assumes a certain pulse shape. Here, a combination of first and second order harmonics was chosen, similar to the -test. A 99% confidence level upper limit on the fraction, , of pulsed emission present in the series of event phases for events with shower directions from within the on-region around the pulsar position was calculated for a given energy bin according to Brazier (1994). The resulting event fraction was converted into a flux using the effective collection area of the detector and assuming a spectral distribution in energy following a power law with photon index , roughly matching the shape of the cosmic ray background spectrum. More details on the flux calculations can be found in (Aharonian et al. 2006c). This method, in the following referred to as the pulsed fraction method, is less constraining than the on-off-pulse method, since no background subtraction can be performed and thus the post-cut cosmic ray background is treated as an unpulsed component in addition to any unpulsed VHE -ray excess.
Altogether, the pulsed fraction method was considered to be the most robust approach since the structure of the VHE -ray light curve remains unknown a priori. Nevertheless, the on-off-pulse method was still applied to ensure comparability with results from prior searches for pulsed VHE -ray emission where very similar techniques have been used. For the three pulsars for which valid timing parameters were not available for the H.E.S.S. data, PSR J17472958, PSR J18012451 and PSR J18111925, flux limits have been derived only using the unpulsed method.
5 Results
5.1 Point Source Analysis
Table 5 shows the main characteristics of the data sets for each pulsar along with the results of the point source analysis for unpulsed emission. Additionally, any H.E.S.S. VHE -ray source close to the corresponding pulsar position is listed whenever a significant -ray excess was detected which can be attributed to this known source. Note that the excess given may differ significantly from that given in the respective reference, since in all cases, with the exception of the Crab nebula, the VHE emission region is both extended and offset from the pulsar position.
| Pulsar | H.E.S.S. | Reference | |||||
| PSR | [h] | [°] | [GeV] | catalogue source | |||
| B0531+21 | 25.4 | 0.6 | 510 (310) | 164.8 | Crab Nebula | (A) | |
| B083345 | 16.3 | 0.6 | 250 (170) | 2.81 | HESS J0835456 | (B) | |
| B125963 | 55.8 | 0.6 | 380 (280) | 16.7 | HESS J1303638 | (C) | |
| J14206048 | 13.0 | 0.8 | 350 (240) | 12.07 | HESS J1420607 | (D) | |
| B150958 | 35.8 | 0.6 | 310 (210) | 32.22 | HESS J1514591 | (E) | |
| J15245625 | 15.5 | 1.0 | 330 (220) | – | |||
| B170644 | 16.6⋆ | 0.5 | 255 | 0.3 | – | (F) | |
| J17472958 | 103.3 | 1.1 | 200 (140) | 29182 | 3.62 | HESS J1745303 | (G) |
| J18012451 | 9.8 | 1.2 | 180 (130) | – | |||
| J18111925 | 14.2 | 1.1 | 210 (150) | 3.8⋆ | – | ||
| J18261334 | 62.8 | 1.1 | 210 (140) | 11.2 | HESS J1825137 | (H) | |
| ⋆Comprises 14.4 h of 2-telescope data and 2.2 h of data from the full 4-telescope array. ⋆See text. | |||||||
Three of the four pulsars not coincident with known VHE -ray sources – PSR J15245625, PSR B170644, and PSR J18012451 – show no significant signal, but for PSR J18111925 an excess with 3.8 significance is seen. After taking into account all four trials for these target positions, the significance is reduced to 3.5 .
Since the H.E.S.S. energy threshold increases with the zenith angle of observation, the low energy selection cuts introduced in Sec. 3.2 effectively reject all data taken at zenith angles higher than 50° since the effective collection area of the instrument vanishes below 500 GeV -ray energy for these elevations. Therefore the effective exposure time for the low energy analysis is reduced for some data sets compared to that of the standard cuts.
For PSR B170644, only archival data from the early commissioning phase of H.E.S.S. from observations with two telescopes and without an array level trigger are available. Therefore, event timing was determined from the GPS timestamps of the individual cameras. Additionally, the low energy analysis was not performed.
In the special case of PSR B125963, the data set used here differs from that used in Aharonian et al. (2005). Newer data from observations in 2005 are included and data taken before MJD 53135 are excluded. Before this date reliable radio ephemerides could not be provided as the radio pulsar was eclipsed by its binary companion. Additionally, the unpulsed -ray emission, presumably arising from the interaction of the pulsar wind and the stellar outflow, would result in a strong background for any pulsed emission component.
5.2 Search for Pulsations
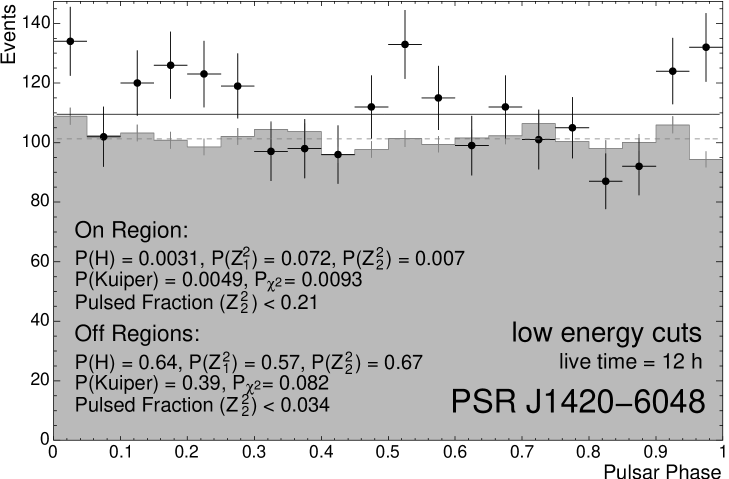
Table 6 shows the results of the statistical tests applied to the phase distributions of events in the on-region around each pulsar position. The probabilities for the hypothesis of a flat phase distribution, i.e. the probability that no pulsed signal exists, are given for the two sets of selection cuts applied. It can be seen that these probabilities lie well above the one per cent level with a single exception. For the low energy analysis of PSR J14206048, the test probabilities seem significantly low, especially for the more powerful H- and Kuiper-tests. No such effect is seen for the respective probability of the background distributions of any data set, which are all above 1%. In Figure 4, the corresponding phase distribution is shown, again for both on and off-events. The off-event distribution is much more compatible with a flat distribution, with probabilities well above 10%. The probability of the H-test for the on-events corresponds to . However, this probability has to be corrected for the number of trials for this test. Considering 19 trials for all data sets analysed with the low-energy (9 trials) and standard (10 trials) selection cuts respectively, the corresponding significance for the applied tests lies between (H-test) and (-test) with an average of . Note that the test results for the pulsars PSR J17472958 and PSR J18012451 for which no valid timing information was available do not allow firm conclusions about the presence of periodicity within the H.E.S.S. data with respect to the intrinsic pulsar rotation period. For PSR J18111925, the tests were not performed since there was no valid timing information available for any period within several years of the H.E.S.S. observation time.
| Pulsar | Low energy cuts | Standard cuts | ||||||||||
| PSR | ||||||||||||
| B0531+21 | 8095 | 0.99 | 0.84 | 0.81 | 0.94 | 0.97 | 10622 | 0.51 | 0.56 | 0.63 | 0.25 | 0.66 |
| B083345 | 7480 | 0.52 | 0.87 | 0.85 | 0.37 | 0.82 | 1156 | 0.79 | 0.92 | 0.90 | 0.98 | 0.88 |
| B125963 | 16176 | 0.78 | 0.92 | 0.90 | 0.65 | 0.71 | 4535 | 0.29 | 0.25 | 0.18 | 0.46 | 0.23 |
| J14206048 | 2228 | 0.0093 | 0.0031 | 0.072 | 0.007 | 0.0049 | 968 | 0.67 | 0.60 | 0.53 | 0.53 | 0.62 |
| B150958 | 12481 | 0.37 | 0.81 | 0.77 | 0.70 | 0.89 | 4308 | 0.048 | 0.055 | 0.027 | 0.11 | 0.04 |
| J15245625 | 2498 | 0.78 | 0.43 | 0.35 | 0.43 | 0.39 | 745 | 0.87 | 0.79 | 0.75 | 0.96 | 0.97 |
| B170644⋆ | – | – | – | – | – | – | 391 | 0.02 | 0.82 | 0.78 | 0.85 | – |
| J18261334 | 14497 | 0.71 | 0.46 | 0.38 | 0.57 | 0.62 | 4016 | 0.46 | 0.42 | 0.34 | 0.34 | 0.42 |
| J17472958⋆ | 23482 | 0.65 | 0.98 | 0.97 | 0.82 | 0.95 | 6340 | 0.62 | 0.62 | 0.92 | 0.99 | 0.96 |
| J18012451⋆ | 3230 | 0.035 | 0.22 | 0.15 | 0.42 | 0.21 | 723 | 0.50 | 0.15 | 0.094 | 0.24 | 0.32 |
| ⋆Subject to analysis limitations (archival data, see text). ⋆Valid pulsar timing information was not available for all data within the H.E.S.S. data set. | ||||||||||||
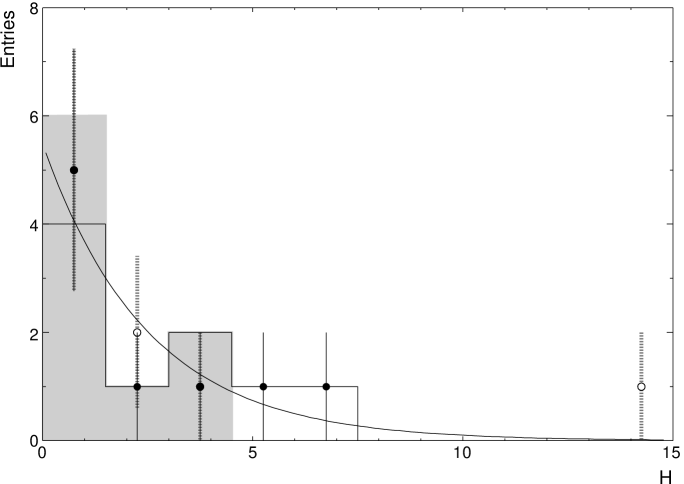
As a cross-check for systematic effects possibly biasing the statistical tests, the ensemble distribution of the test statistic was checked against the hypothesis that no pulsed signal exists in any of the data sets. Figure 5 shows the distribution of the test statistic of the H-test for the on- and off-regions and for the different sets of cuts. Also shown is the expected distribution for the case when no pulsed signal is present in any data set, with depending on the number of tests and . In order to quantitatively evaluate the match between data and expectation, each of the distributions for on- and off-events and for the two sets of cuts was fitted by the respective expected distribution with a log-likelihood method, leaving and as free parameters, and the probability for being compatible with the expected parameters was calculated. No significant deviation is found for any of the four distributions with all probabilities above 20%.
5.3 Flux Upper Limits for Pulsed Emission
Differential energy flux upper limits (i.e. in ) were derived for each data set, for the energy range from threshold energies up to the highest energies for which significant event statistics were accumulated. In Figures 6–11 the differential flux limits calculated are shown separately for each pulsar. Different points are shown for the different limit determination methods (see Sec. 4.3). The points above energies of 0.5 TeV correspond to the results for the standard selection cuts and the points below 0.5 TeV to these for the low energy cuts. The horizontal position of the points denotes the mean energy of the events in each energy bin while the bin edges are indicated by the horizontal error bars. In the case of the pulsed fraction method, the mean energy was calculated for the assumed power law energy spectrum.
Note that the overall -ray energy scale for the standard cuts has a systematic error estimated to be 20% for a power law energy spectrum with (Aharonian et al. 2006c), dominated by the absolute shower energy calibration of the instrument. The impact of the systematic uncertainty in the energy reconstruction method on the flux upper limit for the low-energy cuts was determined to be 30% for energies around the energy threshold of the respective data set, mainly affecting the given flux limit point for the lowest energy bin.
6 Discussion
For the four -ray pulsars, these new results allow some general conclusions on high-energy emission mechanisms of pulsars to be drawn. The results are put in the context of model predictions from selected polar cap and outer gap scenarios. In the particular case of the outer gap scenario, only those model calculations were considered which make explicit predictions for the IC component at TeV energies. Where appropriate, simulated spectra are shown which are calculated using simulation codes from Rudak & Dyks (1999) and Hirotani et al. (2003). Finally, the results can be compared with findings of other experiments in the TeV energy domain.
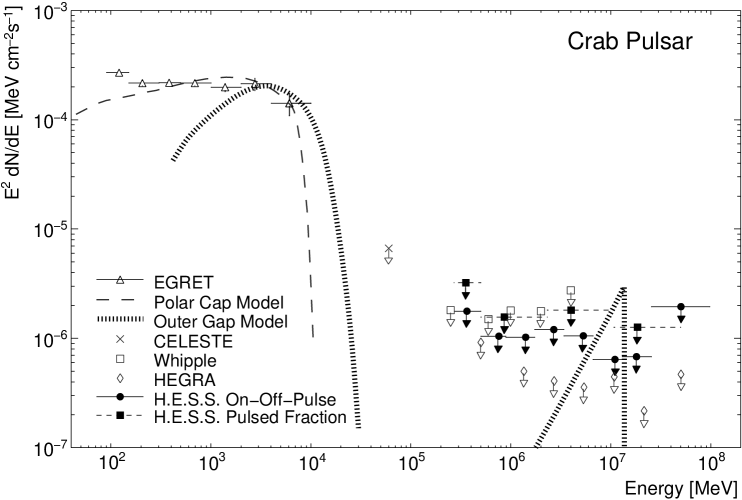
Crab pulsar. The Crab pulsar has been studied by all major ground-based -ray instruments at energies between 60 GeV (de Naurois et al. 2002) and 50 TeV (Aharonian et al. 2004a). Figure 6 shows the new H.E.S.S. results along with -ray measurements from EGRET and selected results in the VHE domain. The southern location of H.E.S.S. allows only observations at rather high zenith angles, prohibiting a deep exposure especially at low energy thresholds. Therefore the limits obtained using the Northern Hemisphere instruments HEGRA, with more than 200 hours of observations, and Whipple, with a lower energy threshold (Lessard et al. 2000), could not be improved upon. However, the HEGRA limits are derived only for a rather narrow pulse region between and 0.04 of the main pulse, whereas the Whipple and H.E.S.S. limits include both the main and secondary pulse regions. Taking the H.E.S.S. results for the on-off-pulse method and assuming a power-law spectrum with exponential cutoff , with , the cutoff energy is constrained to be GeV, less constraining than the flux limit at GeV reported by CELESTE (de Naurois et al. 2002). Our new differential flux upper limits for the Crab pulsar constrain the IC component in the TeV range predicted by (Hirotani & Shibata 2001a), reinforcing the constraints placed by previous -ray experiments, both at GeV and TeV energies. No constraints can be placed on the polar cap prediction, which exhibits a sharp cutoff at a few GeV.
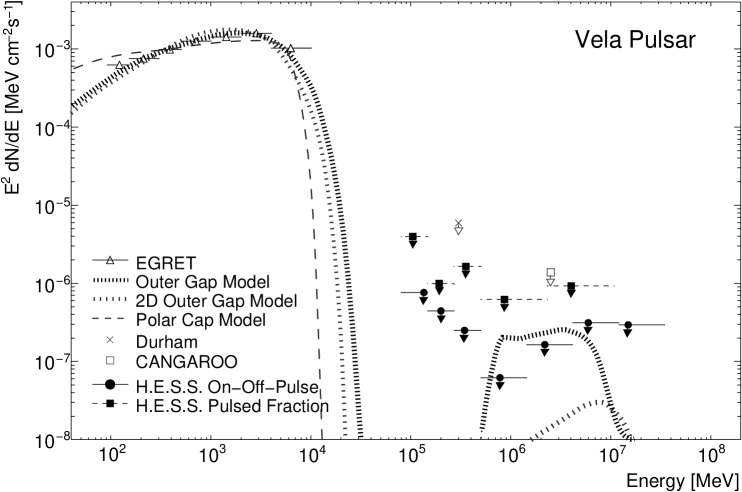
Vela pulsar. For Vela, the limits set using the Durham Mark 6 telescope (Chadwick et al. 2000) and the CANGAROO (Yoshikoshi et al. 1997) detector are improved by more than one order of magnitude in flux and reach down to GeV (see Fig. 7), constraining the cutoff energy for the EGRET power law with to be GeV. Additionally, the H.E.S.S. limits significantly constrain the parameter space for the IC component of the outer gap model (Hirotani et al. 2003), which was computed with a slight change of the gap size (see Hirotani et al. 2003, for details) to better match the EGRET data. Note that in the model calculation of Hirotani et al. (2003), no contribution from the photons of the optical pulse to the outer gap seed photons was considered (Hirotani 2006) which would result in a further increased IC component. On the other hand, a more detailed treatment of the outer gap anisotropy would lead to a decreased IC contribution (Hirotani 2006). A newer, two-dimensional version of the same outer gap model, which includes the contribution from the optical and infrared pulse, predicts a lower IC flux in the TeV range (Takata et al. 2006). The polar cap model again predicts pulsed emission only at energies far below the energy threshold of current ground-based -ray detectors.
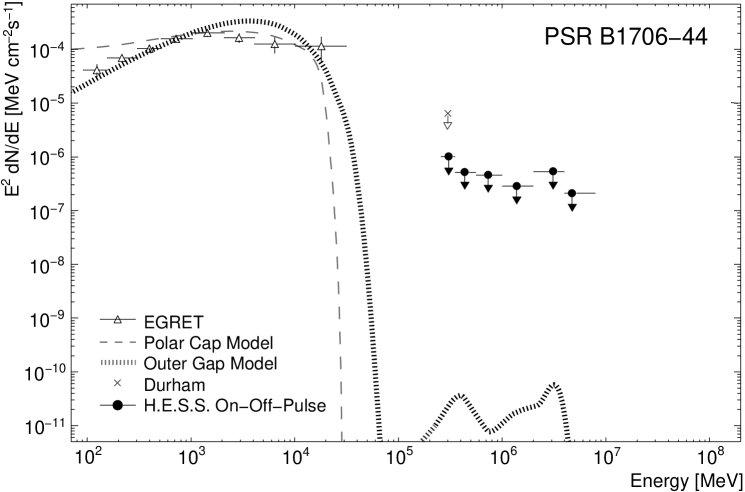
PSR B170644. For this pulsar, limits on pulsed -ray emission were previously reported by Chadwick et al. (2000). Although H.E.S.S. data were mostly limited to 2-telescope data from the commissioning phase to which only the on-off-pulse method has been applied, more restrictive limits could be set (see Fig. 8), constraining the exponential cutoff energy to be GeV using the power law fit of the EGRET spectrum with . However, the IC component in the outer gap scenario of Hirotani et al. (2003) is left unconstrained by several orders of magnitude.
PSR B150958. The rather strong unpulsed VHE -ray emission of the PWN surrounding PSR B150958 decreases the flux sensitivity for pulsed emission in comparison with other pulsars. The limits shown in Fig. 9 represent the first sensitive search for sub-TeV -rays from this pulsar. The IC component of an outer gap model prediction (Hirotani & Shibata 2001b, dotted curve, parameters ) can be ruled out by the H.E.S.S. limits, although the curvature radiation component seems to be already marginally constrained by the EGRET limits at energies MeV.


The remaining pulsars have not been detected in the MeV–GeV range and no detailed calculations based on any high-energy emission models are available for the TeV range.
Independent of any -ray emission scenario, for all selected pulsars the flux limits obtained imply an upper limit on the ratio of the total pulsed VHE -ray luminosity compared to the pulsars’ spin-down power in the range to . This limit on the -ray efficiency is significantly lower than the corresponding EGRET sensitivity in the GeV range.
7 Conclusions
H.E.S.S. data on young and energetic pulsars, including four of the eight known GeV -ray pulsars, have been searched for evidence of pulsed -ray emission at energies between 100 GeV and 100 TeV. No conclusive evidence for pulsed emission has been found and differential upper limits on the pulsed flux were derived using a variety of different methods, constraining the pulsed flux for a wide range of possible pulse shapes and spectra in the VHE -ray range.
In the case of the well-studied -ray pulsars Crab, Vela, and PSR B150958, the pulsed flux upper limits reported here significantly constrain the inverse Compton component of selected outer gap models for flux predictions in the TeV range which were available at the time of writing. However, the results cannot rule out the outer gap scenario in general, since not all of the different calculations published give predictions for the IC component. Also, free model parameters such as seed photon density, inclination, gap geometry or viewing angles can be adjusted for the model cases considered here. However, it remains an open challenge for theory to provide reasonable parameters consistent with the flux limits reported here.
For the complete sample of pulsars, containing a large fraction of the most energetic pulsars currently known, the absence of pulsed VHE -ray emission already disfavours a significant contribution of the IC component to the energy loss mechanism of these pulsars. This sample exhibits great variety in different pulsar characteristics, providing valuable input to further studies of the outer gap IC component. For example, in the case of the binary pulsar PSR B125963, a large spin-down luminosity is accompanied by a rather weak magnetic field, i.e. reduced -ray absorption by pair creation, and additionally the photon field originating from the companion star provides a high density target with known energy spectrum for a possible pulsed IC component, fixing an otherwise uncertain model parameter.
Although in several cases there is spatial coincidence with extended TeV -ray emission, pulsed emission is not detected in VHE -rays. In particular, the flux upper limits derived are of the order of to of the pulsar spin-down flux, underlining the non-magnetospheric origin of the TeV radiation component and supporting the widely accepted scenario of an effective energy transport mechanism to, and strong particle acceleration in, the pulsar wind nebula.
Finally, the upper limits given here imply a steep turnover of the pulsed high-energy spectrum at energies of a few tens of GeV for all pulsars studied which have established high-energy ( keV) emission, confirming a prediction common to all pulsar models. Moreover, for the remaining pulsars, a turnover at sub-TeV energies would be likely even if pulsed GeV -ray emission with spectral properties similar to that of the established -ray pulsars is detected with future sensitive instruments (Thompson 2004). However, the different scenarios for pulsar emission differ significantly in their predictions of the exact shape and energy of the turnover. Thus, the search for pulsed -ray emission from pulsars provides interesting prospects for future satellite-based and low-threshold ground-based -ray instruments.
Acknowledgements.
The support of the Namibian authorities and of the University of Namibia in facilitating the construction and operation of H.E.S.S. is gratefully acknowledged, as is the support by the German Ministry for Education and Research (BMBF), the Max Planck Society, the French Ministry for Research, the CNRS-IN2P3 and the Astroparticle Interdisciplinary Programme of the CNRS, the U.K. Particle Physics and Astronomy Research Council (PPARC), the IPNP of the Charles University, the South African Department of Science and Technology and National Research Foundation, and by the University of Namibia. We appreciate the excellent work of the technical support staff in Berlin, Durham, Hamburg, Heidelberg, Palaiseau, Paris, Saclay, and in Namibia in the construction and operation of the equipment.References
- Aharonian et al. (2005) Aharonian, F., Akhperjanian, A. G., Aye, K.-M., et al. 2005, A&A, 442, 1
- Aharonian et al. (2004a) Aharonian et al. (HEGRA collaboration). 2004a, ApJ, 614, 897
- Aharonian et al. (2004b) Aharonian et al. (H.E.S.S. collaboration). 2004b, Astropart. Phys., 22, 109
- Aharonian et al. (2005a) Aharonian et al. (H.E.S.S. collaboration). 2005a, A&A, 442, L25
- Aharonian et al. (2005b) Aharonian et al. (H.E.S.S. collaboration). 2005b, A&A, 435, L17
- Aharonian et al. (2005c) Aharonian et al. (H.E.S.S. collaboration). 2005c, A&A, 430, 865
- Aharonian et al. (2005d) Aharonian et al. (H.E.S.S. collaboration). 2005d, A&A, 432, L9
- Aharonian et al. (2006a) Aharonian et al. (H.E.S.S. collaboration). 2006a, A&A, 456, 245
- Aharonian et al. (2006b) Aharonian et al. (H.E.S.S. collaboration). 2006b, A&A, 448, L43
- Aharonian et al. (2006c) Aharonian et al. (H.E.S.S. collaboration). 2006c, A&A, 457, 899
- Aharonian et al. (2006d) Aharonian et al. (H.E.S.S. collaboration). 2006d, ApJ, 636, 777
- Arons (1983) Arons, J. 1983, ApJ, 266, 215
- Backer & Hellings (1986) Backer, D. C. & Hellings, R. W. 1986, ARA&A, 24, 537
- Berge et al. (2006) Berge, D., Funk, S., & Hinton, J. 2006, astro-ph/0610959
- Bernlöhr et al. (2003) Bernlöhr, K., Carrol, O., Cornils, R., et al. 2003, Astropart. Phys., 20, 111
- Blandford & Teukolsky (1976) Blandford, R. & Teukolsky, S. A. 1976, ApJ, 205, 580
- Borgmeier et al. (2003) Borgmeier, C., Komin, N., de Naurois, M., et al. 2003, in International Cosmic Ray Conference, 2891
- Brazier (1994) Brazier, K. T. S. 1994, MNRAS, 268, 709
- Buccheri et al. (1983) Buccheri, R., Bennett, K., Bignami, G. F., et al. 1983, A&A, 128, 245
- Camilo et al. (2002) Camilo, F., Manchester, R. N., Gaensler, B. M., & Lorimer, D. R. 2002, ApJ, 579, L25
- Chadwick et al. (2000) Chadwick, P. M., Lyons, K., McComb, T. J. L., et al. 2000, ApJ, 537, 414
- Cheng et al. (1986a) Cheng, K. S., Ho, C., & Ruderman, M. 1986a, ApJ, 300, 500
- Cheng et al. (1986b) Cheng, K. S., Ho, C., & Ruderman, M. 1986b, ApJ, 300, 522
- Cheng et al. (2000) Cheng, K. S., Ruderman, M., & Zhang, L. 2000, ApJ, 537, 964
- Cheng et al. (2004) Cheng, K. S., Taam, R. E., & Wang, W. 2004, ApJ, 617, 480
- Chiang & Romani (1992) Chiang, J. & Romani, R. W. 1992, ApJ, 400, 629
- Chiang & Romani (1994) Chiang, J. & Romani, R. W. 1994, ApJ, 436, 754
- Cominsky et al. (1994) Cominsky, L., Roberts, M., & Johnston, S. 1994, ApJ, 427, 978
- Cornils et al. (2003) Cornils, R., Gillessen, S., Jung, I., et al. 2003, Astropart. Phys., 20, 129
- Daugherty & Harding (1996) Daugherty, J. K. & Harding, A. K. 1996, ApJ, 458, 278
- de Jager et al. (1989) de Jager, O. C., Raubenheimer, B. C., & Swanepoel, J. W. H. 1989, A&A, 221, 180
- de Naurois et al. (2002) de Naurois, M., Holder, J., Bazer-Bachi, R., et al. 2002, ApJ, 566, 343
- Dermer & Sturner (1994) Dermer, C. D. & Sturner, S. J. 1994, ApJ, 420, L75
- Dyks & Rudak (2003) Dyks, J. & Rudak, B. 2003, ApJ, 598, 1201
- Dyks & Rudak (2004) Dyks, J. & Rudak, B. 2004, Advances in Space Research, 33, 581
- Fairhead et al. (1988) Fairhead, L., Bretagnon, P., & Lestrade, J.-F. 1988, in IAU Symp. 128: The Earth’s Rotation and Reference Frames for Geodesy and Geodynamics, ed. A. K. Babcock & G. A. Wilkins, 419
- Feldman & Cousins (1998) Feldman, G. J. & Cousins, R. D. 1998, Phys. Rev. D, 57, 3873
- Fierro et al. (1998) Fierro, J. M., Michelson, P. F., Nolan, P. L., & Thompson, D. J. 1998, ApJ, 494, 734
- Funk et al. (2004) Funk, S., Hermann, G., Hinton, J., et al. 2004, Astroparticle Physics, 22, 285
- Gaensler et al. (2004) Gaensler, B. M. et al. 2004, ApJ, 616, 383
- Gavriil et al. (2004) Gavriil, F. P., Kaspi, V. M., & Roberts, M. S. E. 2004, Advances in Space Research, 33, 592
- Hillas (1985) Hillas, A. 1985, in Proc. 19th ICRC, La Jolla, 445
- Hinton et al. (2006) Hinton, J., Hermann, G., Krötz, P., & Funk, S. 2006, Astropart. Phys., 26, 22
- Hirotani (2006) Hirotani, K. 2006, private communication
- Hirotani et al. (2003) Hirotani, K., Harding, A. K., & Shibata, S. 2003, ApJ, 591, 334
- Hirotani & Shibata (2001a) Hirotani, K. & Shibata, S. 2001a, ApJ, 558, 216
- Hirotani & Shibata (2001b) Hirotani, K. & Shibata, S. 2001b, MNRAS, 325, 1228
- Hofmann (2003) Hofmann, W. 2003, in International Cosmic Ray Conference, 2811
- Jetsu & Pelt (1996) Jetsu, L. & Pelt, J. 1996, A&AS, 118, 587
- Kramer et al. (2003) Kramer, M., Bell, J. F., Manchester, R. N., et al. 2003, MNRAS, 342, 1299
- Kuiper et al. (1999) Kuiper, L., Hermsen, W., Krijger, J. M., et al. 1999, A&A, 351, 119
- Lessard et al. (2000) Lessard, R. W., Bond, I. H., Bradbury, S. M., et al. 2000, ApJ, 531, 942
- Lyne et al. (2005) Lyne, A. G., Jordan, C. A., & Roberts, M. E. 2005, Jodrell Bank Crab Pulsar monthly ephemeris, ftp://ftp.jb.man.ac.uk/pub/psr/crab/all.gro
- Manchester et al. (2005) Manchester, R. N., Hobbs, G. B., Teoh, A., & Hobbs, M. 2005, http://www.atnf.csiro.au/research/pulsar/psrcat/, AJ, 129, 1993
- Manchester, R. et al. (2005) Manchester, R. et al. 2005, ATNF pulsar timing archive, http://www.atnf.csiro.au/research/pulsar/archive/
- Muslimov & Harding (2003) Muslimov, A. G. & Harding, A. K. 2003, ApJ, 588, 430
- Ng et al. (2005) Ng, C.-Y., Roberts, M. S. E., & Romani, R. W. 2005, ApJ, 627, 904
- Ong (2006) Ong, R. A. 2006, ArXiv Astrophysics e-prints, astro-ph/0605191
- Romani (1996) Romani, R. W. 1996, ApJ, 470, 469
- Rudak & Dyks (1999) Rudak, B. & Dyks, J. 1999, MNRAS, 303, 477
- Ruderman & Sutherland (1975) Ruderman, M. A. & Sutherland, P. G. 1975, ApJ, 196, 51
- Standish (1982) Standish, E. M. 1982, A&A, 114, 297
- Sturrock (1971) Sturrock, P. A. 1971, ApJ, 164, 529
- Takata et al. (2006) Takata, J., Shibata, S., Hirotani, K., & Chang, H.-K. 2006, MNRAS, 366, 1310
- Taylor et al. (2000) Taylor, J. H., Manchester, R. N., Nice, D. J., et al. 2000, TEMPO v11.005, http://pulsar.princeton.edu/tempo/
- Thompson (2004) Thompson, D. J. 2004, in IAU Symposium, ed. F. Camilo & B. M. Gaensler, 399
- Thompson et al. (1999) Thompson, D. J., Bailes, M., Bertsch, D. L., et al. 1999, ApJ, 516, 297
- Thompson et al. (1996) Thompson, D. J., Bailes, M., Bertsch, D. L., et al. 1996, ApJ, 465, 385
- Torii et al. (1997) Torii, K., Tsunemi, H., Dotani, T., & Mitsuda, K. 1997, ApJ, 489, L145
- Vincent et al. (2003) Vincent, P., Denance, J.-P., & Huppert, J.-F. et al. 2003, in Proc. 28th ICRC, Tsukuba (Univ. Academy Press, Tokyo), 2887
- Yoshikoshi et al. (1997) Yoshikoshi, T., Kifune, T., Dazeley, S. A., et al. 1997, ApJ, 487, L65
- Zhang & Cheng (1997) Zhang, L. & Cheng, K. S. 1997, ApJ, 487, 370