Metal Enriched Outflows and Dusty starburst in the type II quasar Q 1321+058
Abstract
We present an analysis of the emission line property and the broad band spectral energy distribution of the ultra-luminous infrared Type II quasar Q132+058. The optical and ultraviolet emission lines show four distinct components: a LINER-like component at the systematic velocity, a heavily reddened HII-like component blueshifted by about 400km s-1, and two broad components blueshifted by about 400km s-1and 1900km s-1, respectively. The emission line ratios suggest that broad components are produced in dense and -enriched outflows with a metalicity of 3-5Z⊙ and a density of . The optical–UV continuum is dominated by stellar light and can be modeled with a young ( Myr) plus an intermediate age (0.5-0.8Gyr) stellar populations. The near to mid-infrared light is dominated by hot and warm dust heated by the hidden quasar. We derive a star formation rate (SFR) of 300-500 M⊙ yr-1 from the UV spectrum and far-infrared luminosity, which is two orders of magnitude larger than that indicated by reddening uncorrected [OII] luminosity.
1.Center for Astrophysics, University of Science and Technology of China, Hefei, 230026, China
2.National Astronomical Observatories/Yunnan Observatory, CAS, Kunming, Yunnan, P.O. BOX 110, P.R.China
1. Introduction
Mounting evidence has been found in the past decade that quasar activity is triggered through merging of two gas-rich massive galaxies. Merging also leads to starburst in both the nucleus and the extended region. As such, most of these systems show up as luminous or ultra-luminous infrared galaxies (ULIRGs, ⊙). The connection between ULIRGs and quasars has been widely discussed, and there is evidence for an evolution sequence between the two (e.g., Sanders et al. 1996).
We present here only a brief account of the results from an analysis of the optical/ultraviolet spectra and the broad band properties of the ULIRG Q 1321+058. Detailed analysis and discussion will be presented elsewhere (Wang et al. 2007, in preparation). The object was classified as a quasar based on a low resolution spectrum taken in an attempt of optical identification of HEAO-A2 X-ray sources (Remillard et al. 1993). However, it was not detected by XMM Newton (Bianchi et al. 2005), which led those authors to propose that it is a Compton-thick type II object. Its HST images show an elongated tidal tail and a bright nucleus, indicating a merger at a later stage.
2. Data analysis and results
Its SDSS spectrum and HST FOS spectrum were extracted from the archives and were corrected for the Galactic reddening. The emission line profile of [OIII] is complex and is clearly resolved into multiple components, as shown by Lipari et al. (2003). The similar line profiles of H and H to that of the [OIII] line rule out that it is a Type I AGN. The optical continuum is dominated by stellar light with noticeable absorption in high order Balmer lines. The broad UV and optical continuum can be fairly well fitted by a model composed of two reddened stellar populations: an intermediate-aged stellar population of 0.5-0.8 Gyr and a young stellar population with an age 1 Myr using the stellar templates STARBURST99 (Leither et al. 1999;) in UV and the single stellar population spectra in GALAXEV (Bruzual & Charlot 2003) in optical. For a Salpeter initial mass function that extends to 0.08M⊙, the stellar mass of the two populations are 4.5 and 5.8 M⊙, respectively.
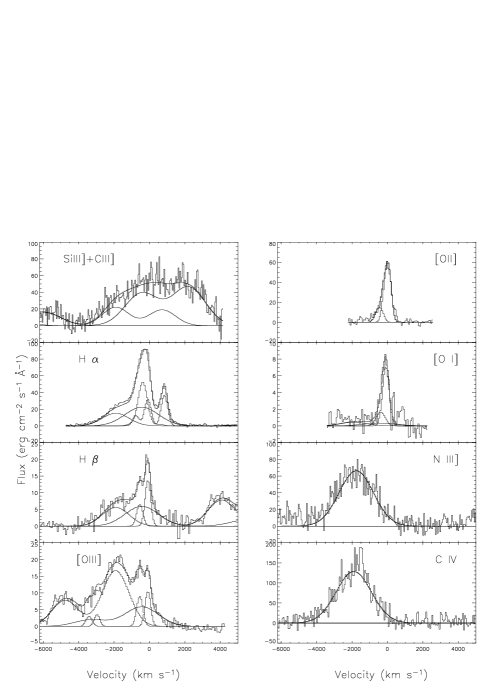
The emission line profiles show four distinct components. The CIV1548, 1550 and NIII]1750 show single-peak profiles blueshifted by 2,000 km s-1relative to the systematic redshift determined from the stellar absorption lines, and can be well fitted with a single Gaussian (see Fig LABEL:fig3). [OII] 3726, 3729, [OI]6302 and [SII]6713, 6731 display a single-peaked profile at the systematic velocity. The [NII] line may also be single peaked but badly blended with the H line. The [OIII]4959, 5007, H, [NeIII]3896 lines show two more components in addition to the above two: a narrow component and a second broad component blue-shifted by 400 km s-1relative to the systematic velocity. The less blueshifted broad-component is also found in AlIII, CIII], SiIII], H. We refer the four components to as: C1 – the narrow component at the systematic velocity; C2–the narrow blueshifted component; C3–the broad component with a smaller blueshift; C4–the broad component with a large bueshift.
We fit the emission line profiles with 4 gaussian components (Fig 1). The C1 component locates in the LINER region on the BPT diagram, while C2 is in the HII regime and is highly reddened. It is noted that both SiIII]/CIII] 1 and NIII]/CIV 0.56 are among the highest known values for quasars.
3. Discussions
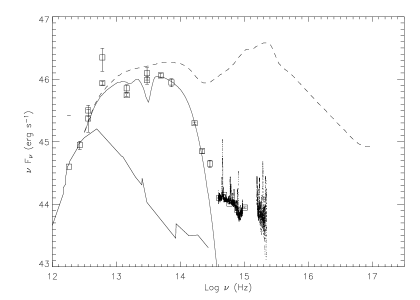
The broad band spectral energy distribution (SED) of Q 1321+058 as shown in Fig 2 is consistent with that of a Type II quasar: the steep rise from near to mid-infrared and no apparent absorption or emission features around 10 m suggest that the mid-infrared emission is dominated by an active nucleus. The integrated infrared luminosity is around 2 erg s-1. The far-infrared luminosity is similar to that of NGC 6240. If most far-infrared emission is attributed to star formation (Schweitzer et al. 2006), the star formation rate (SFR) will be about 300M⊙ yr-1, comparable to that inferred from the young stellar population. However, the luminosity of the narrow [OII] component gives an upper limit of SFR 1.5 M⊙ yr-1, which is two orders of magnitudes lower than the SFR in the galaxy. This can be explained if the star-formation is obscured, which is also suggested by the reddening of the the narrow components based on their Balmer decrements. Applying extinction correction using the Balmer decrement brings the two SFRs to good agreement.
We used version C06.02c of Cloudy, last described by (Ferland 1998), to explore the physical parameters of the emission regions by re-producing the observed line ratios for the broad components. For the solar abundances or scaled solar abundances, a large SiIII]/CIII] value can be reproduced only for high gas density (cm -3), while a much lower density ( cm-3) is required to explain the observed the [OIII]4363/[OIII]5007 ratio and the [NeIII]3896/[OIII]5007 ratio. Multiple phase medium has the difficulty that the ionization parameters for the two phases would be largely different under the reasonable assumption that they are exposed to the same ionizing continuum. A self-consistent solution can be found if the metal abundance is 5 times the solar value for a constant density model with a metal enriched scheme outlined by Hamann and Ferland (1993). The density of the emission line gas is around cm-3, and the ionization parameters around U=10-2 for C3 and 10-1.5 for C4. This places the emission line gas at a distance from the AGN of 500 pc for the C3 and 200 pc for the C4 emission region, provided that the AGN has the broad band SED similar to the average of blue quasars in Richards et al. (2006). These distances are likely outside the dusty torus, which explains their low extinctions.
The projected velocity of the blue component reaches 4,000 km s-1 at the blue wing for the C4 component. Q 1321+058 would appear as a BAL QSO provided that the line of sight intersected the outflow. We estimate from the broad H luminosity a minimum mass to be 600 M⊙for the C3 and 300 M⊙for the C4 components, assuming the emission line gas is HII dominated and Case-B recombination. The mass loss rate in this cold component is not important if most of the gas is visible on a dynamic time scale. However, the filling factor is extremely small (), indicating a possible two-phase medium in which the hot phase gas dominates the cold one.
Acknowledgments.
This work is supported by Chinese Natural Science Foundation through CNSF-10233030, CNSF-10573015 and CNSF-10473013.
References
- Bianchi et al. (2005) Bianchi, S., et al. 2005, A&A, 442, 185
- Bruzuel & Charlot (2003) Bruzual, G., & Charlot, S. 2003, MNRAS, 344, 1000
- Ferland et al. (1998) Ferland, G. J., et al. 1998, PASP, 110, 761
- Hamann & Ferland (1993) Hamann, F., & Ferland, G. 1993, ApJ, 418, 11
- Leitherer et al. (1999) Leitherer, C., et al. 1999, ApJS, 123, 3
- Lípari et al. (2003) Lípari, S., et al. 2003, MNRAS, 340, 289
- Remillard et al. (1993) Remillard, R. A., et al. 1993, AJ, 105, 2079
- Richards et al. (2006) Richards, G. T., et al. 2006, Richards, G. T., et al. 2006, ApJS, 166, 470
- Sanders & Mirabel (1996) Sanders, D. B., & Mirabel, I. F. 1996, ARA&A, 34, 749
- Schweitzer et al. (2006) Schweitzer, M., et al. 2006, ApJ, 649, 79