11email: beuther@mpia.de 22institutetext: James Cook University, Townsville, QLD 4811, Australia
22email: Andrew.Walsh@jcu.edu.au 33institutetext: Max-Planck-Institut für Radioastronomie, Auf dem Hügel 69, 53121 Bonn, Germany
33email: sthorwirth@mpifr-bonn.mpg.de 44institutetext: Harvard-Smithsonian Center for Astrophysics, 60 Garden Street, Cambridge, MA 02138, USA
44email: zhang@cfa.harvard.edu 55institutetext: NRAO, 520 Edgemont Rd, Charlottesville, VA 22903
55email: thunter@nrao.edu 66institutetext: Ritter Observatory, Department of Physics and Astronomy, University of Toledo, Toledo, OH 43606-3390, USA
66email: megeath@astro1.panet.utoledo.edu
Hot ammonia in NGC6334I & I(N)
Abstract
Aims. The massive twin cores NGC6334I and I(N) are in different evolutionary stages and hence ideal targets to study evolutionary variations within the same larger-scale environment. Here, we study the warm, compact gas components.
Methods. We imaged the two regions with the Australia Telescope Compact Array (ATCA) at high angular resolution in the NH3(3,3) to (6,6) inversion lines.
Results. Compact emission is detected toward both regions in all observed inversion lines with energy levels up to 407 K above ground. This is particularly surprising for NGC6334I(N) since it lacks bright infrared emission and is considered a massive cold core at an early evolutionary stage. High optical depth and multiply-peaked line profiles complicate rotation temperature estimates, and we can only conclude that gas components with temperatures K are present in both regions. Toward NGC6334I, we confirm previous reports of NH3(3,3) maser emission toward the outflow bow-shocks. Furthermore, we report the first detection of an NH3(6,6) maser toward the central region of NGC6334I. This maser is centered on the second millimeter (mm) peak and elongated along the outflow axis, indicating that this mm continuum core harbors the driving source of the molecular outflow. Toward the main mm peak in NGC6334I(N), we detect a double-horn line profile in the NH3(6,6) transition. The current data do not allow us to differentiate whether this double-horn profile is produced by multiple gas components along the line of sight, or whether it may trace a potential underlying massive accretion disk. The data to Figures 3 to 7 are also available in electronic form at the CDS via anonymous ftp to cdsarc.u-strasbg.fr (130.79.128.5) or via http://cdsweb.u-strasbg.fr/cgi-bin/qcat?J/A+A/.
Key Words.:
techniques: interferometric — stars: early type — stars: formation — ISM: individual (NGC6334I & I(N)) — line: profiles — masers1 Introduction
The massive star-forming regions NGC6334I & I(N) are located at the north-eastern end of the NGC6334 molecular cloud/Hii region complex at an approximate distance of 1.7 kpc in the southern hemisphere (Neckel 1978; Straw & Hyland 1989). The whole NGC6334 complex has been subject to intense studies in many wavelength bands for more than two decades (e.g., McBreen et al. 1979; Rodríguez et al. 1982; Gezari 1982; Loughran et al. 1986; de Pree et al. 1995; Tapia et al. 1996; Sandell 2000; Carral et al. 2002; Beuther et al. 2005; Hunter et al. 2006).
The region NGC6334I contains the well known cometary-shaped Ultracompact Hii (UCHii) region NGC6334F and associated molecular gas and dust emission. Various maser types were found, from H2O masers (Moran & Rodríguez 1980; Forster & Caswell 1989) and OH masers (Gaume & Mutel 1987; Brooks & Whiteoak 2001) to Class ii CH3OH maser emission (Norris et al. 1993; Caswell 1997; Walsh et al. 1998). Furthermore, mid-infrared imaging has identified a potential exciting star for the UCHii region (De Buizer et al. 2002). The main molecular gas and dust peaks are located at the north-western edge of the UCHii region (e.g., Kraemer & Jackson 1995; Beuther et al. 2005; Hunter et al. 2006). Multi-frequency submillimeter (submm) and millimeter (mm) dust continuum imaging indicates dust temperatures of the order 100 K (Sandell 2000). Single-dish molecular line surveys revealed a rich line forest (e.g., McCutcheon et al. 2000; Thorwirth et al. 2003; Schilke et al. 2006) comparable to those observed toward hot core regions like Orion-KL. A molecular outflow has been observed with a velocity range of approximately 150 km s-1 (Bachiller & Cernicharo 1990; Leurini et al. 2006). NH3(3,3) maser as well as shocked H2 emission was reported toward the end of the outflow lobes (Kraemer & Jackson 1995; Davis & Eisloeffel 1995; Persi et al. 1996; Megeath & Tieftrunk 1999).
The source NGC6334I(N) is located approximately to the north of NGC6334I. It also exhibits strong (sub)mm continuum emission but at lower temperatures (30 K). Molecular line surveys of NGC6334I(N) revealed that most species exhibit fainter emission than that found toward NGC6334I, although there are some species like HC3N which are stronger in NGC6334I(N) (Megeath & Tieftrunk 1999; McCutcheon et al. 2000; Thorwirth et al. 2003; Sollins & Megeath 2004). No mid-infrared and only weak near-infrared emission has been detected toward NGC6334I(N) by Tapia et al. (1996). Recent deeper near-infrared imaging has found evidence for a cluster of low-mass stars in this region (Persi et al. 2005). Carral et al. (2002) report the detection of two faint cm continuum sources, one of them associated with Class ii CH3OH maser emission (Caswell 1997; Walsh et al. 1998). Furthermore, Kogan & Slysh (1998) observed a cluster of Class i CH3OH masers, and Megeath & Tieftrunk (1999) detected a bipolar outflow in north-west south-east direction in the thermal SiO emission. NGC6334I(N) is considered to be the younger of the two regions.
To better characterize this intriguing pair of massive star-forming regions, we started an observational campaign with the Australia Telescope Compact Array (ATCA) and the Submillimeter Array (SMA) from centimeter (cm) to submm and mm wavelengths. Beuther et al. (2005) investigated the regions with the ATCA in the NH3(1,1) and (2,2) lines as well as CH3OH emission near 25 GHz. They found compact hot gas cores in all lines toward NGC6334I, however, in NGC6334I(N) only extended NH3 emission, and no thermal CH3OH at the observed frequencies, was detected. Toward both regions, the temperatures were too high to derive reasonable rotational temperatures with the low-energy-level NH3 transitions. Hunter et al. (2006) identified multiple mm continuum sources in both regions (four in NGC6334I and seven in NGC6334I(N)). Furthermore, an additional north-east south-west outflow is identified toward NGC6334I(N) (Hunter et al. in prep.), oriented approximately perpendicular to the one previously reported by Megeath & Tieftrunk (1999).
To get a better understanding of the hot gas components toward the twin cores NGC6334I and I(N), here we report a follow-up study of the NH3(3,3) to (6,6) inversion lines with the ATCA.
2 Observations
We observed NGC6334I & I(N) in November 2005 during two nights with the ATCA in the compact 750D configuration, also including antenna 6. This results, at 25 GHz, in projected baselines between 3.8 and 369 k. The phase reference centers were R.A. (J2000) , Decl. (J2000) for NGC6334I and R.A. (J2000) , Decl. (J2000) for NGC6334I(N). We observed the NH3(3,3), (4,4), (5,5), and (6,6) inversion lines with the frequencies of the main hyperfine components at 23.870, 24.139, 24.533, and 25.056 GHz, respectively. The velocities relative to the local standard of rest () for NGC6334I and NGC6334I(N) are and km s-1, respectively. Good uv-coverage was obtained through regular switching between both sources and the four spectral setups. On-source integration times for each of the NH3(3,3) and (4,4) lines, in both sources, were 220 minutes. The (5,5) and (6,6) lines were observed each for 200 min in NGC6334I and for 190 min in NGC6334I(N). The spectral resolution of the observations was 62 kHz, corresponding to a velocity resolution of km s-1. The primary beam of the ATCA at the given frequency is . The data were reduced with the MIRIAD package. Applying a robust weighting of 1 (closer to natural than uniform weighting, thus stressing the shorter baselines) the synthesized beam is . The rms per 1 km s-1 channel is 3 mJy.
3 Results
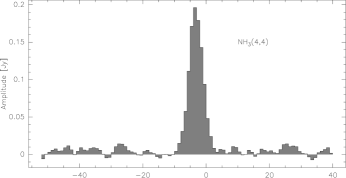
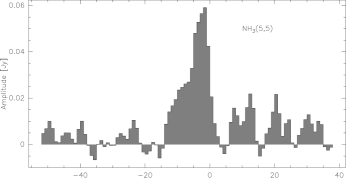
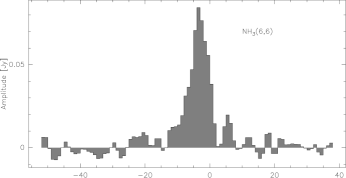
The four observed NH3 inversion lines cover a broad range of energy levels above ground with lower energy levels between 123 and 407 K ( K, K, K, K). The previous NH3(1,1) and (2,2) data of Beuther et al. (2005) extend the range of observed energy levels down to 23 K. Hence, we are able to trace various temperature components throughout the two star-forming regions. All 6 inversion lines up to NH3(6,6) were detected in both target regions (Figs. 1 & 2). While this is less surprising for NGC6334I, the northern source NGC6334I(N) lacks strong infrared emission and is considered a prototypical massive cold core at a very early stage of star formation (e.g., Gezari 1982). While it is still considered to be a very young source, the detection of the high energy level transitions up to NH3(6,6) clearly shows that compact warm gas components already exist at this early evolutionary stage. We discuss both regions separately first.

3.1 NGC6334I
3.1.1 Hot thermal NH3 emission
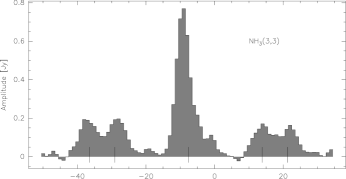
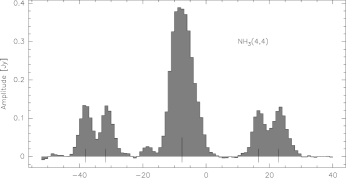
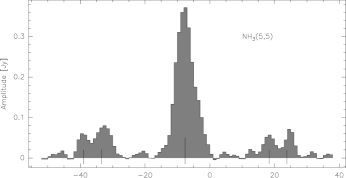
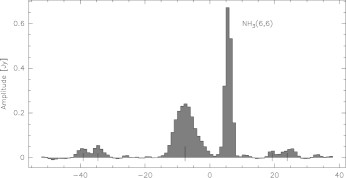
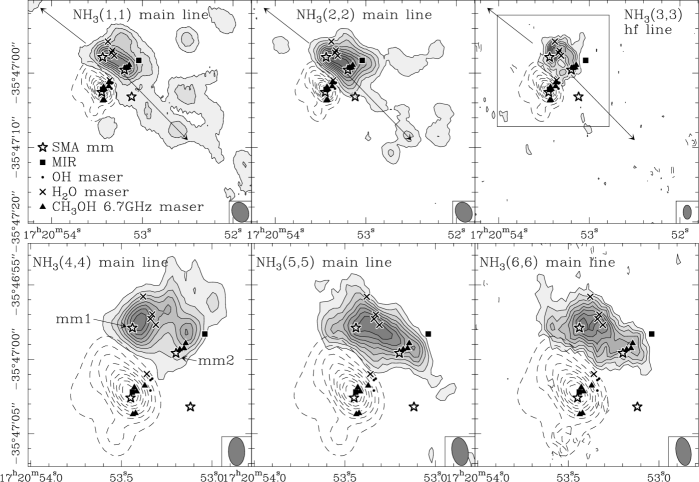
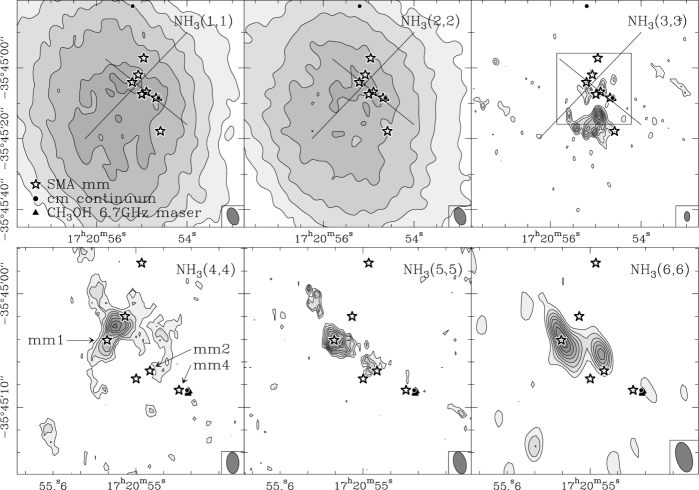
The uv-spectra taken on the shortest baseline in NGC6334I (Fig.1) are rare examples showing even the satellite hyperfine components, in the highly excited NH3(5,5) and (6,6) lines, in emission (26 and 31 km s-1 offset from the ). Figure 3 presents integrated images of all 6 NH3 inversion transitions from the (1,1) to the (6,6) transition (the (1,1), (2,2) and cm continuum images are adapted from Beuther et al. 2005). Except for the (3,3) line, we show the integrated emission of the main central hyperfine line. Only for the (3,3) transition we integrated over the two hyperfine components at higher frequencies (negative velocities) because the main line is contaminated by maser emission (see Kraemer & Jackson 1995 and section 3.1.2 below).
The NH3(1,1) and (2,2) maps show two peaks associated with the two main mm continuum sources, mm1 and mm2, reported by Hunter et al. (2006). While the two peaks have approximately the same intensities in the low-energy NH3 lines, the mm dust continuum flux density of mm1 is approximately 1.5 times higher than that of mm2 (Hunter et al. 2006). The NH3(3,3) hyperfine map shows emission toward the north-eastern mm source, mm1, and only weaker emission toward the south-western mm source, mm2. Re-inspecting the NH3(1,1) and (2,2) data, integrated maps of their satellite hyperfine lines are also stronger toward mm1 than toward mm2, although the main hyperfine lines show the same intensities toward both mm peaks. This indicates that the NH3 optical depth toward mm2 has to be lower than toward mm1. The higher NH3 inversion lines all show a bright emission peak near mm1, and a much weaker peak near mm2. Particularly in the NH3(4,4) and (5,5) lines, this weaker peak is shifted to the west of mm2 toward the mid-infrared source detected by De Buizer et al. (2002). Although in the lower energy NH3 lines the two mm peaks appear similar, the fact that the higher energy lines are much stronger toward mm1 indicates that this is the warmer of two sources.
One of the aims of this study is to get temperature estimates of the warm gas. We identify the positions of the two main molecular line peaks with the NH3(6,6) emission peak (R.A. (J2000) 17:20:53.42, Dec (J2000) -35:46:57.7, offset from the phase center) near mm1, and one Class ii CH3OH maser feature (R.A. (J2000) 17:20:53.18, Dec (J2000) -35:46:59.3, Caswell 1997; Walsh et al. 1998, offset from the phase center) near mm2. The spectra of all four newly observed lines toward these two positions are presented in Fig. 4. Fitting of the hyperfine structure was done in CLASS which is part of the GILDAS software suite111See http://www.iram.fr/IRAMFR/GILDAS. Recent frequency measurements for NH3 and its deuterated variants (Coudert & Roueff 2006) have been taken into account.


Toward both positions, the NH3(3,3) and (4,4) lines are optically thick so we are not able to derive reasonable fits with the standard fitting procedures assuming constant excitation temperatures. This way we get only flat-topped synthetic spectra. Since such flat-topped spectra are not observed, this indicates that different temperatures likely exist along the line of sight. The most extreme case is the NH3(3,3) spectrum toward NGC6334I-mm1 (Fig. 4 top-left panel): In the optically thin case the peak intensities of the satellite hyperfine lines should be 3% of the peak intensity of the main line. However, in this case the satellite hyperfine lines of the NH3(3,3) transition have more or less the same intensities as the main line, indicating the large optical depth. Since we cannot fit these lines well, we use the higher excitation NH3(5,5) and (6,6) lines for the temperature estimates.
Reasonable fits are possible for these two lines, and we measure the peak intensities, the opacities of the main lines, and the line-widths (Table 1). The spectral peak intensities toward these two positions are similar, which is in contrast to the integrated images shown in Figure 3. However, the line-widths toward mm1 are more than 2 km s-1 larger than those toward mm2; this accounts for the differences in the integrated images. Because the NH3(5,5) and (6,6) lines are of different NH3 species (para-NH3 and ortho-NH3, respectively), their different statistical weights have to be taken into account. Doing this, we can derive rotational temperatures () toward the molecular peak positions associated with mm1 and mm2. The derived values are 86 K and 67 K for the two positions, respectively. Although the temperatures are comparable within the error-bars, the data are indicative that temperatures associated with mm1 may be higher than those associated with mm2.
| mm1 | mm2 | |
|---|---|---|
| Offset [′′] | -0.3/4.5 | -3.2/2.9 |
| (NH3(5,5)) [K] | 26.4 | 32.2 |
| (NH3(5,5)) [km s-1] | 5.4 | 3.3 |
| (NH3(5,5)) [km s-1] | -7.6 | -8.1 |
| (NH3(5,5))a | 0.1 | 0.4 |
| (NH3(6,6)) [K] | 15.1 | 14.3 |
| (NH3(6,6)) [km s-1] | 6.4 | 3.5 |
| (NH3(6,6)) [km s-1] | -7.5 | -8.0 |
| (NH3(6,6))a | 0.1 | 1.4 |
| b [K] | 86 | 67 |
a is prone to the largest errors, since the fits
in Fig. 4 do not accurately reproduce the satellite lines.
b The errors for are estimated by varying
within errors.
For the very optically thick lines where the previous fits failed, it is also possible to estimate approximate opacities from the observed line ratios between the main and the satellite hyperfine components. Following Ho & Townes (1983), we then calculated the rotational temperatures, , and NH3 column densities. Table 2 list the values derived via this approach. The estimated opacities of the (3,3) and (4,4) lines are all significantly larger than those we derived from the (5,5) and (6,6) lines. Interestingly, the rotational temperature for mm2 corresponds well to the rotational temperature derived from the higher excited line pair above. In contrast to that, the temperature we now derived for mm1 is higher than that derived from the higher excitation lines by a factor of about 1.6. While the estimated errors associated with the the (3,3)/(4,4) line pair are even larger than for the (5,5)/(6,6) pair, this derivation confirms the previous assessment that mm1 is likely the warmer of the two sources. The NH3 column densities derived this way would correspond to H2 column densities of the order a few times cm-2 (assuming NH3 Orion hot core abundances as listed in van Dishoeck & Blake 1998). This is about 1-2 orders of magnitude larger than the H2 column densities one can derive at comparable spatial scales from the mm continuum data (Hunter et al. 2006). This is an additional indicator of the limitations one has to face when the lines have as high opacities as in the case of NGC6334I. Future radiative transfer modeling may explain these observed spectral lines better; however, this is beyond the scope of this paper.
| mm1 | mm2 | |
|---|---|---|
| Offset [′′] | -0.3/4.5 | -3.2/2.9 |
| (NH3(3,3)) | 64 | 13 |
| (NH3(4,4)) | 28 | 20 |
| [K] | 140 | 70 |
| a [cm-2] |
a Since we cannot derive reasonable line-widths for these lines, for the column density calculations we assume and for mm1 and mm2, respectively (see Table 1).
The NH3(6,6) line-width is larger toward mm1 than the NH3(5,5) line-width. For mm2, they are approximately the same within the errorbars. It would be interesting to compare these line-widths also with those of the lower excitation lines. Since, we cannot accurately fit the whole spectra (see Fig. 4), we tried to derive the line widths via Gaussian fits to the satellite hyperfine components. However, for the same transitions, Gaussian fits of various satellite hyperfine components result in different line-widths (differences up to 1 km s-1) indicative of the high optical depth and the complex source structure that is also evident in the various hyperfine components. Therefore, a comparison of the line-widths of the lower-excitation lines is difficult. Nevertheless, toward mm1 the larger line-width of the higher excitation NH3(6,6) line compared to NH3(5,5) indicates larger internal motions of the warmer gas which is likely closer to the central source.
3.1.2 NH3(3,3) and (6,6) maser emission
Kraemer & Jackson (1995) reported NH3(3,3) maser emission toward the outflow lobes in NGC6334I. This observation is confirmed by our data (Fig. 5 & 6). The most north-eastern (3,3) maser spot is resolved and shows a morphology expected from bow-shocks in molecular outflows. A Gaussian fit to the spectrum extracted toward the bow-shocks results in a peak-brightness temperature K and a linewidth km s-1. The maser emission is identified by a combination of high brightness temperatures, narrow line-widths and peculiar spatial distributions, all with respect to the known thermal gas components. This agrees with the argument set forth by Kraemer & Jackson (1995) that the NH3(3,3) maser emission is not associated with any other maser types, but that it is likely caused by shocks when the outflow impinges on the ambient molecular gas.
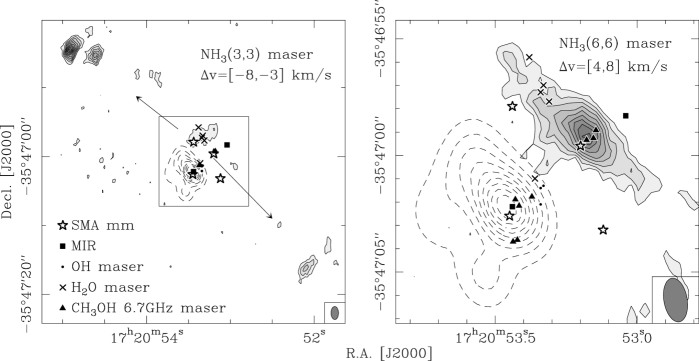
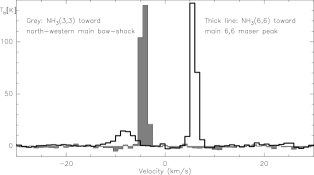
Here, we report NH3(6,6) maser emission toward NGC6334I (Figs. 4, 5 & 6). We believe that this is the first detection of NH3(6,6) maser emission. The NH3(6,6) maser is not associated with the NH3(3,3) maser emission toward the outflow lobes, but rather, the (6,6) maser emission is found at the core center and peaks coincident with the Class ii CH3OH maser group associated with mm2. The maser emission is resolved and elongated in the north-east south-western direction approximately along the large-scale outflow axis. This apparent extended structure is likely a superposition of several point-like sub-features which cannot be resolved by our observations. Weak NH3(6,6) maser emission is found in the vicinity of mm1 and associated with the H2O maser cluster. The of the (6,6) maser is +5.8 km s-1 approximately 13 km s-1 offset from the thermal emission at that position. The FWHM of the maser feature is km/s, far smaller than the line-width of the thermally excited lines reported in Table 1. The H2O maser velocities reported by (Forster & Caswell 1989) range from to km s-1 and are hence also offset from the NH3(6,6) maser velocity. Although the Class ii CH3OH maser peaks are at the same positions, their velocities (from to km s-1, Walsh et al. 1998) are also offset from the NH3(6,6) maser velocity. Unfortunately, from a theoretical point of view, the NH3(6,6) maser has not been studied yet, and we thus have no predictions of what to expect. As discussed in §4.1, the NH3(6,6) maser morphology indicates that its emission is associated with the molecular outflow. Although we do not yet understand the peculiar velocity of the (6,6) maser, this indicates that it is likely associated with some outflow-shock processes. Further theoretical and observational work is required to understand its characteristics in better detail.
3.2 NGC6334I(N)
One of the surprising results of our previous NH3(1,1), (2,2) and CH3OH (around 25 GHz) study was the absence of compact molecular line emission toward the main mm continuum peak (Beuther et al. 2005). The NH3 emission of the low excitation lines peaks approximately at the mm continuum position, but it is extremely extended without a clearly peaked morphology indicative of compact gas cores (Fig. 7 reproduces the data from Beuther et al. 2005). Therefore, one of the aims of this new study was to search for compact warm gas components associated with the mm continuum sources, the strongest of which is the mm1 source labeled in Fig. 7. The NH3(3,3) emission appears less extended than the (1,1) and (2,2) maps but it is still relatively extended and mainly south of the mm continuum peaks. It is spatially associated with neither of the two outflows but rather located between their two southern outflow lobes. Perhaps there is some kind of interaction zone between the two molecular outflows which preferentially excites the NH3(3,3) line. However, this is far from clear and we refrain from further interpretation of the NH3(3,3) morphology here. Going to the higher excitation lines, the NH3(4,4) line is the first transition that shows compact emission close to the mm continuum peaks. However, the emission peak is offset by about two arcseconds to the north-west from the main mm continuum peak, mm1. This may partially be an opacity effect because imaging the satellite hyperfine component at negative velocities – although the peak is weak on a level – it peaks toward the main mm source mm1. Only the two highest excited lines, NH3(5,5) and (6,6) clearly peak toward the strongest mm peak mm1. Both maps show a secondary peak a few arcseconds south-east associated with mm2. We do not detect any compact NH3 emission toward mm4 which is associated with a cm continuum source and a Class ii CH3OH maser (Walsh et al. 1998; Carral et al. 2002; Hunter et al. 2006).
Only the NH3(5,5) and (6,6) lines appear reasonable for a temperature estimate toward the main mm continuum and high-excitation NH3 peak, because the NH3(1,1) and (2,2) inversion lines trace only extended gas, the (3,3) line shows the strange emission south of the mm sources, and the (4,4) line peak is also offset from mm1. Figure 8 presents the NH3(5,5) and (6,6) spectra measured toward their main emission peaks toward mm1. While the NH3(5,5) line shows a relatively simple single-peaked profile, the NH3(6,6) line shows a double-peaked profile with the two emission peaks separated by approximately km s-1 from the peak-velocity derived from the NH3(5,5) profile. With a rms of the NH3(6,6) spectrum of 1.36 K, the difference between the emission peak at km s-1 and the dip at km s-1 is . It is not possible to derive a 1 component fit for this (6,6) profile which could then be used with the (5,5) spectrum to derive a temperature estimate similar to the case in NGC6334I. Therefore, we refrain from a rotational temperature estimate here, however, kinetic temperatures in excess of 100 K are needed to explain the detection of the highly excited NH3(5,5) and (6,6) lines.

4 Discussion
4.1 The outflow driving source in NGC6334I
What is the driving source of the large-scale north-east south-west outflow in NGC6334I first reported by Bachiller & Cernicharo (1990) and later confirmed by Kraemer & Jackson (1995) and Hunter et al. (2006)?
The larger line-widths observed toward mm1 compared to mm2 indicate more internal motion toward mm1 – either turbulent motion or organized motion due to infall, outflow or rotation. Furthermore, the fact that the highest excitation lines preferentially peak on the strongest mm continuum source mm1 indicates that this is the warmest source and potentially the strongest power house of the region, which would favor that source as the driving source of the outflow. However, mm line and continuum observations with the Submillimeter Array (Hunter et al. in prep.) show that mm2 has a higher line to continuum ratio and that mm1 and mm2 are equally bright in several CH3OH lines with energy levels above ground of a few 100 K. Therefore, we cannot unambiguously conclude whether mm1 is the warmer source or not. Furthermore, the NH3(6,6) maser peak is clearly associated with the mm continuum source mm2, and the position angle (PA) of the elongation of the maser (6,6) feature is 48∘ from north, comparable to the PA of the CO outflow of 46∘ (Bachiller & Cernicharo 1990). This same orientation of the (6,6) maser elongation with the large-scale molecular outflow indicates that the maser emission may be produced by shock interaction of the outflow with the ambient core gas close to the driving sources (in contrast to the NH3(3,3) maser features further outside). Therefore, we suggest that this secondary mm source, mm2, may be the driving source of the strong high-velocity molecular outflow.
4.2 Double-peaked NH3(6,6) emission in NGC6334I(N)
The double-peaked NH3(6,6) profile toward the main mm continuum peak in NGC6334I(N) is peculiar and requires further consideration. In typical infall studies, usually an optically thin and an optically thick line are observed, and if the optically thick line shows an absorption dip with a blue-red asymmetry at the velocity of the peak emission of the optically thin line, this is a first indicator of potential infall motion (e.g., Myers et al. 1996). Fitting the NH3(5,5) spectrum shown in Figure 8, the optical depth of the main hyperfine component is of order unity. Although NH3(6,6) is part of the statistically favored ortho-NH3 (its statistical weight is double that of para-NH3), and we cannot precisely determine the optical depth of this higher excitation (6,6) line from its double-peaked profile, it is unlikely to be very much larger than that of the (5,5) line. Therefore, a typical infall interpretation appears unlikely.
Another possibility to produce such a spectrum is the presence of multiple gas components at different velocities, perhaps from an embedded binary system. In this case, the NH3(6,6) line has to have exactly the right optical depth to sample specifically these two gas parcels.
Another way to get such a double-peaked profile is rotation of a central circum-protostellar disk. Such a double horn spectral profile is expected if one observed such a disk in a near-edge-on configuration where the gain path of the red-receding and blue-approaching disk components are long enough to produce enough emission at the corresponding velocities (Beckwith & Sargent 1993). The fact that we do not see such a double-peaked profile in the NH3(5,5) line may be explained by a larger optical depth of this line which hence may not trace the inner disk structure at all. Double-peaked profiles of some maser emission features were interpreted in the past sometimes in the framework of rotation in a Keplerian disk (e.g., Cesaroni 1990; Ponomarev et al. 1994). However, the emission observed in the NH3(6,6) line toward NGC6334I(N) does not appear maser-like and is likely of thermal nature.
With the current data, we cannot distinguish whether the double-peaked spectrum is produced by multiple, isolated gas parcels or by a contiguous structure like a rotating disk. Nevertheless, let us follow the disk proposal for a moment: assuming equilibrium between the centrifugal and gravitational force in an edge-on disk (inclination angle ), the radius of such a disk would be:
With a separation between the two NH3(6,6) peaks of 4 km s-1 and an approximate enclosed mass of 20 M⊙ estimated from the mm continuum data (Hunter et al. 2006), the approximate diameter of this tentative disk-like structure is 2200 AU, corresponding to an angular size of .
To discriminate between the different possibilities, higher spatial resolution observations of the NH3(6,6) line will be required to resolve and image this potential massive accretion disk in more detail. Furthermore, one can look for even higher excitation NH3 lines: In the disk scenario, one would expect line profiles similar to that observed in the (6,6) line, but with a larger velocity separation since the warmer gas would be found at smaller disk radii in a centrally heated Keplerian disk. In a multi-component scenario, different line opacities could result in the higher energy transitions sampling different gas components, which would produce different line profiles for the higher transitions.
5 Conclusions and Summary
High spatial resolution imaging of the highly excited NH3 inversion lines (3,3) to (6,6) revealed warm gas components toward both of the twin cores NGC6334I and I(N). This is particularly surprising for NGC6334I(N) because this region was always considered to be the prototypical massive cold core. While NGC6334I(N) is still in a very young evolutionary stage it has already formed at least one central massive protostar that has begun to heat up its surrounding environment. For the well-known hot core NGC6334I, the detection of the higher excitation lines is less surprising. However, the optical depths of the NH3(1,1) to (4,4) are so high in both regions that the hyperfine spectra are difficult to fit. In NGC6334I, one can use the (5,5) and (6,6) lines to estimate rotational temperatures toward the mm continuum sources mm1 and mm2 of 86 and 67 K, respectively. However, since these two inversion lines are from different NH3 species (para- and ortho-NH3), such rotational temperature estimates have to been taken cautiously. We also tried to estimate the opacities, and from that the rotational temperatures and column densities, of the NH3(3,3) and (4,4) lines using the ratios between the main and satellite components of their spectra. While these estimates qualitatively confirm the previous estimates they also show the limitations and associated errors of the NH3 analysis in regions of that high column densities and temperatures. Toward NGC6334I(N), a rotational temperature estimate is not possible because the NH3(6,6) spectrum is double-peaked and hence does not allow reasonable line fits. Therefore, we only conclude that both regions harbor dense cores with kinetic temperatures K. For better temperature estimates, one has either to observe optically thin isotopologues like 15NH3, or go to even higher excitation inversion transitions like the NH3(7,7) and NH3(8,8) lines, or try to model the spectra with more sophisticated radiative transfer methods. A different approach is to study other molecules with different abundances and energy levels above ground. Many such molecules have a rich line spectrum in the (sub)mm wavelength windows, and a complementary study with the Submillimeter Array is currently in progress (Hunter et al. in prep.).
We confirm the previous detection of the NH3(3,3) maser toward the two outflow lobes in NGC6334I. The north-eastern NH3(3,3) maser morphology even resembles the shape of typical outflow bow-shocks. Furthermore, we report the first detection of NH3(6,6) maser emission toward the central cores in NGC6334I. The main NH3(6,6) maser peak is associated with the mm peak 2 and elongated along the outflow axis. Therefore, we suggest that the strongest line and continuum source in this region, mm1, is not the driving source of the prominent molecular outflow, but rather the weaker sub-source, mm2.
While past observations revealed strong line emission on large-spatial scales toward NGC6334I(N), no previous observations detected compact gas cores at the center of the region. Observations of the highly excited NH3(4,4) to (6,6) lines for the first time detect compact warm gas emission from the central main mm peak. The observed line with the highest energy above ground, NH3(6,6), is not single-peaked toward that main mm continuum core, but it shows a double-horn profile. With the current data we cannot differentiate whether this double-horn line profile is caused by multiple gas components along the line of sight (maybe even a binary system) or whether it may be the signature of a potentially underlying massive accretion disk. Higher spatial resolution observations of the NH3(6,6) or even higher excited lines that can resolve the sub-structure of this core are required to solve this question.
Acknowledgements.
We like to thank an anonymous referee as well as the editor Malcolm Walmsley for insightful comments clarifying this paper. H.B. acknowledges financial support by the Emmy-Noether-Program of the Deutsche Forschungsgemeinschaft (DFG, grant BE2578).References
- Bachiller & Cernicharo (1990) Bachiller, R. & Cernicharo, J. 1990, A&A, 239, 276
- Beckwith & Sargent (1993) Beckwith, S. V. W. & Sargent, A. I. 1993, ApJ, 402, 280
- Beuther et al. (2005) Beuther, H., Thorwirth, S., Zhang, Q., et al. 2005, ApJ, 627, 834
- Brooks & Whiteoak (2001) Brooks, K. J. & Whiteoak, J. B. 2001, MNRAS, 320, 465
- Carral et al. (2002) Carral, P., Kurtz, S. E., Rodríguez, L. F., et al. 2002, AJ, 123, 2574
- Caswell (1997) Caswell, J. L. 1997, MNRAS, 289, 203
- Cesaroni (1990) Cesaroni, R. 1990, A&A, 233, 513
- Coudert & Roueff (2006) Coudert, L. H. & Roueff, E. 2006, A&A, 449, 855
- Davis & Eisloeffel (1995) Davis, C. J. & Eisloeffel, J. 1995, A&A, 300, 851
- De Buizer et al. (2002) De Buizer, J. M., Radomski, J. T., Piña, R. K., & Telesco, C. M. 2002, ApJ, 580, 305
- de Pree et al. (1995) de Pree, C. G., Rodriguez, L. F., Dickel, H. R., & Goss, W. M. 1995, ApJ, 447, 220
- Forster & Caswell (1989) Forster, J. R. & Caswell, J. L. 1989, A&A, 213, 339
- Gaume & Mutel (1987) Gaume, R. A. & Mutel, R. L. 1987, ApJS, 65, 193
- Gezari (1982) Gezari, D. Y. 1982, ApJ, 259, L29
- Ho & Townes (1983) Ho, P. T. P. & Townes, C. H. 1983, ARA&A, 21, 239
- Hunter et al. (2006) Hunter, T. R., Brogan, C. L., Megeath, S. T., et al. 2006, ApJ, 649, 888
- Kogan & Slysh (1998) Kogan, L. & Slysh, V. 1998, ApJ, 497, 800
- Kraemer & Jackson (1995) Kraemer, K. E. & Jackson, J. M. 1995, ApJ, 439, L9
- Leurini et al. (2006) Leurini, S., Schilke, P., Parise, B., et al. 2006, A&A, 454, L83
- Loughran et al. (1986) Loughran, L., McBreen, B., Fazio, G. G., et al. 1986, ApJ, 303, 629
- McBreen et al. (1979) McBreen, B., Fazio, G. G., Stier, M., & Wright, E. L. 1979, ApJ, 232, L183
- McCutcheon et al. (2000) McCutcheon, W. H., Sandell, G., Matthews, H. E., et al. 2000, MNRAS, 316, 152
- Megeath & Tieftrunk (1999) Megeath, S. T. & Tieftrunk, A. R. 1999, ApJ, 526, L113
- Moran & Rodríguez (1980) Moran, J. M. & Rodríguez, L. F. 1980, ApJ, 236, L159
- Myers et al. (1996) Myers, P. C., Mardones, D., Tafalla, M., Williams, J. P., & Wilner, D. J. 1996, ApJ, 465, L133
- Neckel (1978) Neckel, T. 1978, A&A, 69, 51
- Norris et al. (1993) Norris, R. P., Whiteoak, J. B., Caswell, J. L., Wieringa, M. H., & Gough, R. G. 1993, ApJ, 412, 222
- Persi et al. (1996) Persi, P., Roth, M., Tapia, M., et al. 1996, A&A, 307, 591
- Persi et al. (2005) Persi, P., Tapia, M., Roth, M., Gómez, M., & Marenzi, A. R. 2005, in IAU Symposium, ed. R. Cesaroni, M. Felli, E. Churchwell, & M. Walmsley, 291–296
- Ponomarev et al. (1994) Ponomarev, V. O., Smith, H. A., & Strelnitski, V. S. 1994, ApJ, 424, 976
- Rodríguez et al. (1982) Rodríguez, L. F., Canto, J., & Moran, J. M. 1982, ApJ, 255, 103
- Sandell (2000) Sandell, G. 2000, A&A, 358, 242
- Schilke et al. (2006) Schilke, P., Comito, C., Thorwirth, S., et al. 2006, A&A, 454, L41
- Sollins & Megeath (2004) Sollins, P. K. & Megeath, S. T. 2004, AJ, 128, 2374
- Straw & Hyland (1989) Straw, S. M. & Hyland, A. R. 1989, ApJ, 340, 318
- Tapia et al. (1996) Tapia, M., Persi, P., & Roth, M. 1996, A&A, 316, 102
- Thorwirth et al. (2003) Thorwirth, S., Winnewisser, G., Megeath, S. T., & Tieftrunk, A. R. 2003, in ASP Conf. Ser. 287: Galactic Star Formation Across the Stellar Mass Spectrum, 257–260
- van Dishoeck & Blake (1998) van Dishoeck, E. F. & Blake, G. A. 1998, ARA&A, 36, 317
- Walsh et al. (1998) Walsh, A. J., Burton, M. G., Hyland, A. R., & Robinson, G. 1998, MNRAS, 301, 640