11email: zhongmu.li@gmail.com 22institutetext: Graduate School of the Chinese Academy of Sciences
How young stellar populations affect the ages and metallicities of galaxies ††thanks: The main results are only available in electronic form at the CDS via anonymous ftp to cdsarc.u-strasbg.fr (130.79.128.5) or via http://cdsweb.u-strasbg.fr/cgi-bin/qcat?J/A+A/
Abstract
Context. Tow important stellar-population parameters (age and metallicity) of the dominant stellar populations (DSPs) of galaxies are usually estimated by comparing the observed absorption line indices or colors to predictions of some simple stellar population models. However, some studies show that there is actually recent star formation in galaxies, including early type ones. This suggests that we may not be obtaining accurate the two stellar-population parameters for the DSPs of galaxies. This is obvious when we estimate the two parameters by colors, because the youngest populations dominate the light and make the fitted stellar populations younger and richer in metal.
Aims. We plan to study how young populations (YSPs) in composite stellar populations (CSPs) affect the colors of star systems and to analyze how the stellar ages and metallicities derived from colors possibly deviate from those of the DSPs.
Methods. The techniques of stellar population synthesis and Monte Carlo process are used in this analysis.
Results. It is found that the age and mass fraction of a YSP affect colors of a mixed star system significantly, but the former is stronger. In addition, our results show that the stellar ages and metallicities derived directly from a pair of colors are about 2.14 Gyr younger, while 0.0027 more metal rich on average than those of the DSPs of composite stellar systems. Some possible distributions of the differences between stellar-population parameters determined by colors and those of DSPs of CSPs are presented. The possible distributions of the differences between colors of CSPs and those of their DSPs are also shown. Stellar ages and metallicities measured by colors and line-strength indices are compared in the work, with a sample of 18 galaxies. Furthermore, the YSPs may affect the fundamental plane and Kormendy relation of early type galaxies.
Key Words.:
galaxies: stellar content — galaxies: photometry — galaxies: elliptical and lenticular, cD1 Introduction
To study the formation and evolution of galaxies, we usually need to estimate two stellar-population parameters (age and metallicity) of the dominant stellar populations (DSPs), which contribute most to the stellar mass of galaxies. The two parameters of DSPs of galaxies without obvious star formation, e.g., early type galaxies, are usually estimated by comparing the observed values with the predictions of simple stellar populations (SSPs) (see, e.g., Worthey worthey94 (1994); Vazdekis vazdekis99 (1999); Bruzual & Charlot bruzual03 (2003) (hereafter BC03); Fioc & Rocca Volmerange fioc97 (1997) (PEGASE code); Zhang et al. zhang05 (2005)). Most of these works are accomplished by measuring absorption line indices or spectra, e.g., Kuntschner (kuntschner00 (2000)), Vazdekis et al. (vazdekis97 (1997)), Gallazzi et al. (gallazzi05 (2005)), Li et al. (li06 (2006)), Zhou et al. (zhou92 (1992)), Kong & Cheng (kong98 (1998)), and Kong et al. (kong03 (2003)). A few works have also tried to obtain similar results by measuring colors, e.g., Dorman et al. (dorman03 (2003)), Yi (yi03 (2003)), Wu et al. (wu05 (2005)), James et al. (james06 (2006)), Li et al. (li07 (2007)), Kaviraj et al. (kaviraj06 (2006)), and Lee et al. (lee06 (2006)), because colors are very useful for studying the stellar populations of distant galaxies. However, many studies show that there is recent star formation in galaxies of all types (Trager et al. trager00 (2000); Yi et al. yi05 (2005); Schawinski et al. schawinski06 (2006)), which suggests that we have not obtained accurate ages and metallicities of the DSPs of galaxies, via SSPs with instantaneous star burst (see, e.g., Serra & Trager serra07 (2007); Li et al. li07 (2007)). This is true when one uses colors to estimate the two parameters. If there are two populations in galaxies, we will usually get younger and more metal-rich stellar populations than the DSPs of galaxies. Thus it is difficult to get reliable estimates for the ages and metallicities of DSPs of galaxies from colors before we know how much the two values derived from colors are possibly different from those of their DSPs. Unfortunately, there has been no detailed study of this yet.
We intend to get some answers in this work. The main aims of the paper are to study how the parameters relating to the young population (YSP) of a composite stellar population (CSP) affect the colors of the system and to analyze the distributions of the deviations in stellar ages and metallicities determined by the colors of CSPs when comparing them to their DSPs. We also intend to study the possible distributions of the differences between colors of CSPs and their DSPs.
The structure of the paper is as follows. In Sect. 2, we briefly introduce the construction of CSPs. In Sect. 3, we analyze how the parameters of the YSP of a CSP affect the colors of the system. In Sect. 4, we study the distributions of the differences between colors of CSPs and those of their DSPs. In Sect. 5, we give some possible distributions of differences between stellar ages and metallicities estimated via colors of CSPs and those of their DSPs. Then we try to study how we can correct for the deviations in the two stellar-population parameters, which result from the existence of YSPs in galaxies. The stellar ages and metallicities estimated by different methods (the color-method and absorption-line index method, a color pair method and multi-color method) are also compared in the section. Finally, we give our discussions and conclusions in Sect. 6.
2 Construction of composite stellar populations
We construct CSPs using the SSPs of BC03, with a wide range in age (0.01 – 20 Gyr) and metallicity (0.0001 – 0.05). Each CSP is constructed of two SSPs: an old DSP and a YSP. There are five input parameters for each CSP: metallicity and age of the old DSP ( and ), metallicity and age of the YSP ( and ), and the mass fraction of the YSP in the total system (). For the convenience of comparing our results with others, we mainly use [/H]1=log(/) and [/H]2=log(/) to represent the stellar metallicities of the DSPs and YSPs in this work. The range of is from 0.5% to 50%. Note that , . In this way, we construct 1 894 200 CSPs and then calculate all their colors. The ranges of input parameters of the sample CSPs are listed in Table 1.
| parameter | values |
|---|---|
| []1 | -2.30,-1.70, -0.70, -0.40, 0.0, 0.40 |
| (Gyr) | 0.05, 0.1, 0.51, 1.02, 1.61, 2, 2.5, 3, …, 20 |
| from to 0.40 | |
| (Gyr) | from 0.01 to |
| =M2/(M1+M2) | 0.005, 0.01, 0.015, …, 0.5 |
3 Effects of the YSP parameters on colors
A young population usually makes the whole star system bluer than the DSP of the system and results in incorrect determinations of stellar age and metallicity. However, we do not know how the parameters of the YSP affect the colors of the whole system.
3.1 Effect of the age of the young population
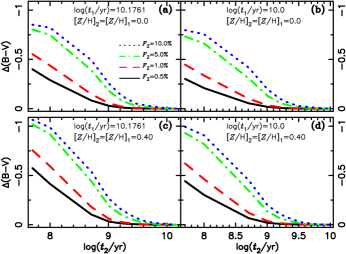
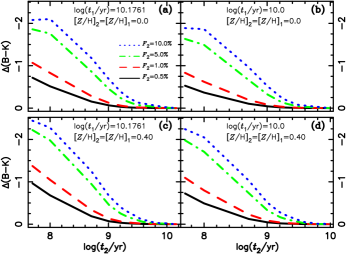
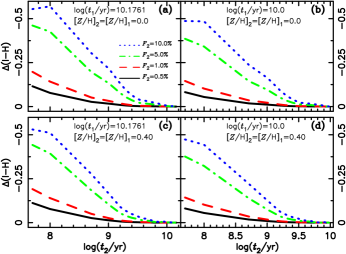
We test the effect of the age of the YSP of a CSP, , on the colors of the CSP via mixing YSPs with variable ages into the same DSP. Then we investigate how the differences between the colors of CSPs and those of the DSP change with the age of the YSP. We take the same metallicity for the YSP and DSP of a CSP here. The results for three colors that have the potential to disentangle the stellar age-metallicity degeneracy (Li et al. li07 (2007)), i.e., , , and , are plotted in Figs. 1, 2, and 3, respectively. The differences in the colors, which are represented by , , and , etc., are calculated by
| (1) |
where is the difference, while and are the colors of the CSP and DSP, respectively. We take a few CSPs with log() of 10.1761 (=15 Gyr) or 10.0 (=10 Gyr) and metallicity ([/H]1=[/H]2) of 0.0 or 0.40 in this study. Four mass fractions (0.5%, 1.0%, 5.0%, 10.0%) are chosen for the YSPs in the tests. As we see, the results for different colors are similar: The differences between colors of a composite star system and those of the DSP of the system increase rapidly with decreasing age of the YSP when the age is less than about 5 Gyr. The results for some other colors and other CSPs, which are not shown in the paper, are found to be similar to those shown here.
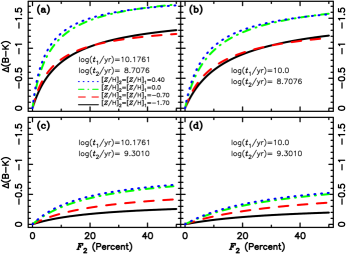
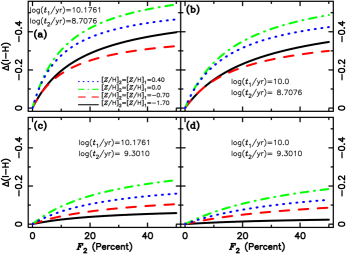
3.2 Effect of the mass fraction of the young population
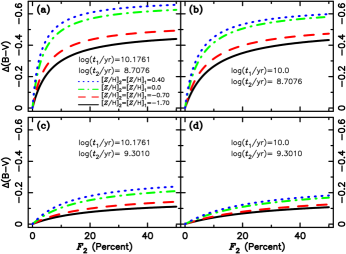
The effect of the mass fraction of the YSP, , on the colors of a CSP is studied by a method similar to what was used to study the effect of the age of the young population. There , , and are shown to increase with . We plot the results in Figs. 4, 5, and 6, respectively. We take 15 Gyr (log()=10.1761) or 10 Gyr (log()=10.0) for the ages of the DSPs and take 0.51 Gyr (log()=8.7076) or 2 Gyr (log()=9.3010) for the YSPs here. In each test, we adopt metallicities ([/H]1=[/H]2) of -1.70, -0.70, 0.0, and 0.40 for the CSPs, which are shown differently in the figures. The metallicities of the YSP and DSP of a CSP are assumed to be the same. We see that the results for three colors are similar: (1) Compared to those of DSPs, colors change quickly with increasing mass fraction of the young population, especially for mass fractions lower than 10%. (2) The rate of change in the colors does not mainly depend on the difference between and , but on the age of the YSP.
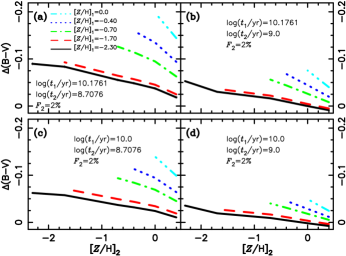
3.3 Effects of the metallicity of the young population
We also investigated the effects of the metallicity of the young population, i.e., []2, on the colors of a CSP. We use a similar method to the one above. Some parameters, i.e., , []1, , and are fixed for CSPs, while []2 are variable in each test. Note that we assume []2 []1. The results for are shown in Fig. 7. We see that []2 or does not affect the colors of star systems as clearly as and , but the effect is obvious for CSPs with metal-rich DSPs. The results for other colors are not shown here, since they are similar to those of .
4 Possible distributions of the differences between colors
The difficulty of getting accurate stellar ages and metallicities for the DSPs of galaxies via colors is that we get the colors of CSPs rather than those of DSPs. In this section, we analyze the possible distributions of differences between colors of CSPs and those of the DSPs mainly via a Monte Carlo technique.
4.1 The composite stellar population sample
We construct a set of CSPs for the study via the following steps. First, we generate the ages and metallicities ( and []1) of DSPs in our sample CSPs according to two distributions derived from Gallazzi et al. (gallazzi05 (2005)), who determined stellar ages and metallicities of 175 128 galaxies drawn from the Sloan Digital Sky Survey Data Release Two (SDSS-DR2) by comparing D4000, H, H+H, [Mg2Fe], and [MgFe]′ indices of galaxies to predictions of SSPs of the BC03. In particular, all galaxies have a ratio of signal-to-noise S/N 20 and do not have current star formation. Stellar ages used in this work are corrected for the light travel time ( = 70 km s-1 Mpc-1). This will not obviously change our result, because the colors of CSPs are more sensitive to the age of the YSP, , rather than that of the DSP, . However, the correction can increase the difference between and slightly, and, correspondingly, the difference between colors of a CSP and its DSP. This makes the difference calculated in this work closer to the actual difference between colors of galaxies and their DSPs, as galaxies possibly contain more than two SSPs. Second, the metallicity of the YSP of a CSP is taken as the same as that of the DSP. Third, the ages of YSPs are given randomly by a Monte Carlo process, with a natural assumption that the YSP of a CSP is younger than the DSP of the CSP (0 ). Fourth, the mass fraction () of YSP is calculated according to the ages of the DSP and YSP by the equation
| (2) |
which assumes that the mass fraction of the young population declines exponentially with decreasing age of the YSP, according to some studies about the star formation histories of galaxies, e.g., Bruzual (bruzual83 (1983)) and Thomas et al. (thomas05 (2005)). The variables and are the ages of the YSP and DSP of a CSP, respectively. The value of is the maximum mass fraction, while is a free parameter. For a standard case, we take 0.5 and 3.02 for and , respectively, which gives about 15% CSPs with 4%. This agrees with the result of Yi et al. (yi05 (2005)) that there are about 15% bright early type galaxies with recent ( 1 Gyr) star formation at a level more than 1% – 2% in mass compared to the total stellar mass. In this way, 30 000 CSPs with 1 Gyr are constructed. The distributions of the input parameters of these CSPs are shown in Fig. 8.

4.2 Distributions of differences between colors of CSPs and those of their DSPs
We investigate the distributions of the differences between colors of CSPs and those of their DSPs using the above sample. The results of eight colors, which are shown to be relatively sensitive to stellar age or metallicity (see Li et al. li07 (2007)), are plotted in Figs. 9 and 10. The differences are calculated by Eq. (1). We see that more CSPs exhibit bluer colors than their DSPs.


5 Possible corrections for the deviations in stellar ages and metallicities determined by colors
5.1 Distributions of these deviations
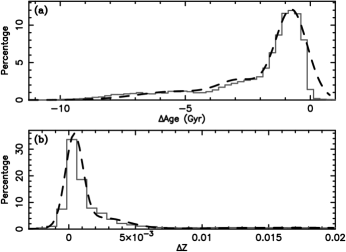
We investigate how the stellar ages and metallicities measured by colors deviate from those of the DSPs in the sample generated in Sect. 4. Because the two stellar-population parameters of galaxies are usually estimated via two colors due to the limitation of the observational data, we study the results derived from different color pairs in the work. In detail, stellar ages and metallicities are determined by [, ], [, ], and [, ], respectively, using the BC03 SSPs. The three pairs of colors (hereafter color pairs) are selected by finding the best pairs for breaking the stellar age–metallicity degeneracy (Worthey worthey94 (1994)) “by eye” via color–color grids of color pairs constructed via three metallicity-sensitive colors, , , , and three age-sensitive colors, , , and (see Li et al. li07 (2007)). Note that [, ] and [, ] are equivalent from a mathematical view, as they relate to the same three magnitudes, but they have different abilities for disentangling the well-known degeneracy. For example, it seems impossible to disentangle the above degeneracy via [, ]. The reason is that both and are relatively sensitive to metallicity, but their relative metallicity sensitivities are different (Li et al. li07 (2007)). Thus it is necessary to compare the results derived from [, ] and [, ]. Then the deviations ( and ) of the best-fitted values (age, and metallicity, ) from those of their DSPs (age, and metallicity, ) are calculated ( = - , = - ). The distributions of the deviations in stellar ages and metallicities are plotted in Fig. 11, in which the results reported by three different pairs of colors are shown, respectively. As we see, the results derived from fitting three different pairs of colors are similar. They have similar shapes and all of them peak near Age = -0.8 Gyr and Z = 0.0002, with averages -2.14 Gyr and 0.0027 in stellar age and metallicity, respectively. For the convenience of using these distributions in future works, we fit them by equations:
| (3) |
| (4) |
and the coefficients are listed in Table 2. Here P(Age) and P(Z) in the two equations are the percentages probabilities. The two equations are normalized, respectively, by
| (5) |
and
| (6) |
To see the fits of the two distributions clearly, we plot the distributions derived from fitting and colors and the distributions calculated by Eqs. (3) and (4) in Fig. 12. In practice, these distributions can possibly be used to correct for the deviations of stellar ages and metallicities determined by colors and get some reliable estimations for the two parameters.
| P0 | A1 | X1 | W1 |
| 0.0029 | 11.9650 | -0.7565 | 0.6375 |
| A2 | X2 | W2 | |
| 2.3850 | -2.7804 | 0.8500 | |
| A3 | X3 | W3 | |
| 1.1427 | -5.3102 | 1.5938 | |
| P0 | A1 | X1 | W1 |
| 0.0016 | 33.6151 | 0.0004 | 0.0007 |
| A2 | X2 | W2 | |
| 4.1408 | 0.0025 | 0.0019 | |
| A3 | X3 | W3 | |
| 0.5217 | 0.0168 | 0.0069 |

5.2 Correcting the deviations of stellar ages and metallicities
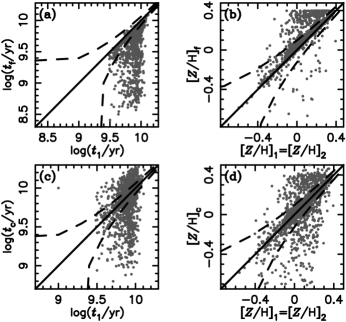
We tried to correct for the deviations in stellar ages and metallicities determined by fitting a pair of colors for a sample of 2 000 CSPs with 3 Gyr. The sample is generated by the same method as in Sect. 4 and all of their colors are calculated. We get the best-fitted stellar ages and metallicities ( and ) for CSPs by fitting their and colors. The distributions of the differences between the best-fitted parameters and those of their DSPs ( = - and = []f - []1) are then calculated, and are shown in panels (a) and (b) of Fig. 13. We see that some stellar ages and metallicities younger and richer than those of the DSPs of CSPs are determined by color pairs. This suggests that without any corrections, it would be difficult to get further reliable results based on the stellar ages and metallicities determined by color pairs.
To correct for the deviations in stellar ages and metallicities derived from colors, we tried two methods. In the first, we corrected the stellar ages and metallicities derived from colors using two maximum-likelihood values, i.e., -0.8 Gyr and 0.0002 for stellar age and metallicity, respectively. The results show that about 50% CSPs have stellar ages and metallicities close to those of the DSPs of these populations after the correction ( 1 Gyr, 0.05). In the second, we corrected stellar ages with the distribution of Age, which is shown in Fig. 12. Each corrected age was obtained by subtracting a random value that fits to the distribution shown in panel (a) of Fig.12 from the best-fitted age, . Stellar metallicities are corrected in a similar way, using the distribution shown in panel (b) of Fig.12. We call the correction “distribution correction”. For convenience, we use the distributions obtained by this work rather than ones calculated by Eqs. (3) and (4). The distribution of the differences between corrected stellar ages and those of their corresponding DSPs can be seen in the left column of Fig. 18, and Fig. 12 is useful for comparison. We see clearly that the stellar ages corrected by us distribute homogeneously around those of their DSPs. A similar correction is also used to correct the stellar metallicities and the results shown in the right column of Fig. 18. As can be seen, the metallicities of CSPs are homogeneously distributed around those of their DSPs after the correction (see Fig. 12 for comparison). Therefore, the distribution correction can help us to get stellar ages and metallicities distributed around those of the DSPs of CSPs. To see the effects of the correction more clearly, we plot the results in another way (Fig. 13). In the plot, uncorrected stellar ages, log(), uncorrected stellar metallicities, []f=log(), corrected stellar ages, log(), and corrected stellar metallicities, []c=log() of 2 000 CSPs are plotted versus those of their DSPs (log() and []1). Most stellar ages and metallicities corrected by us fit to those of their DSPs when taking possible uncertainties in stellar age (1.5 Gyr) and metallicity (0.005) into account. Therefore, the averages of stellar ages and metallicities of a sample of galaxies can be estimated in this way, as can their distributions of stellar ages and metallicities.
We apply the correction to the results of 53 elliptical galaxies, whose stellar ages and metallicities are estimated by and colors by Li et al. (li07 (2007)). The distributions of uncorrected and corrected stellar parameters are plotted in Fig. 14. After the correction, stellar populations of these galaxies, which average about 6 Gyr and 0.0375 in stellar age and metallicity, respectively, come to be older and less metal rich than the uncorrected ones. The results seem to be closer to the typical values of early type galaxies that are determined by Lick/IDS indices or spectra (see, e.g., Gallazzi et al. gallazzi05 (2005)), although these populations are somewhat younger and more metal rich.
To check the reliability of stellar ages and metallicities measured by colors, we fit the two parameters for 61 early type galaxies respectively by two line-strength indices (H and [MgFe]= , see Gonzlez gonzalez93 (1993)) and two colors ( and ), and compare the two kinds of results. Although there is a new definition of [MgFe], in which Fe5270 and Fe5335 are weighted as 0.72 and 0.28, respectively (Thomas et al. thomas03 (2003)), we take the the above definition, because we only have the data for = (Fe5270+Fe5335)/2. The Lick indices of the sample galaxies are selected from Sil’chenko (sil'chenko06 (2006)), Trager (trager00 (2000)), and Thomas et al. (thomas05 (2005)), which can also be found from Kuntschner et al. (kuntschner06 (2006)). The photometry data and redshifts of these galaxies are obtained from the NASA/IPAC Extragalactic Database (NED) and HyperLeda database (http://leda.univ-lyon1.fr/), respectively. The -band magnitudes are calculated from -band data and take the -correction and galactic extinction into account. Here, we take the methods presented by Bessell (bessell05 (2005)) & Girardi et al. (girardi03 (2003)) for transforming -band data into -band and -correcting the data. The galactic extinction is calculated using the calculator supplied by NED.
We list the stellar ages and metallicities fitted by the two methods in Table 3. Note that we only show 18 galaxies that have best-fitted stellar ages ( and ) smaller than 15 Gyr here, according to the age of the universe (see, e.g., Shafieloo et al. shafieloo06 (2006)). The results in the table were not corrected for the effects of YSPs, so that we can easily estimate the difference between the stellar-population parameters determined by colors and those by line-strength indices. We did not correct for the light travel time either, because the correction is not important for nearby galaxies. In Fig. 15, we compare the stellar parameters determined by colors and corrected via “distribution correction” with those determined by line strength indices. Note that the stellar ages and metallicities derived from colors are corrected in the whole sample of 61 galaxies. Possible uncertainties (1.5 Gyr in age and 0.005 in metallicity) are shown in Fig. 15. We see that the two kinds of results are consistent, taking uncertainties about 2.5 Gyr in age and 0.01 in metallicity.
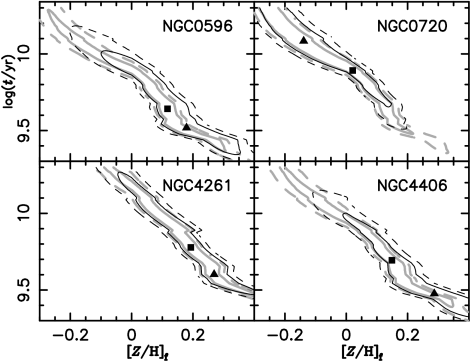
When we try to compare the stellar ages and metallicities estimated respectively by a color pair, [, ], and four independent colors, , , , and , we obtain similar results. The colors of galaxies are selected from Michard (michard05 (2005)). The best-fitted stellar ages and metallicities are found by minimizing the function
| (7) |
where is the th observed color, the color corresponding to for the th SSP, and (2 or 4) the number of colors used for fitting. In the fitting, we did not take the observational uncertainties into account, because there is no reliable data. The possible ranges of stellar ages and metallicities determined by a color pair and by four independent colors are given at 1 (68.3%) and 2 (95.4%) confidence levels. The confidence levels can be estimated via a chi-square test, taking a typical uncertainty (0.02 mag) for each color. The detailed comparison are seen in Fig. 16, in which the results of four elliptical galaxies are shown. From the figure, we see that the possible stellar ages and metallicities are grouped along the line of the well-known age–metallicity degeneracy (Worthey worthey94 (1994)), and the possible ranges determined by the two methods are similar. This can be interpreted as there being no color sensitive only to DSP or YSP among the four colors. One can refer to Li et al. (li07 (2007)), in which a principal component analysis (PCA) of colors for SSPs with various ages was shown. However, most of the best-fitted stellar ages and metallicities determined by four colors are respectively younger and more metal rich than those determined by a color pair, as we see. This suggests that the YSPs in galaxies affect the determination of DSPs of galaxies more strongly when we measure stellar ages and metallicities by fitting a few independent colors.

| Galaxy | log(tlick/yr) | [/H]lick | log(tcolor/yr) | [/H]color |
|---|---|---|---|---|
| NGC0080 | 10.0019 | 0.1072 | 9.6750 | 0.2707 |
| NGC2681 | 9.5119 | -0.4815 | 9.3900 | -0.1707 |
| NGC2950 | 9.5119 | 0.3627 | 9.4950 | 0.1917 |
| NGC3166 | 9.5119 | -0.0066 | 9.7650 | -0.0809 |
| NGC3377 | 9.5969 | 0.1553 | 9.9450 | -0.4377 |
| NGC3384 | 9.9469 | -0.0022 | 9.7600 | 0.0881 |
| NGC3941 | 10.1269 | -0.1612 | 9.7700 | 0.0374 |
| NGC4026 | 9.9769 | 0.0000 | 9.6600 | 0.1492 |
| NGC4150 | 9.7769 | -0.5302 | 9.8550 | -0.5768 |
| NGC4179 | 9.9169 | 0.1847 | 9.5500 | 0.2055 |
| NGC4350 | 9.9769 | 0.1173 | 9.6700 | 0.2455 |
| NGC4570 | 9.9519 | 0.1945 | 9.6600 | 0.2201 |
| NGC5308 | 9.9369 | 0.2822 | 9.5300 | 0.2240 |
| NGC5574 | 9.5119 | -0.0757 | 9.5500 | -0.1397 |
| NGC7013 | 9.7319 | -0.1457 | 9.4300 | -0.6289 |
| NGC7280 | 9.9269 | -0.2147 | 9.4700 | 0.1055 |
| NGC7457 | 9.6519 | -0.1457 | 9.9350 | -0.4685 |
| NGC7743 | 9.6869 | -0.1367 | 9.4750 | 0.0128 |
-
Suffixes “lick” and “color” represent the results fitted by line strength indices and those by colors, respectively.

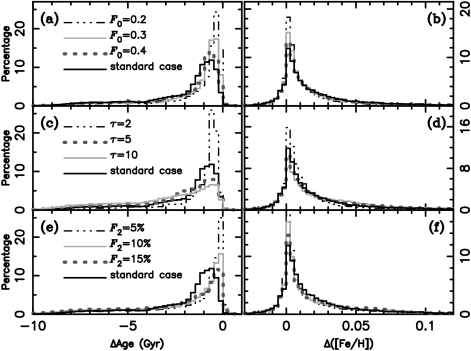
5.3 Effect of the calculation of mass fractions of young populations
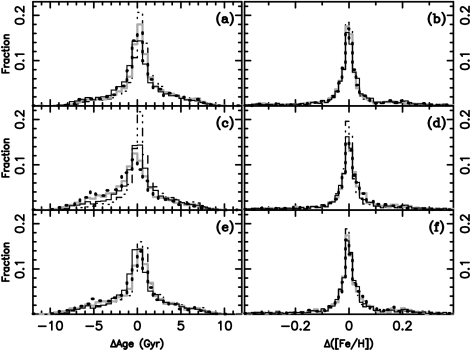
We took 0.5 and 3.02 for and , respectively, to calculate the mass fractions of YSPs of CSPs via Eq. (2) in our standard case, but different values may lead to different distributions of deviations in stellar ages and metallicities. Here we test how and change the distributions of deviations in the stelllar-population parameters estimated by two colors. Given = 3.02, we test the effects of via four values, i.e., 0.2, 0.3, 0.4, and 0.5. The distributions relating to different values of are plotted in panels (a) and (b) of Fig. 17. Similarly, given = 0.5, we test the effects of , taking 2.0, 3.02, 5.0, and 10.0. The results are shown in panels (c) and (d) of Fig. 17. In addition, we test the distributions by taking fixed values (5%, 10%, and 15%) for , which are shown in panels (e) and (f) of Fig. 17. As we see, high values of or will lead to more populations with big deviations in two stellar-population parameters. However, the distributions of deviations in the two stellar-population parameters are similar for different formulations of . We tried to correct for the deviations using the distributions obtained in the standard case, by a few samples including 2 000 CSPs generated by different formulations of . The distributions of differences between two corrected stellar-population parameters and those of the DSPs are shown in Fig. 18. In the test, samples of CSPs are generated by taking different formulations. As we see, the stellar ages and metallicities distribute around those of DSPs, after the distribution correction. Therefore, even if the star formation histories are different, the averages of the ages and metallicities of the DSPs of galaxies can be estimated from their colors, by using the the distributions obtained in the standard case to correct the results, as can the distributions of the two stellar-population parameters.
6 Conclusions and discussions
We first investigated the effects on colors of a composite stellar population (CSP) of three parameters (age, , mass fraction, , and metallicity, []2) of the young stellar population (YSP). Then we studied the potential distributions of the deviations of stellar ages and metallicities determined by color pairs, based on a set of CSPs that are rebuilt via SSPs of the BC03.
Our results show that the age () and mass fraction () of the YSP affect colors of the system significantly, while the metallicity of YSP ( or []2) affect the system’s colors more weakly. Thus if there were YSPs in galaxies and they were not too old (e.g., 5 Gyr), the colors of galaxies should be significantly different from those of their DSPs. This means that it is difficult to get the accurate ages and metallicities of the DSPs of galaxies by comparing colors of galaxies to those of SSPs directly. In addition, the effects of the age () and mass fraction () of the YSP are found to be degenerate: The smaller the age or greater mass fraction, the bigger the deviation in the colors of a CSP compared to those of the DSP of the system. But, as a whole, the effects of on the colors of star systems are stronger than those of . Our results also show that the effects of the metallicity of the YSP ( or []2) on the colors of a system are much weaker than those of and .
Furthermore, we give possible distributions for the deviations in the stellar ages and metallicities determined by color pairs in this work, which can help us to get reliable estimations of the averages and distributions of the stellar ages and metallicities of a sample of galaxies from their colors. This is possibly the most important result of this work. According to our results, the stellar ages and metallicities measured by color pairs, e.g., [, ], [, ], and [, ], are about 2.14 Gyr younger, while 0.0027 more metal rich than those of the DSPs of CSPs on average. The differences between the colors of CSPs and those of their DSPs were also studied in this work.
When we tried to study the stellar ages and metallicities determined respectively by a color pair and four independent colors, we got similar ranges for the two stellar-population parameters. The results also suggest that YSPs affect the determination of the ages and metallicities of DSPs more strongly when we estimate the two stellar-population parameters by a few independent colors rather than a color pair.
Our results can be used widely, although we took the BC03 models for the study. The reason is that various models usually predict similar colors for the same stellar population. For example, colors predicted by PEGASE models are only significantly different from those predicted by the BC03 models when the stellar age is between 0.06 and 0.32 Gyr, but colors predicted by the two models are very similar for all SSPs (Bruzual & Charlot bruzual03 (2003)).
In addition, the results can help us not only estimate the stellar ages and metallicities but also study the fundamental relations, such as the fundamental plane (FP) (Djorgovski & Davis djorgovski87 (1987)) and Kormendy relation (Kormendy kormendy77 (1977)) of elliptical galaxies and the bulges of lenticulars, which are powerful distance indicators for galaxies and important constraints on galaxy formation and evolution. According to our results, YSPs increase B luminosity, and, correspondingly, B surface brightness, compared to that of the DSPs of galaxies. In other words, YSPs affect the light of galaxies significantly. However, YSPs are unimportant for affecting the dynamic parameters of galaxies, as they only contain a small fraction of the stellar mass. Therefore, it is necessary to take the effects of the YSPs of galaxies into account when we study the fundamental relations relating to the dynamic parameters of galaxies, e.g., the relations transformed from the virial theorem. The FP of early type galaxies is just one of these kinds of relations. Using the stellar populations of 18 galaxies, which are measured from two colors ( and ) and two line strength indices (H and [MgFe]), we calculated the difference between B surface brightness of a CSP and that of its DSP. The results show that the difference between B surface brightness of a CSP and its DSP can be as large as 1 mag, with an average of 0.33 mag. Therefore, taking only the DSPs in early type galaxies into account, the FP of early type galaxies will change: A pair of effective radius ( ) and velocity dispersion () will correspond to fainter B surface brightness compared to the FP obtained before. In this case, we will measure distance moduli smaller by about 0.33 mag for galaxies than those determined via the FP obtained before. Furthermore, if we correct for the effects of YSPs, the FP obtained in various bands may change. Possibly, the differences among FPs obtained in various bands may decrease, compared to the results of Bernardi et al. (bernardi03 (2003)). The Kormendy relation (Kormendy kormendy77 (1977)) will change and affect the determination of the distances of early type galaxies with a trend similar to the FP if we take the effects of YSPs into account. A given effective radius corresponds to fainter B surface brightness and then give us a smaller distance than the previous relation. Moreover, we find that the average of the difference between B surface brightness of a CSP and that of its DSP, i.e., 0.33 mag, is close to the typical scatter of the FP and Kormendy relation of elliptical galaxies and the bulges of lenticulars (0.3–0.5 mag) (see, e.g., Falcón-Barroso et al. falcon02 (2002); Djorgovski & Davis djorgovski87 (1987); Kormendy kormendy77 (1977); Reda et al. reda05 (2005)). It implies that YSPs in early type galaxies may contribute to the scatter of the two fundamental relations. Thus the scatter in the two fundamental relations may be smaller if we take the effects of YSPs into account.
In conclusion, the results of the work can help us to get stellar ages and metallicities close to those of the DSPs of galaxies via photometry data and to understand the fundamental relations of early type galaxies better. The main results of this work are available in electronic form at the CDS.
Acknowledgements.
We gratefully acknowledge the anonymous referee for useful comments and greatly improving the presentation of the paper, Dr. Anna Gallazzi and her group for supplying us their results of some galaxies, and Dr. Richard Simon Pokorny for checking the English. We also thank the NASA/IPAC Extragalactic Database (NED) and HyperLeda database (http://leda.univ-lyon1.fr/) for supplying us with the photometry data of some galaxies. This work is supported by the Chinese National Science Foundation (Grant Nos 10433030, 10521001), and the Chinese Academy of Science (No. KJX2-SW-T06).References
- (1) Bessell, M. S. 2005, ARA&A, 43, 293
- (2) Bernardi, M., Sheth, R., Annis, J., et al. 2003, AJ, 125, 1866
- (3) Bruzual A., G. 1983, ApJ, 273, 105
- (4) Bruzual, G., Charlot, S. 2003, MNRAS, 344, 1000
- (5) Djorgovski, S., Davis, M. 1987, ApJ, 313, 59
- (6) Dorman, B., O’Connell, R. W., Rood, R. T. 2003, ApJ, 591, 878
- (7) Falcón-Barroso, J., F. Peletier, R., Balcells, M. 2002, MNRAS, 335, 741
- (8) Fioc, M., Rocca Volmerange, B. 1997, A&A, 326, 950
- (9) Gallazzi, A., Charlot, S., Brinchmann, J., et al. 2005, MNRAS, 362, 41
- (10) Girardi, M., Mardirossian, F., Marinoni, C., et al. 2003, A&A, 410, 461
- (11) Gonzlez J., 1993, Ph.D. thesis, Univ. California, Santa Cruz
- (12) James, P. A., Salaris, M., Davies, J. I., et al. 2006, MNRAS, 367, 339
- (13) Kaviraj, S., Rey, S.-C., Rich, R. M., et al. 2006, astro-ph/0601050
- (14) Kong, X., Cheng, F. 1998, ChJAA, 22, 145
- (15) Kong, X., Charlot, S., Weiss, A., Cheng, F. Z. 2003, A&A, 403, 877
- (16) Kormendy, J. 1977, ApJ, 218, 333
- (17) Kuntschner, H., Emsellem, E., Bacon, R., et al. 2006, MNRAS, 369, 497
- (18) Kuntschner, H. 2000, MNRAS, 315, 184
- (19) Lee, H., Worthey, G., Trager, S. C., et al. 2006, astro-ph/0605426
- (20) Li, Z., Han, Z., Zhang, F. 2007, A&A, 464, 853
- (21) Li, Z., Zhang, F., Han, Z. 2006, ChJAA, 6, 669
- (22) Michard, R. 2005, A&A, 441, 451
- (23) Reda, F. M., Forbes, D. A., Hau, G. K. T. 2005, MNRAS, 360, 693
- (24) Schawinski, K., Kaviraj, S., Khochfar, S., et al. 2006, ApJ, in press, astro-ph/0601029
- (25) Serra, P., Trager, S. C. 2007, MNRAS, 374, 769
- (26) Shafieloo, A., Alam, U., Sahni, V., A. Starobinsky, A. 2006, MNRAS, 366, 1081
- (27) Sil’chenko, O. K. 2006, ApJ, 641, 229
- (28) Terlevich, A. I., Forbes, D. A. 2002, MNRAS, 330, 547
- (29) Thomas, D., Maraston, C., Bender, R. 2003, MNRAS, 343, 279
- (30) Thomas, D., Maraston, C., Bender, R. 2005, ApJ, 621, 673
- (31) Trager, S. C., Faber, S. M., Worthey, G., et al. 2000, AJ, 120, 165
- (32) Vazdekis, A. 1999, ApJ, 513, 224V
- (33) Vazdekis, A., Peletier, R. F., Beckman, J. E., et al. 1997, ApJS, 111, 203
- (34) Worthey, G. 1994, ApJS, 95, 107
- (35) Wu, H., Shao, Z., Mo, H.J., et al. 2005, ApJ, 622, 244
- (36) Yi, S. K. 2003, ApJ, 582, 202
- (37) Yi, S. K., Yoon, S.-J., Kaviraj, S., et al. 2005, ApJ, 619, 111
- (38) Zhang F. H., Li L. F., Han Z. W. 2005, MNRAS, 364, 503
- (39) Zhou X., Véron-Cetty M.-P., Véron P. 1992, ACTA ASTROPHYSICA SINICA, 12, 308