A Spitzer IRS Low-Resolution Spectroscopic Search for Buried AGNs in Nearby Ultraluminous Infrared Galaxies – A Constraint on Geometry between Energy Sources and Dust –
Abstract
We present the results of Spitzer IRS low-resolution infrared 5–35 m spectroscopy of nearby ultraluminous infrared galaxies (ULIRGs) at 0.15. We focus on the search for the signatures of buried active galactic nuclei (AGNs) in the complete sample of ULIRGs classified optically as non-Seyferts (LINERs or HII-regions). In addition to polycyclic aromatic hydrocarbon (PAH) emission features at 6.2 m, 7.7 m, and 11.3 m, the conventional tool of starburst-AGN separation, we use the optical depths of the 9.7 m and 18 m silicate dust absorption features to infer the geometry of energy sources and dust at the nuclei of these ULIRGs, namely, whether the energy sources are spatially well mixed with dust (a normal starburst) or are more centrally concentrated than the dust (a buried AGN). Infrared spectra of at least 30%, and possibly 50%, of the observed optical non-Seyfert ULIRGs are naturally explained by emission consisting of (1) energetically insignificant, modestly obscured (AV 20–30 mag) PAH-emitting normal starbursts, and (2) energetically dominant, highly dust-obscured, centrally concentrated energy sources with no PAH emission. We interpret the latter component as a buried AGN. The fraction of ULIRGs showing some buried AGN signatures is higher in LINER ULIRGs than in HII-region ULIRGs. Most of the luminous buried AGN candidates are found in ULIRGs with cool far-infrared colors. Where the absorption-corrected intrinsic AGN luminosities are derivable with little uncertainty, they are found to be of the order of 1012L⊙, accounting for the bulk of the ULIRGs’ luminosities. The 5–35 m spectroscopic starburst/AGN classifications are generally consistent with our previous classifications based on 3–4 m spectra for the same sample.
1 Introduction
Galaxies which radiate very large luminosities as infrared dust emission (LIR 1012L⊙) are called ultraluminous infrared galaxies (ULIRGs; Sanders & Mirabel 1996). The huge infrared luminosities mean that: (1) very powerful energy sources, starbursts and/or active galactic nuclei (AGNs), are present hidden behind dust; (2) energetic radiation from the energy sources is absorbed by the surrounding dust; and (3) the heated dust grains re-emit this energy as infrared thermal radiation. In the local universe ( 0.3), the ULIRG population dominates the bright end of the luminosity function (Soifer et al., 1987). The importance of the ULIRG population i.e. the comoving infrared energy density, increases rapidly with increasing redshift (Le Floc’h et al., 2005). Identifying the dust obscured energy sources of nearby ULIRGs is thus very important, not only to unveil the nature of nearby ULIRGs, but also to clarify the obscured AGN-starburst connections in the high redshift ( 0.5) ULIRG population, where detailed investigations are difficult with existing facilities.
In nearby ULIRGs, it is now widely accepted that the dominant energy sources are compact (500 pc), highly dust-obscured nuclear cores, rather than extended (kpc), weakly-obscured starburst activity in the host galaxies (Soifer et al., 2000; Fischer, 2000). The most important issue is to determine whether the obscured compact cores are powered by very compact starbursts and/or AGNs, from which strong emission is produced in very compact regions around the central accreting supermassive blackholes.
If a luminous AGN is present hidden behind dust in a torus geometry, as inferred for the classical Seyfert population (e.g., Antonucci 1993), a large amount of energetic AGN radiation can escape along the direction perpendicular to the torus, and form the so-called narrow line regions (NLRs; Antonucci 1993). NLRs are the sources of strong forbidden emission lines seen in the optical–infrared, and their relative strengths are different from those of a starburst because the spectrum at the ionizing high energy UV range ( 912 ) is harder in an AGN than in a starburst. An AGN obscured by a torus-shaped dust distribution, with a well-developed NLR, is thus distinguishable from a starburst galaxy relatively easily, through optical spectroscopy (classified as Seyfert 2; Veilleux & Osterbrock 1987) or high-resolution infrared spectroscopy (Genzel et al., 1998; Armus et al., 2007).
Since the gas and dust in an AGN have angular momentum with respect to the central supermassibe blackhole, an axisymmetric spatial distribution is more natural than spherical geometry. In this case, the column densities can be high in certain directions (the torus directions), but low in others (along the torus axis). The classical Seyfert-type AGN is naturally understood as the population where most of the torus axis direction is transparent to the AGN’s ionizing UV–soft-X-ray radiation. However, compared to the classical Seyfert AGNs, ULIRGs are known to contain a substantially larger amount of gas and dust in their nuclei (Sanders & Mirabel, 1996). For a fixed angular momentum, the increased amount of gas and dust results in higher column densities in all directions. If high density gas/dust blocks the bulk of the AGN’s ionizing radiation at very small radii (10 pc) even in the torus axis direction, then no significant NLR will be present. It is very likely that any luminous AGNs in many ULIRGs exist in this buried condition, with no obvious Seyfert signatures in the optical spectra (hereafter “optical non-Seyfert”). Studying only AGNs with well-developed NLRs provides a very incomplete picture of the AGN population, and will miss many buried AGNs, whose understanding may be essential to clarify the true nature of ULIRGs.
An often-used indicator to separate a buried AGN from a normal starburst is the emission from polycyclic aromatic hydrocarbons (PAHs), seen in infrared spectra at = 3–25 m in the rest-frame (Genzel et al., 1998; Imanishi & Dudley, 2000). In a normal starburst, UV emitting HII-regions and molecular gas and dust are spatially well mixed. PAHs are excited by far-UV photons from stars, and strong PAH emission is produced in photo-dissociation regions (PDRs), the interfaces between HII-regions and molecular gas (Sellgren, 1981), unless the metallicity is very low (Houck et al., 2004b). In a normal starburst, the equivalent width of the PAH emission is insensitive to level of dust extinction, as both the PAH emission and the nearby continuum are similarly attenuated. Thus, a normal starburst should always show large equivalent width PAH emission, regardless of dust extinction. Near an AGN, the PAHs are destroyed by strong X-ray radiation from the AGN (Voit, 1992; Siebenmorgen et al., 2004). If the PAHs are sufficiently shielded by obscuration from the X-ray emission of the central AGN, the PAHs can survive. However, the PAH-exciting far UV emission from the AGN will also be attenuated by the obscuration, so in a pure AGN without starburst activity, the PAH emission will be very weak. Instead, a PAH-free continuum from hot, submicron-sized dust grains heated by the AGN is observed. In a starburst/AGN composite galaxy, PAH emission from the starburst regions is seen, but its equivalent width will be smaller than in a pure starburst, because of the dilution by PAH-free continuum produced by the AGN. Thus, this PAH-based method can be used to disentangle a buried AGN from a normal starburst at an obscured ULIRG’s core. Since the PAH emission features are spectrally very broad, low-resolution infrared spectroscopy is adequate. In addition, ULIRGs are by definition bright in the infrared, so that this infrared PAH technique can be applied to a large number of ULIRGs in a reasonable amount of telescope time, and thus can be a very effective tool to systematically identify the hidden energy sources of ULIRGs’ cores.
Using low-resolution infrared spectroscopy, we also have another powerful tool to distinguish buried AGNs from normal starbursts in the cores of ULIRGs, by investigating the geometry between energy sources and the gas and dust. In a normal starburst, the energy sources (stars) and gas/dust are spatially well mixed (Figure 1a) (Puxley, 1991; McLeod et al., 1993; Forster Schreiber et al., 2001), while in a buried AGN, the energy source (the central accreting supermassive blackhole) is very compact and is more centrally concentrated than the surrounding gas and dust (Figure 1b) (Soifer et al., 2000; Imanishi & Maloney, 2003; Siebenmorgen et al., 2004). The difference in geometry is reflected in two different ways in the observed low-resolution infrared spectra. The first is that while the absolute optical depths of dust absorption features in the 3–10 m range cannot exceed a certain threshold in a normal starburst with mixed dust/source geometry (Figure 1a), they can be arbitrarily large in a buried AGN (Figure 1b) (Imanishi & Maloney, 2003; Imanishi et al., 2006a; Levenson et al., 2007). The second is that a strong dust temperature gradient is found in a buried AGN (Figure 2), but not in a normal starburst. This dust temperature gradient can be investigated by comparing optical depths of dust absorption features at different infrared wavelengths (Dudley & Wynn-Williams, 1997; Imanishi, 2000; Imanishi et al., 2006a).
In this paper we present low-resolution 5–35 m spectra of nearby ULIRGs at 0.15, to search for the signatures of optically elusive (Maiolino et al., 2003) buried AGNs in the cores of ULIRGs and to determine the energetic contribution of buried AGNs. Throughout this paper, 75 km s-1 Mpc-1, = 0.3, and = 0.7 are adopted. The physical scale of 1′′ is 0.34 kpc in the nearest source at 0.018, 1.72 kpc at 0.1, and 2.44 kpc in the furtherest source at 0.15.
2 Targets
Our main targets are optically non-Seyfert ULIRGs at 0.15 in the IRAS 1 Jy sample (Kim & Sanders, 1998). In this 1 Jy sample, there are 69 ULIRGs at 0.15. Based on the optical classifications by Veilleux et al. (1999a; their Table 2), 28 ULIRGs are classified optically as LINERs and 20 ULIRGs are classified optically as HII regions. These 48 (=28+20) ULIRGs are selected, comprising 70% of the 1 Jy sample at 0.15. The remaining 30% ULIRGs are classified optically as Seyferts (17 sources) and optically unclassified (4 sources) (Veilleux et al., 1999a). Table 1 summarizes the basic information and IRAS-based infrared properties of the selected LINER and HII-region ULIRGs. Low-resolution infrared 5–35 m spectra for this complete sample are presented in this paper. For most sources, ancillary ground-based infrared 3–4 m spectra are available (Imanishi et al., 2006a).
3 Observations and Data Analysis
Observations of all the 48 ULIRGs were performed using the Infrared Spectrograph (IRS) (Houck et al., 2004a) onboard Spitzer Space Telescope (Werner et al., 2004). All four modules, Short-Low 2 (SL2; 5.2–7.7 m) and 1 (SL1; 7.4–14.5 m), Long-Low 2 (LL2; 14.0–21.3 m) and 1 (LL1; 19.5–38.0 m) were used, to obtain full 5–35 m low-resolution (R 100) spectra. 13 out of the 48 sources were in the GTO target list (PI. J. Houck, pid = 105), and their archival spectra were analyzed. The remaining 35 sources were observed through our GO-1 program (PI = M. Imanishi, pid = 2306) and another GO-1 program (PI = S. Veilleux, pid = 3187). The GO-1 program by Dr. Veilleux covered only SL2 and SL1. For these ULIRGs, LL2 and LL1 spectra were taken in our GO-1 program.
For our program, each observation consists of 60 sec 2 cycles for SL and 30 sec 4 cycles for LL. The observation was performed both at A and B beam positions, and so total exposure time was 240 sec for both SL and LL. For the programs by Drs. Houck and Veilleux, the total exposure times are similar or smaller for bright sources. Table 2 tabulates the observing log of the 48 ULIRGs. The slit width is 36 or 2 pixels for SL2 (18 pixel-1) and is 37 or 2 pixels for SL1 (18 pixel-1). For LL2 and LL1, the slit widths are 105 and 107, respectively, which correspond to 2 pixels for both LL2 (51 pixel-1) and LL1 (51 pixel-1).
The latest pipeline-processed data products at the time of our data analysis (S11–14, pbcd files) were used. Frames taken at the A position were subtracted from those taken at the B position, to remove background emission, mostly the zodiacal light. Then, spectra were extracted in a standard manner using the task “apall” in IRAF 111 IRAF is distributed by the National Optical Astronomy Observatories, which are operated by the Association of Universities for Research in Astronomy, Inc. (AURA), under cooperative agreement with the National Science Foundation.. Apertures with 4–6 and 4–5 pixels were employed for SL and LL data, respectively, depending on the spatial extent of individual sources. Then, spectra extracted for the A and B positions were summed. Wavelength calibration was made based on the files of the Spitzer pipeline processed data, named “b0_wavsamp.tbl” and “b2_wavsamp.tbl” for SL and LL, respectively. It is believed to be accurate within 0.1 m. A small level of possible error in wavelength calibration will not affect our main discussions. Since emission from all ULIRGs is dominated by spatially compact sources at the observed wavelength, flux calibration was performed using the Spitzer pipeline processed files “b0_fluxcon.tbl” (SL) and “b2_fluxcon.tbl” (LL). For SL1 spectra, data at 14.5 m in the observed frame are invalid (Infrared Spectrograph Data Handbook Version 1.0) and so were discarded. For LL1 spectra, we used only data at 35 m, because the scatter is large at 35 m. No defringing was attempted.
For flux-calibration, we adopted the values of the pipeline processed data. We made no attempt to re-calibrate our spectra using IRAS measurements at 12 m and 25 m, primarily because (1) only upper limits are provided for IRAS 12 m photometry in a sizable fraction (60%; 31/48) of the observed ULIRGs and for 25 m data in some fraction (20%; 10/48) of them (Table 1), and (2) the validity of re-calibrating IRS fixed-aperture slit spectra, using the large aperture photometry of IRAS, is not obvious for ULIRGs which possibly show a non-negligible fraction of spatially extended dim emission outside the IRS slit. Hence, the absolute flux calibration is dependent on the accuracy of the pipeline processed data, which is taken to be 20% for SL and LL (Infrared Spectrograph Data Handbook). This level of possible flux uncertainty will not affect our main discussions significantly. In fact, in the majority of ULIRGs with IRAS detection at 25 m, the Spitzer IRS 25 m flux agrees within 30% to the IRAS 25 m data, and the Spitzer IRS flux is generally smaller. In a small fraction of ULIRGs, Spitzer IRS 25 m flux is 50% of IRAS 25 m data, possibly because extended dim emission is important. For ULIRGs with IRAS non-detection at 25 m, the measured Spizter IRS flux at 25 m is always smaller than the upper limit of the IRAS data.
For a fraction of the ULIRGs, slight flux discrepancies between SL1 and LL2 were discernible, ranging from 10% to 40%. When the discrepancy is seen, the SL1 flux (37 wide slit) is usually smaller than the LL2 flux (105), suggesting the presence of extended emission in these ULIRGs. In these cases we adjusted the smaller SL1 (and SL2) flux to match the larger LL2 flux.
The main part of the 9.7 m silicate absorption feature extends = 8–13 m in the rest wavelength (e.g., Chiar & Tielens 2006). For ULIRGs at 0.11, the feature is not fully covered with SL1 spectra at = 7.4–14.5 m. Even for ULIRGs at 0.11, the continuum data at = 13–14 m, which are required to estimate the strength of the 9.7 m silicate absorption, fall beyond 14.5 m, outside the wavelength range of SL1. Thus, for the majority of the observed ULIRGs, LL2 spectra are essential to measure the optical depth of the 9.7 m silicate absorption feature with a small ambiguity.
Appropriate spectral binning with 2 or 4 pixels was applied to reduce the scatter of data points at SL2 (5.2–7.7 m) for some faint ULIRGs, and at 10 m for ULIRGs displaying very strong 9.7 m silicate absorption features.
4 Result
Figures 3 and 4 present low-resolution 5–35 m spectra of ULIRGs classified optically as LINERs and HII-regions, respectively. For most of the sources, full 5–35 m spectra are shown here for the first time. Although spectra of the five ULIRGs in the GTO program (Arp 220, IRAS 08572+3915, 12112+0305, 143481447, and 224911808) were presented elsewhere (Spoon et al., 2006; Armus et al., 2007), we include their spectra to comprise a complete sample, to which our detailed and uniform analysis is applied. For these ULIRGs, their and our spectra are, in overall, consistent to each other.
The spectra in Figures 3 and 4 are suitable for displaying the properties of the 9.7 m and 18 m silicate dust absorption features. However, they are not very useful for PAH emission features. Figure 5 presents zoom-in spectra at = 5.2–14.5 m of optical LINER and HII-region ULIRGs, to better examine the properties of the PAH emission features.
4.1 PAH emission
The majority of ULIRGs in Figure 5 show clearly detectable PAH emission features at = 6.2 m, 7.7 m, and 11.3 m. A fraction of the ULIRGs also display the PAH emission feature at = 8.6 m. Emission at = 12.8 m is also detected (Figures 3 and 4), but it can be attributed to both the 12.8 m PAH and [NeII] emission lines, which are not clearly resolved in our low-resolution spectra. We thus will not discuss the 12.8 m PAH emission feature further.
The 6.2 m PAH emission feature is attributed to an aromatic C-C stretching fundamental (Allamandola et al., 1989). It is relatively weak, but is isolated both from other PAH emission and from the strong 9.7 m silicate dust absorption feature. Although absorption at 6.0 m due to H2O ice and at 6.85 m by hydrogenated amorphous carbon (HAC) are present (Spoon et al., 2002), their relatively weak nature, compared to the 9.7 m silicate absorption, makes it possible to measure the 6.2 m PAH emission strength with little ambiguity. For this reason, the 6.2 m feature has often been used to measure the PAH emission strength in a ULIRG (Fischer, 2000; Spoon et al., 2007). To estimate the strength of the 6.2 m PAH emission feature, we adopt a linear continuum determined from data at = 6.1 m and 6.45 m, which is shown as solid lines in Figure 5.
The 11.3 m PAH emission is due to an out-of-plane aromatic C-H bending vibration (Allamandola et al., 1989). Since it is situated close to the peak of the strong 9.7 m silicate absorption, its flux attenuation can be severe if the PAH-emitting regions are highly dust obscured. Thus, its flux relative to other PAH features can be a good indicator of the dust obscuration of the PAH-emitting regions. To estimate the 11.3 m PAH strength, we adopt a linear continuum connecting data points at = 11.0 m and 11.6 m, which is shown as solid lines in Figure 5.
The 7.7 m PAH feature is due to aromatic C-C stretching vibrations (Allamandola et al., 1989). Although it is the strongest PAH emission feature, its substantial wavelength overlap with the broad, strong 9.7 m silicate dust absorption feature makes it very difficult to distinguish between 7.7 m PAH emission and 9.7 m silicate absorption, particularly for sources showing strong silicate absorption, such as the majority of ULIRGs. To reduce the effects of the 9.7 m absorption feature, we adopt an excess above a linear continuum determined from data at = 7.3 and 8.1 m (shown as solid lines in Figure 5) as the 7.7 m PAH emission. Since many previous papers (e.g., Genzel et al. 1998) measured the 7.7 m PAH fluxes based on different definitions, readers must be careful when our value is compared with other estimates in the literature. In this paper, although the 7.7 m PAH strength is shown for reference, it will not be used when possible uncertainty coming from the effects of the strong 9.7 m silicate feature may complicate quantitative discussions.
The 8.6 m PAH emission due to in-plane aromatic C-H bending vibration (Allamandola et al., 1989) is not used in this paper, because it is weak and overlaps with the 9.7 m silicate absorption, which make its strength highly uncertain. Other weak PAH emission features may be present (e.g., = 5.7 m; Spoon et al. 2002), but are not discussed in detail because no new meaningful information is expected to be obtained.
In summary, the 6.2 m and 11.3 m PAH emission features are the main focus of our discussion, and the strength of the 7.7 m PAH feature based on our own definition is shown just for reference. We fit the PAH emission features with Gaussian profiles, which reproduce the observed data reasonably well. The observed rest-frame equivalent widths and luminosities of the 6.2 m, 7.7 m, and 11.3 m PAH emission features, based on our adopted continuum levels, are summarized in Table 3. The uncertainties coming from the fittings are unlikely to exceed 30%, so once the continuum levels are fixed, the total uncertainties are of this order.
4.2 Silicate absorption
Based on our adopted continuum levels, the 9.7 m silicate absorption feature is found in almost all ULIRGs, and 18 m silicate absorption is also seen, particularly in ULIRGs with strong 9.7 m absorption (Figures 3 and 4). Silicate dust grains show two strong absorption peaks centered at = 9.7 m and 18.5 m. Outside these peaks, a weak absorption tail extends from = 8 m to 30 m (Chiar & Tielens, 2006) (see also Figure 6a in this paper). Thus, all wavelengths between = 8–30 m show excess absorption, compared to the extrapolation of dust extinction curve from wavelengths outside = 8–30 m. Hence, to accurately estimate the optical depths of the 9.7 m () and 18 m () silicate absorption features, a continuum level must be determined using data at 8 m and 30 m. At = 6–8 m, PAH emission can contaminate the continuum level, so that in practice data points at 5.6 m are used at the shorter wavelength side. Data points at 7.1 m are also less affected by PAH emission and absorption features (Spoon et al., 2006), and so can be used as additional continuum points. Table 4 summarizes the optical depths of the 9.7 m silicate absorption (), against power-law continuum levels determined from data points at = 5.6 m, 7.1 m, and = 34–35 m (the longest part of the IRS spectra) shown as the dashed lines in Figures 3 and 4. A power-law continuum is assumed here, because the intrinsic unabsorbed 5–35 m spectrum of AGN-heated hot dust emission is roughly approximated by a power-law form (Weedman et al., 2005).
The wavelengths of these data points used for the continuum determination are, however, far away from the 9.7 m and 18 m silicate peaks. The optical depth values of the 9.7 m and 18 m silicate absorption features can vary depending on the assumptions of the continuum data points as well as the continuum shape (power-law, linear, spline, or polynomial etc). Additionally, the power-low continua do not necessarily provide perfect fits to observed data points outside the silicate features. In the spectrum of the weakly obscured ULIRG IRAS 010042237 (Figure 4, third plot), data points at = 13–18 m are clearly above the power-law continuum (dashed line), indicating that the power-law continuum only roughly represents the overall continuum. The relative ambiguity of the value is small because the 9.7 m silicate feature is intrinsically strong. However, the optical depth of the much weaker 18 m silicate absorption feature can be highly uncertain. Consequently, discussions of the presence or absence of strong dust temperature gradients, based on the relative strength of the 9.7 m and 18 m silicate dust absorption features (Figure 2), could also be highly uncertain, if we use and as defined above.
For this reason, we define and . The value is the optical depth of the 9.7 m silicate feature against a power-law continuum determined from data points at = 7.1 m and 14.2 m. The value is the optical depth of the 18 m silicate feature against a power-law continuum determined from data points at = 14.2 m and 24 m. These continua are shown as dotted lines in Figures 3 and 4. With these new definitions, the ambiguities are reduced, because the continuum levels are determined using data points just outside the 9.7 m and 18 m features, closer to the absorption peaks. The values are shown for all ULIRGs in Table 4 (column 3). The values are also shown in Table 4 (column 4) for ULIRGs where the 18 m feature is clearly seen in absorption.
The values are appropriate to estimate the strength of the 18 m silicate feature, if the 18 m profile is similar to that observed in the ULIRG IRAS 08572+3915 (Spoon et al., 2006). However, the 18 m silicate profile of the Galactic, highly obscured star GCS3-I extends far beyond 24 m, and reaches to 29 m (Chiar & Tielens, 2006) (see also Figure 6a in this paper). Thus, we also define , which is the optical depth of the 18 m feature against a power-law continuum determined from data points at = 14.2 m and 29 m (shown as dashed-dotted lines in Figure 3 and 4). The values are also summarized in Table 4 (column 5) for ULIRGs with clearly detectable 18 m silicate absorption.
4.3 Ice absorption
A significant fraction of ULIRGs display dips at the shorter wavelength part of the 6.2 m PAH emission features. To better visualize the dips, Figure 7 presents zoom-in spectra at = 5.2–9 m for ULIRGs showing clear or possible dips. Spectra of two ULIRGs without discernible dips (IRAS 17044+6720 and 004562904) are also shown as examples of no clear detection. We ascribe the dips to the 6.0 m H2O absorption feature (bending mode), as has been found in both Galactic obscured stars (Gibb et al., 2000; Keane et al., 2001) and obscured ULIRGs (Spoon et al., 2002). Since the 6.0 m ice absorption feature is sandwiched by PAH emission features at = 5.7 and 6.2 m, it is sometimes difficult to distinguish whether the dip is due to ice absorption or to PAH emission features. For ULIRGs with clearly detectable 6.0 m H2O ice absorption features, their observed optical depths () are summarized in Table 5.
For ULIRGs showing clear ice (and HAC) absorption features, the continuum flux levels just outside of the 6.2 m PAH emission are reduced. For these ULIRGs, approximate EW6.2PAH values after these corrections are also shown in Table 3.
5 Discussion
5.1 Magnitudes of detected starbursts
PAH emission luminosities can roughly probe the absolute magnitudes of PAH-emitting normal starbursts, if the extinction of the starbursts is say less than about 20–30 mag in AV, because this amount of AV produces little flux attenuation (1 mag) at 5 m, aside from the strong 9.7 m silicate absorption feature (Rieke & Lebofsky, 1985; Lutz et al., 1996).
Table 3 (columns 9 and 10) tabulates the 6.2 m PAH to infrared luminosity ratio, L6.2PAH/LIR, and the 11.3 m PAH to infrared luminosity ratio, L11.3PAH/LIR. The ratios in normal starburst galaxies with modest dust obscuration (AV 20–30 mag) are estimated to be L6.2PAH/LIR 3.4 10-3 (Peeters et al., 2004) and L11.3PAH/LIR 1.4 10-3 (Soifer et al., 2002). Figure 8a and 8b display the PAH-to-infrared luminosity ratio (ordinate) and PAH equivalent width (abscissa) for the 6.2 m and 11.3 m PAH features, respectively. The observed L6.2PAH/LIR and L11.3PAH/LIR ratios in the majority of the observed ULIRGs are systematically lower than those seen in modestly-obscured normal starburst galaxies, suggesting that the detected starburst activity as measured by the PAH emission in ULIRGs is energetically insignificant. The dominant energy sources of ULIRGs must therefore be either (1) highly-obscured (AV 30 mag) starbursts, where the emitted PAH luminosities are substantially attenuated by dust extinction, or (2) buried AGNs, which produce intrinsically weak PAH emission.
5.2 Candidates of ULIRGs possessing powerful buried AGNs
5.2.1 Low equivalent widths of PAH emission features
Whether the dominant energy sources of ULIRGs’ cores are highly-obscured normal starbursts with mixed dust/source geometry (Figure 1a), or buried AGN with centrally-concentrated energy source geometry (Figure 1b,c), can be distinguished using the equivalent width of the PAH emission. Since the PAH equivalent width (EWPAH) must always be large in a normal starburst regardless of the amount of dust extinction, a small EWPAH value requires a contribution from a PAH-free continuum-emitting energy source (1).
Figure 9 (a), (b), and (c) compare the equivalent widths of the 6.2 m, 7.7 m, and 11.3 m PAH emission features. Positive correlations are found in all plots, suggesting that (1) variation of the relative PAH emission strength is modest, with some level of scatter, and (2) PAH-emitting starbursts usually show strong PAH features in all the emission modes at 6.2 m, 7.7 m, and 11.3 m.
Brandl et al. (2006) have investigated the 6.2 m and 11.3 m PAH emission equivalent widths, based on similar definitions of PAH strength to ours, in nearby, normal starburst galaxies without obvious Seyfert signatures in the optical (18 sources), and found that EW6.2PAH = 56173 nm (median 553 nm) and EW11.3PAH = 617187 nm (median 597 nm). The scatter is larger for the 11.3 m PAH emission feature than the 6.2 m PAH feature. No starburst galaxies show values smaller than EW6.2PAH = 459 nm and EW11.3PAH = 316 nm. Since the PAH equivalent widths are independent of the infrared luminosities of the starburst galaxies in the range LIR =109.7-11.6L⊙ (Brandl et al., 2006), we apply these values to our ULIRG sample (LIR 1012L⊙).
The median values for the 6.2 m PAH emission equivalent widths (rest-frame) are EW6.2PAH = 230 nm for the whole of our ULIRG sample (LINER + HII-region), 225 nm for LINER ULIRGs, and 300 nm for HII-region ULIRGs. The median 11.3 m PAH equivalent widths are EW11.3PAH = 390 nm (LINER + HII-region), 350 nm (LINER) and 460 nm (HII-region). The median equivalent widths of both PAH features are smaller in ULIRGs than in starburst galaxies (Brandl et al., 2006), suggesting that PAH-free continuum emission, originating in AGN-heated hot dust, contributes more strongly to the observed fluxes in ULIRGs. We assume that if a PAH equivalent width is more than a factor of 3 smaller than the median value in normal starburst galaxies, then an AGN-originating PAH-free continuum contributes importantly to the observed 5–12 m flux and dilutes the PAH emission. With this criterion, ULIRGs with EW6.2PAH 180 nm and EW11.3PAH 200 nm are classified as sources displaying clear signatures of luminous AGNs. Since these adopted values are clearly below the minimum values observed in normal starburst galaxies, we believe the criterion is reasonable and conservative to pick up luminous buried AGN candidates.
For the 7.7 m PAH equivalent widths, based on our definition of the PAH strength (4.1), the median 7.7 m PAH equivalent widths in our ULIRG sample are EW7.7PAH = 490 nm (LINER) and 695 nm (HII-region). In our ULIRG sample, the median PAH equivalent widths are smaller in LINER ULIRGs than in HII-region ULIRGs for all of the 6.2 m, 7.7 m, and 11.3 m features. We classify ULIRGs with EW7.7PAH 230 nm, one-third of the median value for HII-region ULIRGs, as those showing luminous buried AGN signatures. Since some fraction of HII-region ULIRGs may contain luminous buried AGNs, this EW7.7PAH threshold is even more conservative than those for the 6.2 m and 11.3 m PAH emission features, as determined above.
Table 6 (columns 2–4) presents detection or non-detection of buried AGN signatures based on the PAH equivalent width threshold. The fraction of ULIRGs with clearly detectable buried AGN signatures is 16/48 (33%; LINER + HII-region), 10/28 (36%; LINER) and 6/20 (30%; HII-region) based on observed EW6.2PAH, or 20/48 (42%; LINER + HII-region), 13/28 (46%; LINER) and 7/20 (35%; HII-region) based on EW6.2PAH after correction for the ice and HAC absorption feature. The fraction is 4/48 (8%; LINER + HII-region), 3/28 (11%; LINER) and 1/20 (5%; HII-region) based on observed EW7.7PAH, 12/48 (25%; LINER + HII-region), 8/28 (29%; LINER) and 4/20 (20%; HII-region) based on observed EW11.3PAH. The fraction of ULIRGs where very low PAH equivalent widths are found in any of the features is 19/48 (40%; LINER + HII-region), 13/28 (46%; LINER) and 6/20 (30%; HII-region). If the corrected EW6.2PAH values are adopted, it is 22/48 (46%; LINER + HII-region), 15/28 (54%; LINER) and 7/20 (35%; HII-region).
Since we adopted a conservative threshold, this method provides only candidate ULIRGs where PAH-free continuum emission from buried AGNs contribute very importantly to the observed IRS spectra. In starburst/buried-AGN composite ULIRGs (Figure 1c), PAH emission from starbursts surrounding the central buried AGNs is less obscured and less flux-attenuated, making the observed PAH equivalent widths relatively large, particularly when AGNs are deeply buried. Such buried AGNs should be searched for using other methods.
5.2.2 Absolute optical depths of dust absorption features
In a normal starburst with mixed dust/source geometry (Figure 1a), the foreground, less-obscured, less-attenuated emission (which shows only weak dust absorption features) dominates the observed flux, and therefore the observed optical depths of dust absorption features cannot exceed a certain threshold, unless very unusual dust composition patterns are assumed (Imanishi & Maloney, 2003; Imanishi et al., 2006a). In a buried AGN, with centrally-concentrated source geometry (Figure 1b), the so-called foreground screen dust model is applicable, and the observed optical depths can be arbitrarily large. Hence, detection of strong dust absorption features, with optical depths substantially larger than the upper limit set by the mixed dust/source geometry, argues for a foreground screen dust geometry, as expected from a buried AGN (Imanishi & Maloney, 2003; Imanishi et al., 2006a).
To differentiate the geometry using the optical depths of dust absorption features, the 9.7 m silicate dust absorption is particularly useful, because (1) it is much stronger than the 18 m silicate feature (Figure 6a), and (2) its intrinsic strength has been widely investigated in Galactic obscured objects (Roche & Aitken, 1984, 1985). Assuming the Galactic dust extinction curve, the upper limit for the optical depth of the 9.7 m silicate absorption feature in the mixed dust/source geometry can be derived. Appendix A presents detailed calculations and we obtain a maximum value of 1.7 for mixed dust/source geometry. In fact, none of the starburst galaxies (LIR 1011.6L⊙) lacking optical Seyfert signatures so far observed with Spitzer IRS (Brandl et al., 2006) show values that exceed the threshold ( 1.7). Thus, it is reasonable to assume that ULIRGs with substantially larger than 1.7 possess buried AGNs with centrally-concentrated energy source geometry.
In ULIRGs, it is possible that the dust extinction curve is very different from the Galactic one, because dust coagulation in the high density environment in ULIRGs’ cores could increase typical dust grain size up to a few microns (Laor & Draine, 1993; Maiolino et al., 2000a, b; Imanishi, 2001). However, we believe this possibility has minimal effect on our conclusions about the geometry, as long as we adopt (peak optical depth of the 9.7 m feature, relative to the nearby continuum just outside the feature; see 4.2), rather than (peak optical depth of the 9.7 m feature and continuum, relative to continuum outside 8–30 m; see 4.2). Figure 6b shows the absorption optical depth of astronomical silicate dust grains of three different sizes. The absolute absorption optical depth at the peak of the 9.7 m feature becomes stronger with increasing dust grain size. However, both the absorption optical depth inside the 9.7 m feature and the nearby continuum just outside the feature increase in a very similar way with increasing dust size, so that the strength of 9.7 m feature relative to the nearby continuum (), is virtually unchanged with varying dust grain size. The argument of the geometry based on values are therefore robust to possible increase of dust grain size in ULIRGs’ cores. We conservatively take ULIRGs with 2 as candidates for harboring luminous centrally-concentrated buried AGNs.
Individual ULIRGs with clearly detectable buried AGN signatures based on large values (2; Table 4) are marked with open circles in Table 6 (column 5). The median values are 1.8 (LINER + HII-region), 2.1 (LINER), and 1.6 (HII-region). The fraction of ULIRGs with 2, indicative of buried AGNs with centrally-concentrated energy source geometry, is 20/48 (42%; LINER + HII-region), 14/28 (50%; LINER), and 6/20 (30%; HII-region). The fraction of ULIRGs showing buried AGN signatures is again higher in LINER ULIRGs than HII-region ULIRGs, as was previously found based on the PAH-equivalent-width method ().
We must raise three cautions regarding this method. First, a value smaller than 1.7 does not necessarily preclude the presence of a luminous AGN, because a weakly obscured AGN, of course, shows a small value. The best example is IRAS 010042237 ( 0.4), which shows very low PAH emission equivalent widths, as expected from an AGN-dominated source.
Next, we used the threshold of 2, based on the observed values. For ULIRGs with detectable PAH emission from modestly obscured starbursts, the observed fluxes are a superposition of the emission from the highly obscured cores and the starburst emission (Figure 1c), and so the observed values are reduced compared to the values only toward the highly obscured energy sources at ULIRGs’ cores. Since subtraction of the modestly obscured starburst component, using a starburst template spectrum, introduces an additional uncertainty, we do not attempt it. Thus, we may miss ULIRGs which show large values (2) toward the cores but small observed values (2) due to the starburst dilution.
Finally, a starburst nucleus obscured by foreground absorbing dust (Figure 1d) can also show a value larger than the threshold determined by the mixed dust/source geometry, because in this case, a foreground screen dust model is applicable. Assuming Galactic dust properties, 2 corresponds to AV 20–40 mag (Roche & Aitken, 1984, 1985). If ULIRGs are the mergers of gas-rich spiral galaxies (Sanders et al., 1988a), gas and dust in the original galaxies can be quickly transferred to the nuclear regions (Barnes & Hernquist, 1996; Mihos & Hernquist, 1996). The bulk of possibly newborn stars and resulting dust are also expected to distribute in the nuclear regions. In fact, most of high density gas, dust, and energy sources (starbursts and/or AGNs) in ULIRGs are observed to be concentrated to nuclear cores with kpc scale (Downes & Solomon, 1998; Soifer et al., 2000; Imanishi et al., 2006b). The amount of gas/dust in ULIRGs’ hosts at kpc scale (which are morphologically disturbed) is unlikely to substantially exceed that of the original merging gas/dust-rich galaxies. In our Galaxy, a gas-rich spiral, AV value is estimated to be 30 mag in an equatorial direction (Rieke et al., 1989), and should be much smaller in other directions. It is thus not easy to produce such a large AV value (20–40 mag) with dust in a host galaxy, unless the host is viewed from a direction with particularly large dust column density. Although a small fraction of ULIRGs with 2 may have this geometry (Figure 1d), it is very unlikely that the majority do.
5.2.3 Strong dust temperature gradients
A buried AGN with centrally-concentrated energy source geometry (Figure 1b) should show a strong dust temperature gradient (Figure 2), whereas a normal starburst nucleus with mixed dust/source geometry does not, whether it is obscured by foreground dust (Figure 1d) or not (Figure 1a). The presence of a strong dust temperature gradient thus supports the buried AGN scenario, and it can be detected by comparing the optical depths of dust absorption features at different infrared wavelengths (Dudley & Wynn-Williams, 1997; Imanishi, 2000; Imanishi & Maloney, 2003; Imanishi et al., 2006a). As Figure 2 illustrates, in a buried AGN, the dust column density estimated from observations at 3 m probes deeper inside of the obscuring material as the wavelength is decreased {i.e., Av(3m) Av(10m) Av(20m)}. In this geometry, dust with a fixed temperature range from a fixed layer contributes strongly to the observed continuum emission at each wavelength, with a small contribution from other components (Figure 2). Thus, in a starburst/buried AGN composite (Figure 1c), PAH-free continuum emission from the AGN-heated dust should be detectable even if its optical depth is larger than unity at a particular observed wavelength, provided the buried AGN is intrinsically sufficiently luminous that the flux-attenuated (e-τ; 1) AGN-heated dust emission contributes significantly to the observed flux. This has been demonstrated in the 3–4 m spectra of the ULIRGs IRAS 08572+3915 and UGC 5101 ( 5; Imanishi et al. 2000; 2001; Imanishi & Maloney 2003).
On the other hand, in a normal starburst (Figure 1a), no significant dust temperature gradient is expected, and so the estimated dust extinction should be similar at different wavelengths {Av(3m) Av(10m) Av(20m)}. Since in a normal starburst, emission arises uniformly within an emitting volume, we can typically probe emission with optical depth less than about unity. If the extinction is large enough that the short wavelengths do not probe the whole emitting region, the estimated dust extinction would decrease with decreasing wavelength {Av(3m) Av(10m) Av(20m)}. Hence, the relations among Av(3m), Av(10m), and Av(20m) are totally different between a buried AGN (Figure 1b) and a normal starburst (Figure 1a).
For a buried AGN, the / or / ratio in the Spitzer IRS spectrum becomes small compared to the value in the absence of a strong dust temperature gradient. The / (/) ratio is also insensitive to possible changes in dust grain size in ULIRGs, because the relative strength of () and varies little with varying dust grain size (Figure 6b). Furthermore, since both absorption features are due to silicate dust grains, the ratio is unaffected by possibly different dust composition patterns in individual galaxies.
For ULIRGs with large contributions from modestly obscured PAH-emitting starbursts to observed spectra, the 18 m silicate dust absorption features are diluted by the PAH complex at = 16.4 m and 17.12 m, as well as H2 emission at = 17.04 m and [SIII] emission at = 18.71 m (Smith et al., 2004). Subtraction of a template spectrum of the PAH-emitting starburst introduces an additional ambiguity in the estimate of the intrinsic () value toward the ULIRG’s core. To minimize the uncertainties, we investigate the / (/) ratios only for ULIRGs where the contributions from PAH-emitting normal starbursts are small and the 18 m silicate features are clearly seen in absorption in the observed spectra. The main aim of applying this / (/) method to these ULIRGs is to further strengthen the case for buried AGN previously suggested by the large values, rather than to discover new buried AGN candidates.
To investigate the presence of a strong dust temperature gradient in a ULIRG, based on a small observed / (/) ratio, we first have to know its intrinsic ratio in the absence of a temperature gradient. Figure 6a presents the observed profiles of two Galactic obscured stars, GCS3-I and WR98a (Chiar & Tielens, 2006). They are thought to be mostly obscured by foreground interstellar medium far away from the central illuminating stars, rather than circumstellar material, so no significant temperature gradient is expected. To conservatively argue that a strong dust temperature gradient is found, based on a small observed / (/) ratio, we have adopted the profile showing the smallest intrinsic / (/) ratio as a template. The intrinsic ratio of GCS3-I is estimated to be / = 0.3 and / = 0.35. The ratios of WR98a, and other Galactic obscured stars for which silicate profiles are investigated in detail (OH-IR127.8+0.0, WR118, and WR112; Chiar & Tielens 2006), are larger than that of GCS3-I, so that adopting the observed GCS3-I profile as a template is appropriate here. If an observed / or / ratio is substantially smaller than the adopted intrinsic value (/ = 0.3 and / = 0.35), then the most reasonable explanation is the presence of a strong dust temperature gradient.
Table 4 (columns 6 and 7) summarizes the / and / ratios for ULIRGs showing clear 18 m silicate absorption (mostly 2). For a significant fraction of such ULIRGs, the observed ratios are smaller than the conservatively assumed intrinsic one, suggesting the presence of strong dust temperature gradients. This provides additional evidence for these ULIRGs for centrally-concentrated buried AGNs, previously suggested by low PAH equivalent widths and/or large values (2).
ULIRGs showing detectable signatures of strong dust temperature gradients are marked as open circles in Table 6 (column 6). The fraction of ULIRGs with detectable signatures of strong dust temperature gradients is 7/48 (15%; LINER + HII-region), 6/28 (21%; LINER), and 1/20 (5%; HII-region). The fraction of ULIRGs with detectable buried AGN signatures is again higher in LINER ULIRGs than HII-region ULIRGs.
Again, there are several caveats. First, we adopted the observed profile of GCS3-I as the template, since the / ratio in GCS3-I is the lowest among five Galactic sources so far investigated in detail. A source with an even smaller intrinsic / ratio may be discovered among Galactic sources in future observations. If ULIRGs showed intrinsically smaller / ratios than the adopted ratio from GCS3-I, then the small observed ratios in ULIRGs would not necessarily require the strong dust temperature gradients. However, for IRAS 08572+3915, a bright ULIRG with a small / ratio (Table 4), Spoon et al. (2006) independently found the signature of a strong dust temperature gradient, based on the fact that the observed optical depths of crystalline silicate dust absorption at 11 m, 16 m, 18.5 m, 23 m, and 28 m are systematically weaker at the longer wavelengths than expected (their Figure 2 bottom). A similar trend was found also in the average spectrum of ULIRGs with 2 (Spoon et al. 2006; their Figure 5). We thus believe that the small / ratios observed in several ULIRGs are most naturally explained by strong dust temperature gradients.
Next, although we investigated the / ratios only for ULIRGs with small PAH contributions from modestly obscured starbursts, these small contributions could reduce both and (5.2.2), and slightly alter the / ratios, compared to a pure spectrum of the highly obscured energy sources in the cores. However, the average spectrum of starburst galaxies shows the 30 m to 5 m (rest-frame) flux ratio to be 900 (Brandl et al., 2006), while the majority of the ULIRGs with small / show flux ratios larger than 900 (Figures 1 and 2). That is, the average starburst spectral energy distribution is bluer at = 5–30 m than those ULIRGs with small /. Assuming that the average spectrum is representative of the spectral energy distribution of the modestly obscured starbursts in these ULIRGs, this possible effect increases (not decreases) the observed / ratios, compared to an uncontaminated spectrum of the highly obscured core. Thus, the observed small / ratios in these ULIRGs are still best explained by strong dust temperature gradients around buried AGNs, with centrally concentrated energy source geometry.
Finally, of course, silicate dust grains in the cores of ULIRGs may have intrinsically larger / ratios than the conservatively assumed one. In this case, if a ULIRG shows a decreased / ratio compared to the intrinsic one, due to a dust temperature gradient, but still has an observed ratio similar to the assumed one, then such a ULIRG would not be classified as a buried AGN.
5.2.4 Comparison of the strength of silicate absorption and PAH emission features
Figure 10a compares the optical depth of the 9.7 m silicate dust absorption () and the rest-frame equivalent widths of the 6.2 m PAH emission feature (EW6.2PAH). With the exception of the two outliers with both small EW6.2PAH and small (IRAS 010042237 and 17044+6720, both weakly obscured AGNs), there is a weak anti-correlation, and ULIRGs with 2 (i.e., buried AGN candidates) tend to show small EW6.2PAH compared to starburst-like ULIRGs with small (2).
A highly-obscured (AV 30 mag) normal starburst galaxy with mixed dust/source geometry (scenario A) predicts a relatively flat distribution (i.e., relatively constant EW6.2PAH values with varying ), because the PAH equivalent width is unchanged by dust extinction (1). On the other hand, scenario B, where (1) the PAH emission comes from modestly obscured (AV 20–30 mag) starbursts exterior to the deeply obscured ULIRG cores, and (2) the large values reflect dust column density toward the buried AGNs in the cores, predicts an anti-correlation between and EW6.2PAH. As the contribution from the AGN-produced PAH-free continuum to the observed flux increases, the the EW6.2PAH value decreases. At the same time, the increasing contribution from the buried AGN emission (with centrally-concentrated energy source geometry) results in the increase of the observed value, compared to a pure starburst with mixed source/dust geometry. The trend in Figure 10a (see also Spoon et al. 2007) supports the scenario B for ULIRGs with 2.
Figure 10b compares and the rest-frame equivalent widths of the 11.3 m PAH emission feature (EW11.3PAH). Compared to Figure 10a, the decreasing trend of EW11.3PAH at 2 appears slight, at best. In scenario B, the flux depression of the AGN-produced continuum flux at = 11.3 m is particularly large due to the strong 9.7 m silicate absorption. However, the 11.3 m PAH emission flux is less affected by this absorption because the PAH emission comes from starburst regions outside the core. Consequently, the decrease of the EW11.3PAH value with increasing value is small compared to EW6.2PAH, explaining the trends in both Figures 10a and 10b.
Figure 11 compares the values with the 11.3 m to 6.2 m PAH luminosity ratio. In scenario A, the 11.3 m to 6.2 m flux ratio should decrease with increasing , as actually seen in normal starburst galaxies (Brandl et al., 2006), because the flux depression of the 11.3 m PAH emission inside the strong 9.7 m absorption is larger. On the other hand, in scenario B, no correlation is expected because both the 6.2 m and 11.3 m PAH emission come from the modestly obscured starbursts, unrelated to the observed values. Figure 11 shows no significant correlation, supporting scenario B.
5.2.5 Is the buried AGN scenario unique?
ULIRGs with large (2) and small / ratios are naturally explained by the presence of buried AGN (scenario B). We here briefly comment on two alternative scenarios which are possible but we believe are unlikely.
First, in a normal starburst with mixed dust/source geometry, if each star is deeply buried in a large amount of circumstellar dust cocoon, such as a protostar, then a strong dust absorption feature ( 2) could be produced. However, the time scale of such a protostar phase is only 106 yr (Lada, 1987), which is much less than the typical time scale of a normal starburst ( yr; Moorwood 1996) or even the maximum starburst ( yr; Elmegreen 1999), or a ULIRG time scale ( yr; Murphy et al. 1996). It is therefore very unlikely that all dust-heating stars are protostars in a significant fraction of ULIRGs. Furthermore, this scenario produces no strong dust temperature gradient, and so cannot reduce the observed / ratio.
Second, it may be argued that exceptionally centrally-concentrated starbursts remain a possibility (Figure 1e). However, while starburst galaxies with LIR =109.7-11.6L⊙ are well explained by the mixed dust/source geometry (Brandl et al. 2006; see 5.2.4 of our paper), there is no reason why starbursts at the cores of ULIRGs (LIR 1012L⊙) suddenly change their properties to exceptionally centrally-concentrated nature (Figure 1e). Furthermore, Soifer et al. (2000) studied the cores of seven nearby ULIRGs and found that the observed emission surface brightnesses in the majority (six out of seven) of these ULIRGs’ cores are very high (1013 L⊙ kpc-2). Even if the energy sources are uniformly distributed over the cores (500 pc in size), the observed surface brightnesses are close to the maximum values seen in the cores of Galactic HII regions (Soifer et al., 2000). If an exceptionally centrally-concentrated starburst were the luminosity source in the core of a ULIRG, the emission surface brightness of the starburst would have to be extremely high, 1014 L⊙ kpc-2. Among known star-forming regions, such a high surface brightness could only barely be achieved with a super star cluster, where many young stars are formed within a area of less than a few pc (Gorjian et al., 2001). The absolute luminosity of such super star clusters is, however, only of order 109-10L⊙, and so the super star cluster scenario may work for the centrally-concentrated energy sources of low luminosity (LIR 1010L⊙) galaxy nuclei (Imanishi & Nakanishi, 2006). For the centrally-concentrated energy sources at ULIRG cores, both high emission surface brightness and large absolute luminosity (1012 L⊙) are required, making the buried AGN scenario the most plausible choice (Soifer et al. 2003; their 6). In fact, known AGN populations (i.e. quasars) meet these requirements without difficulty, while for the starburst scenario, of order 100–1000 super star clusters must be concentrated in a very compact region and such a phenomenon has not been clearly confirmed from observations. We thus believe that buried AGNs are the most natural explanation for the centrally-concentrated energy sources at ULIRGs’ cores. The presence of luminous buried AGNs in many nearby ULIRGs agrees with the suggestion by Takeuchi et al. (2003) that the observed lump of the local infrared 60 m luminosity function at the highest luminosity end is due to the AGN contribution.
5.2.6 Combination of energy diagnostic methods
Table 6 (column 7) summarizes the strengths of the detected buried AGN signatures in Spitzer IRS 5–35 m spectra based on the three methods: (1) low PAH equivalent width; (2) large value; and (3) small / and / ratio. When buried AGN signatures in individual ULIRGs are consistently found using all or most of the methods, the ULIRGs are classified as very strong buried AGN candidates, marked with open double circles. When buried AGNs signatures are seen in the first method (particularly based on the observed EW6.2PAH value) and/or in the third method, then the ULIRGs are classified as strong AGN candidates (open circles). When the signatures are detected only in the second method and/or low observed EW11.3PAH or corrected EW6.2PAH values (first method), the ULIRGs are classified as possible buried AGN candidates (open triangles), because (1) a normal starburst nucleus obscured by foreground dust in the host galaxy (Figure 1d) cannot be ruled out completely and (2) the 11.3 m PAH emission strengths in normal starbursts have intrinsically larger scatter (5.2.1). The fraction of ULIRGs with strong buried AGN signatures is 16/48 (33%; LINER + HII-region), 10/28 (36%; LINER), and 6/20 (30%; HII-regions). When ULIRGs with possible buried AGN signatures are included, the fraction increases to 26/48 (54%; LINER + HII-region), 19/28 (68%; LINER), and 7/20 (35%; HII-region). Our careful look at the infrared 5–35 m spectra suggests that luminous buried AGNs reside in a much higher fraction of optical non-Seyfert ULIRGs than previous estimates (Taniguchi et al., 1999; Lutz et al., 1999).
We stress that the above fraction of luminous buried AGNs is only for ULIRGs classified optically as LINERs and HII-regions (i.e. non-Seyferts), which comprise 70% of ULIRGs. Given that 30% of ULIRGs show optical Seyfert signatures, indicative of luminous AGNs surrounded by dusty tori, and that the AGNs are estimated to be energetically dominant in these optical Seyfert ULIRGs (Veilleux et al., 1999b), the total fraction of ULIRGs possessing luminous AGNs is at least 50%, and possibly 65%, in the whole ULIRG sample at 0.15, including both optical Seyfert and non-Seyfert objects.
Finally, in all of the methods employed by us (5.2.1–5.2.3 and 5.2.6), ULIRGs classified optically as LINERs tend to display signatures of luminous buried AGN more frequently than those classified optically as HII-regions. For starburst/buried AGN composite ULIRGs (Figure 1c), it is likely that the optical LINER or HII-region classifications are largely affected by the properties of the modestly-obscured starbursts at the exteriors of the ULIRG cores, rather than buried AGN-related emission, because optical observations can probe only the surfaces of dusty objects. If shocks or superwinds are important in the modestly-obscured starbursts, the optical classification will be LINERs. If emission from HII-regions is dominant, the ULIRGs will be classed as HII-regions. In this case, it is not obvious why two phenomena, a luminous buried AGN at the center and shocks in the surface starburst, are correlated. Veilleux et al. (1995, 1999a) found that the emission probed in the optical is dustier in LINER ULIRGs than in HII-region ULIRGs. In a dusty starburst, shock-related emission can be relatively important in the optical compared to the emission from HII-regions themselves, resulting in optical LINER classification. When a luminous AGN is placed at the center of a less dusty starburst, classified optically as an HII-region, the AGN emission is more easily detectable in the optical spectrum, making such an object an optical Seyfert. On the other hand, when a luminous AGN is placed at the center of a dusty starburst classified optically as a LINER, the AGN emission is more elusive in the optical spectrum, so that such an object is classified as an optical non-Seyfert. The observed higher fraction of optically elusive buried AGN in optical LINER ULIRGs compared to HII-region ULIRGs can qualitatively be explained by this scenario.
5.2.7 Absorption-corrected luminosities of buried AGNs
For ULIRGs which show buried AGN signatures and also small PAH equivalent widths, the observed fluxes are largely ascribed to AGN-heated dust continuum emission. The resulting luminosity is conserved at each temperature (Figure 2). We can quantitatively estimate the absorption-corrected intrinsic dust luminosity heated by the AGN (whole infrared), or the absorption-corrected AGN energetic radiation luminosity (X-ray – UV – optical), based on the observed fluxes at 10 m and the dust column density toward the 10 m continuum emitting regions inferred from . Since in a buried AGN, the 10 m continuum emission regions are dominated by fixed layers (5.2.3; Figure 2), the foreground screen dust absorption model is applicable, and the dust extinction corrections are straightforward.
To do this, we assume that and the extinction at = 8 or 13 m continuum just outside the 9.7 m silicate feature (Acont) are related with /Acont 2.3 (Rieke & Lebofsky, 1985). Table 7 summarizes the absorption-corrected AGN luminosities for selected ULIRGs with both strong buried AGN signatures and low PAH equivalent widths. The flux attenuation of the 8 or 13 m continuum outside the 9.7 m silicate feature ranges from a factor of 1.2 (IRAS 010042237; 0.4) to 5 (IRAS 012980744; 4). The absorption-corrected AGN luminosities are 1–5.5 1045 ergs s-1, which are of order 1012L⊙ (= 3.8 1045 ergs s-1).
The ambiguity of the derived absorption-corrected AGN luminosities come from (1) absolute flux calibration error of the Spitzer IRS spectra and slit loss of the compact AGN emission; (2) possibly different dust extinction curves from the Galactic one that we assume; and (3) a small contribution from PAH-emitting, modestly-obscured starbursts, which decreases the values and increases the continuum flux level, compared to pure emission from the buried AGN. The first error is not significant, approximately 20% or so. The second uncertainty is more difficult to quantify, but our adoption of reduces the effects of dust grain size change (5.2.2). For the third source of uncertainty, the effect of the decreased values is more important than that of the increased continuum flux level, because the AGN-produced flux at 9.7 m is more highly attenuated. Assume for example that the modestly obscured starburst emission contributes 10% of the observed flux at = 8 and 13 m, outside the 9.7 m silicate feature. The buried AGN-produced continuum flux is then only 10% smaller than the observed flux. For ULIRGs with 2 (i.e., buried AGN candidates we are now discussing), since the attenuation of the observed flux at = 9.7 m is a factor of 7 compared to the nearby continuum, more than 50% of the continuum at = 9.7 m is produced by the starburst emission. The true, uncontaminated value toward the buried AGN is larger by a factor of 0.7 than the observed value, so that the correction factor of dust extinction for the AGN-heated dust continuum is larger by 30% (/Acont 2.3). Therefore, the small starburst contamination generally results in the underestimate of the intrinsic absorption-corrected AGN luminosity. Despite these uncertainties, the rough agreement between the absorption-corrected buried AGN luminosities and the observed infrared luminosities of these ULIRGs (1–3 1012L⊙) makes it reasonable for us to argue that the putative AGNs could quantitatively account for the bulk of the observed infrared luminosities, at least for ULIRGs with strong buried AGN signatures in Spitzer IRS spectra.
5.3 Comparison with infrared 3–4 m spectra
5.3.1 Ice absorption feature
H2O ice absorption is also present at 3.1 m (due to a stretching mode) and has been detected in 3–4 m spectra of many ULIRGs in this sample (Imanishi & Maloney, 2003; Imanishi et al., 2006a; Risaliti et al., 2006). Comparison of the 3.1 m and 6.0 m ice absorption features can provide a better understanding of the properties of ice in ULIRGs.
Column 4 of Table 5 summarizes the detection or non-detection of the 3.1 m ice feature. For the detections its optical depth is shown in column 5. Many ULIRGs have clear detections of both the 3.1 m and 6.0 m ice absorption features, reinforcing the picture that the energy sources in many ULIRGs are obscured by a large amount of ice-covered dust grains.
Figure 12 compares the optical depths of the 3.1 m () and 6.0 m () H2O ice absorption features, for ULIRGs clearly showing both features. The / ratios are several times larger than expected from laboratory data. Systematically larger / ratios compared to the laboratory prediction have previously been found in Galactic obscured stars, but the reason is unclear (Gibb et al., 2000; Keane et al., 2001). This trend may be common in astronomical obscured sources. Our poor understanding of ice absorption features hampers the search for buried AGNs with centrally-concentrated energy source geometry based on small / ratios, as was done based on the small / ratio (5.2.3).
5.3.2 PAH emission features
The 3.3 m PAH emission feature assigned to the aromatic CH stretch (Allamandola et al., 1989) was detected in the majority of this ULIRG sample (Imanishi et al., 2006a). Figure 9 (d), (e) and (f) compare the rest-frame equivalent widths of the 3.3 m PAH feature (EW3.3PAH) with those of the 6.2 m, 7.7 m, and 11.3 m PAH features.
In Figure 9, the scatter is generally large in plots comparing PAH features at widely separated wavelengths. Contribution from PAH-free AGN continuum to an observed flux can vary to a larger degree with increasing wavelength separation, explaining the trend in Figure 9.
5.3.3 Support for the strong dust temperature gradient
In a buried AGN with a strong dust temperature gradient, dust extinction toward the 3–4 m continuum emission regions, estimated using 3–4 m data, AV(3m), should be larger than that toward 10 m continuum emission region estimated from the value (Figure 2). For ULIRGs with small contamination from PAH-emitting starbursts to their 3–4 m spectra (small EW3.3PAH values), AV(3m) can be estimated with little ambiguity, from absorption optical depths at 3.4 m () by bare carbonaceous dust and at 3.1 m () by ice-covered dust deep inside molecular clouds.
IRAS 08572+3915, 121271412, 17044+6720 show 3–4 m spectra with very small PAH contaminations. The values are 0.8, 0.35, and 0.15 for IRAS 08572+3915, 121271412, 17044+6720, respectively (Imanishi et al., 2006a). The value reflects the column density of bare carbonaceous dust (without an ice mantle) (Pendleton et al., 1994; Imanishi et al., 1996; Rawlings et al., 2003). In the Galaxy, the / ratio is surprisingly similar in different directions (/ = 14–17; Roche & Aitken 1984, 1985; Pendleton et al. 1994). Thus, a / ratio substantially smaller than 14–17 can be a signature of a strong dust temperature gradient. Adopting the values shown in Table 4, we obtain / = 5, 7, and 12 for IRAS 08572+3915, 121271412, 17044+6720, respectively. These three ULIRGs have previously been classified as very strong buried AGN candidates, based on Spitzer IRS 5–35 m spectra (5.2.6). The small / ratios support the buried AGN hypothesis.
For IRAS 08572+3915 and 17044+6720, no 3.1 m absorption by ice-covered dust is detected (Imanishi et al., 2006a), suggesting that most of the dust toward the 3–4 m continuum emission sources is bare, without an ice mantle. However, for IRAS 121271412, the 3.1 m absorption feature is found with 0.4, suggesting a large amount of ice-covered dust, in addition to bare dust grains. Since the 9.7 m absorption is seen whether the silicate dust is bare or ice-covered, adding the column density of ice-covered dust to that of bare carbonaceous dust grains, will raise AV(3m) even further, strengthening the argument for a strong dust temperature gradient in IRAS 121271412.
5.3.4 Classification – AGN or starburst?
Table 6 (column 8) summarizes the detection or non-detection, and the detection significance in the case of detection, of buried AGN signatures based on ground-based 3–4 m spectra (Imanishi et al., 2006a). The trend of buried AGN detection is generally consistent in individual ULIRGs, in that (1) very strong buried AGN candidates at 3–4 m are also very strong buried AGN candidates in Spitzer IRS 5–35 m spectra, and (2) ULIRGs with no AGN signatures at 3–4 m usually show no AGN signatures at 5–35 m. There are some ULIRGs which have detectable AGN signatures at 5–35 m, but not at 3–4 m, which are explained by a larger contamination from modestly obscured starburst emission at a shorter wavelength (Imanishi et al., 2004; Imanishi, 2006).
Finally, Imanishi et al. (2006a) have previously argued, based on 3–4 m spectra, that the fraction of ULIRGs showing luminous buried AGN signatures is higher in LINER ULIRGs than HII-region ULIRGs in this sample. This trend is exactly what we have seen in the Spitzer IRS 5–35 m spectra discussed here (5.2.1–5.2.6).
5.4 Buried AGNs and infrared colors
Figure 13 compares the strength of the 9.7 m silicate absorption feature () and infrared colors, Spitzer IRS 5.4 m to 35 m flux ratio (Figure 13a) and IRAS 25 m to 60 m flux ratio (Figure 13b). The infrared colors are independent of values, with no clear positive or negative correlation found.
The IRAS 25 m to 60 m flux ratio is often used to determine whether ULIRGs show cool (f25/f60 0.2) or warm ( 0.2) far-infrared colors (Sanders et al., 1988b). Although many classical Seyfert-type AGNs surrounded by dusty tori show warm far-infrared colors (de Grijp et al., 1987), the bulk of ULIRGs possessing luminous buried AGN candidates ( 2) belong to cool sources (Figure 13b). As already argued by Imanishi et al. (2006a), it is quite reasonable that buried AGNs tend to show cooler infrared colors than optical Seyfert AGNs. A larger amount of dust around a central AGN in a buried AGN compared to a Seyfert AGN surrounded by a torus (1) can naturally produce a cooler infrared color, because the contribution from an outer, cooler component becomes important, and makes the optical Seyfert signatures fainter or even vanish, because even the torus axis direction can be opaque to the bulk of the AGN’s ionizing radiation.
5.5 Future prospects
Although infrared spectroscopic energy diagnostics enable us to discuss the overall properties of ULIRGs statistically, follow-up observations of infrared-selected buried AGN candidates are very important to cross-check the reliability of these methods. For example, we argue an exceptionally centrally-concentrated extreme starburst is unlikely, based on the emission surface brightness and absolute luminosity (5.2.5). X-ray observations can be particularly powerful in distinguishing a buried AGN from an extreme starburst, because a luminous AGN is a much stronger X-ray emitter than any kind of starburst. Since the column densities in the cores of ULIRGs can be large enough to be Compton thick (X-ray absorption NH 1024 cm-2), high sensitivity X-ray observations at E 10 keV are particularly desirable.
In a strongly X-ray emitting buried AGN surrounded by dense gas and dust, X-ray dissociation regions (XDRs; Maloney et al. 1996) should develop, rather than the photo-dissociation regions (PDRs) usually seen in a starburst (a strong UV emitter). Finding XDR signatures can thus be another powerful way to test the buried AGN scenario. Imanishi et al. (2004, 2006b) found that several infrared-selected buried AGN candidates tend to show millimeter molecular line flux ratios expected from XDRs. For one of the strongest infrared-selected buried AGN candidates, IRAS 08572+3915, Shirahata et al. (2007) detected CO (v=1–0) absorption features up to J = 17 in ground-based infrared 4.5–5 m observations. It is argued that such high-J lines can be explained only by XDRs (Spaans, 2006), further supporting the buried AGN scenario. A further search for XDR signatures in ULIRGs may reinforce the buried AGN picture suggested from the infrared spectroscopy.
6 Summary
We presented Spitzer IRS 5–35 m low-resolution (R 100) spectra of ULIRGs at 0.15 in the IRAS 1 Jy sample. ULIRGs classified optically as non-Seyferts (LINERs and HII-regions), which comprise 70% of the 1 Jy sample at 0.15, were our prime targets to search for signatures of optically undetected AGNs deeply buried in dust along virtually all lines-of-sight, without well-developed narrow line regions. In total, 28 LINER and 20 HII-region ULIRGs (a complete sample) were observed. Three methods were mainly utilized: (1) the equivalent widths of the PAH emission features at 6.2 m, 7.7 m, and 11.3 m, (2) the absolute optical depth of the 9.7 m silicate dust absorption feature, and (3) the 9.7 m to 18 m silicate dust absorption optical depth ratio. The first method traces the hardness of the radiation field (starburst-like soft or AGN-like hard). The latter two methods probe the geometry, i.e. whether the dust and energy sources are spatially well mixed (a normal starburst) or the energy source is more centrally concentrated than dust (a buried AGN). We found the following main conclusions.
-
1.
For the majority of ULIRGs, PAH emission features were detected, suggesting the presence of PAH-emitting normal starburst activity. However, the observed PAH to infrared luminosity ratios were systematically smaller than in modestly obscured (AV 20–30 mag) starburst galaxies. Taken at face value, the PAH-emitting starbursts with modest dust obscuration are energetically insignificant in ULIRGs. The dominant energy sources are (1) very highly obscured (AV 30 mag) PAH-emitting starbursts with mixed dust/source geometry, whose PAH flux is attenuated, and/or (2) non-PAH-emitting AGNs.
-
2.
In 19 out of the 48 (40%) ULIRGs we studied, the observed PAH equivalent widths were found to be substantially lower than normal starburst galaxies at either of the 6.2 m, 7.7 m, or 11.3 m PAH features. This fraction increased to 22/48 (46%) if we adopted the 6.2 m PAH equivalent widths after correction for the ice and HAC absorption features. The highly obscured energy sources of these ULIRGs’ cores were argued to be dominated by non-PAH-emitting AGNs, rather than highly-obscured PAH-emitting starbursts.
-
3.
In 20/48 (42%) of ULIRGs, the observed optical depths of the 9.7 m silicate dust absorption feature () were substantially larger than the upper limit determined by mixed dust/source geometry in normal starbursts. A non-PAH-emitting buried AGN with centrally-concentrated energy source geometry is the most natural explanation for the energy sources at the cores of these ULIRGs. Comparisons of the value with the PAH equivalent widths, and with the 11.3 m to 6.2 m PAH luminosity ratio, supported the buried AGN scenario in these ULIRGs.
-
4.
For selected ULIRGs with small PAH contamination (mostly ULIRGs with large ), the 18 m to 9.7 m silicate absorption optical depth ratios were often significantly smaller than the intrinsic ratio. A strong dust temperature gradient around a centrally-concentrated energy source geometry was strongly suggested, further supporting the buried AGN scenario.
-
5.
16/48 (33%) of optical non-Seyfert ULIRGs showed strong signatures of luminous buried AGNs, and 26/48 (54%) ULIRGs displayed some signatures. Given that 30% of ULIRGs showed optical Seyfert signatures and were known to possess luminous AGNs surrounded by dusty tori, it was suggested that luminous AGNs are present in at least 50%, and possibly 65%, of the complete ULIRG sample at 0.15.
-
6.
The fraction of ULIRGs showing luminous buried AGN signatures was always higher in optical LINER ULIRGs than HII-region ULIRGs using any of the above methods. This was qualitatively explained by the scenario that the starburst regions probed in the optical are dustier in LINER ULIRGs than in HII-region ULIRGs.
-
7.
For ULIRGs with strong buried AGN signatures and small PAH contamination, the absorption-corrected intrinsic luminosities of the buried AGNs were found to be quantitatively comparable to 1012L⊙, accounting for the bulk of the observed infrared luminosities of ULIRGs.
-
8.
Most of the luminous buried AGN candidates were found in ULIRGs with cool far-infrared colors.
-
9.
The above conclusions drawn from the Spitzer IRS 5–35 m spectra were generally consistent with those based on 3–4 m spectra obtained by Imanishi et al. (2006a). Our main conclusions were that optically undetected luminous buried AGNs are surely present in a significant fraction of non-Seyfert ULIRGs. It is therefore very important to carefully and quantitatively investigate the energetic roles of optically elusive luminous buried AGNs, if we are to understand the true nature of the nearby ULIRG population.
Appendix A The maximum value in a mixed dust/source geometry
Figure 1a shows a schematic diagram of a typical mixed dust/source geometry. In this geometry, the observed flux I() is given by
| (A1) |
where () is an unattenuated intrinsic flux and is the optical depth at each wavelength, which takes different values inside absorption features and nearby continua outside the features.
We here consider radiation with an intrinsically smooth spectral energy distribution, namely I0(8 m) I0(9.7 m) I0(13 m), such as expected for dust emission in ULIRGs. The peak absorption optical depth of the 9.7 m silicate feature, relative to the nearby continuum at 8 m and 13 m (which corresponds to and not in our definition in 4.2), is
| (A2) | |||||
| (A3) |
where and refer to the optical depths at the peak of the 9.7 m silicate absorption feature and nearby continuum at 8 m and 13 m just outside the feature, respectively. The value is always larger than the value, because is the superposition of the optical depth for continuum emission and the 9.7 m silicate feature.
In the case of the Galactic dust extinction curve derived by Rieke & Lebofsky (1985),
| (A4) | |||||
| (A5) |
where, by definition, .
The absorption strength of the 9.7 m silicate feature, relative to AV, is different by a factor of 2 in different directions in the Galaxy (Roche & Aitken, 1984, 1985). If we take this into account,
| (A6) | |||||
| (A7) |
The and values can be arbitrarily large with increasing amount of dust () in the mixed dust/source geometry. The value is an increasing function of AV, and the first term in the equation A3 () becomes unity for a very large AV value. Thus, the upper limit to is
| (A8) |
We obtain a stringent upper limit of 1.7 in this mixed dust/source geometry for any amount of dust.
The /AV and /AV ratios can vary substantially with varying dust grain size, because the wavelength difference between the optical V-band and infrared 10 m is large. However, the upper limit of in the mixed dust/source geometry is dependent only on /, which should be less sensitive to varying dust grain size (see Figure 6b), because their wavelengths are very close. Therefore, the above conclusion about the upper limit of in the mixed dust/source geometry should be robust to possible differences in dust grain size between the cores of ULIRGs and the Galactic diffuse interstellar medium.
References
- Allamandola et al. (1989) Allamandola, L. J., Tielens, A. G. G. M., & Barker, J. R. 1989, ApJS, 71, 733
- Antonucci (1993) Antonucci, R. 1993, ARA&A, 31, 473
- Armus et al. (2007) Armus, L., et al. 2007, ApJ, 656, 148
- Barnes & Hernquist (1996) Barnes, J. E., & Hernquist, L. 1996, ApJ, 471, 115
- Brandl et al. (2006) Brandl, B. R., et al. 2006, ApJ, 653, 1129
- Chiar & Tielens (2006) Chiar, J. E., & Tielens, A. G. G. M. 2006, ApJ, 637, 774
- de Grijp et al. (1987) de Grijp, M. H. K., Miley, G. K., & Lub, J. 1987, A&AS, 70, 95
- Downes & Solomon (1998) Downes, D., & Solomon, P. M. 1998, ApJ, 507, 615
- Draine & Lee (1984) Draine, B. T., & Lee, H. M. 1984, ApJ, 285, 89
- Dudley & Wynn-Williams (1997) Dudley, C. C., & Wynn-Williams, C. G. 1997, ApJ, 488, 720
- Elmegreen (1999) Elmegreen, B. G. 1999, ApJ, 517, 103
- Fischer (2000) Fischer, J. 2000, in ISO Beyond the Peaks, ed. A. Salama, M. F. Kessler, K. Leech, & B. Schulz (ESA SP-456; Noordwijk: ESA), 239 (astro-ph/0009395)
- Forster Schreiber et al. (2001) Forster Schreiber, N. M., Genzel, R., Lutz, D., Kunze, D., & Sternberg, A. 2001, ApJ, 552, 544
- Genzel et al. (1998) Genzel, R. et al. 1998, ApJ, 498, 579
- Gibb et al. (2000) Gibb, E. L. et al. 2000, ApJ, 536, 347
- Gorjian et al. (2001) Gorjian, V., Turner, J. L., & Beck, S. C. 2001, ApJ, 554, L29
- Houck et al. (2004a) Houck, J. R., et al. 2004a, ApJS, 154, 18
- Houck et al. (2004b) Houck, J. R., et al. 2004b, ApJS, 154, 211
- Imanishi (2000) Imanishi, M. 2000, MNRAS, 319, 331
- Imanishi (2001) Imanishi, M. 2001, AJ, 121, 1927
- Imanishi (2006) Imanishi, M. 2006, AJ, 131, 2406
- Imanishi & Dudley (2000) Imanishi, M., & Dudley, C. C. 2000, ApJ, 545, 701
- Imanishi & Maloney (2003) Imanishi, M., & Maloney, P. R. 2003, ApJ, 588, 165
- Imanishi & Nakanishi (2006) Imanishi, M., & Nakanishi, K. 2006, PASJ, 58, 813
- Imanishi et al. (2001) Imanishi, M., Dudley, C. C., & Maloney, P. R. 2001, ApJ, 558, L93
- Imanishi et al. (2006a) Imanishi, M., Dudley, C. C., & Maloney, P. R. 2006a, ApJ, 637, 114
- Imanishi et al. (2006b) Imanishi, M., Nakanishi, K., & Kohno, K. 2006b, AJ, 131, 2888
- Imanishi et al. (2004) Imanishi, M., Nakanishi, K., Kuno, N., & Kohno, K. 2004, AJ, 128, 2037
- Imanishi et al. (1996) Imanishi, M., Sasaki, Y., Goto, M., Kobayashi, N., Nagata, T., & Jones, T. J. 1996, AJ, 112, 235
- Keane et al. (2001) Keane, J. V., Tielens, A. G. G. M., Boogert, A. C. A., Schutte, W. A., & Whittet, D. C. B. 2001, A&A, 376, 254
- Kim & Sanders (1998) Kim, D. -C., & Sanders, D. B., 1998, ApJS, 119, 41
- Kim et al. (2002) Kim, D. -C., Veilleux, S., & Sanders, D. B., 2002, ApJS, 143, 277
- Lada (1987) Lada, C. J. 1987, in IAU Symp. 115, Star-Forming Regions, ed. M. Peimbert & J. Jugaku (Dordrecht: Reidel), 1
- Laor & Draine (1993) Laor, A., & Draine, B. T. 1993, ApJ, 402, 441
- Le Floc’h et al. (2005) Le Floc’h et al. 2005, ApJ, 632, 169
- Levenson et al. (2007) Levenson, N. A., Sirocky, M. M., Hao, L., Spoon, H. W. W., Marshall, J. A., Elitzur, M., & Houck, J. R., 2007, ApJ, 654, L45
- Lutz et al. (1996) Lutz, D. et al. 1996, A&A, 315, L269
- Lutz et al. (1999) Lutz, D., Veilleux, S., & Genzel, R. 1999, ApJ, 517, L13
- Maiolino et al. (2000a) Maiolino, R., Marconi, A., & Oliva, E. 2001b, A&A, 365, 37
- Maiolino et al. (2000b) Maiolino, R., Marconi, A., Salvati, M., Risaliti, G., Severgnini, P., Oliva, E., La Franca, F., & Vanzi, L. 2001a, A&A, 365, 28
- Maiolino et al. (2003) Maiolino, R. et al. 2003, MNRAS, 344, L59
- Maloney, Hollenbach, & Tielens (1996) Maloney, P., Hollenbach, D., & Tielens, A. G. G. M. 1996, ApJ, 466, 561
- McLeod et al. (1993) McLeod, K. K., Rieke, G. H., Rieke, M. J., & Kelly, D. M. 1993, ApJ, 412, 111
- Mihos & Hernquist (1996) Mihos, J. C., & Hernquist, L. 1996, ApJ, 464, 641
- Moorwood (1996) Moorwood, A. F. M. 1996, Space Sci. Rev., 77, 303
- Murphy et al. (1996) Murphy, Jr, T. W., Armus, L., Matthews, K., Soifer, B. T., Mazzarella, J. M., Shupe, D. L., Strauss, M. A., & Neugebauer, G. 1996, AJ, 111, 1025
- Peeters et al. (2004) Peeters, E., Spoon, H. W. W., & Tielens, A. G. G. M. 2004, ApJ, 613, 986
- Pendleton et al. (1994) Pendleton, Y. J., Sandford, S. A., Allamandola, L. J., Tielens, A. G. G. M., & Sellgren, K. 1994, ApJ, 437, 683
- Puxley (1991) Puxley, P. J. 1991, MNRAS, 249, 11p
- Rawlings et al. (2003) Rawlings, M. G., Adamson, A. J., & Whittet, D. C. B. 2003, MNRAS, 341, 1121
- Rieke & Lebofsky (1985) Rieke, G. H., & Lebofsky, M. J. 1985, ApJ, 288, 618
- Rieke et al. (1989) Rieke, G. H., Rieke, M. J., & Paul, A. E. 1989, ApJ, 336, 752
- Risaliti et al. (2006) Risaliti, G., et al. 2006, MNRAS, 365, 303
- Roche & Aitken (1984) Roche P. F., & Aitken D. K. 1984, MNRAS, 208, 481
- Roche & Aitken (1985) Roche P. F., & Aitken D. K. 1985, MNRAS, 215, 425
- Sanders & Mirabel (1996) Sanders, D. B., & Mirabel, I. F. 1996, ARA&A, 34, 749
- Sanders et al. (1988a) Sanders, D. B., Soifer, B. T., Elias, J. H., Madore, B. F., Matthews, K., Neugebauer, G., & Scoville, N. Z. 1988a, ApJ, 325, 74
- Sanders et al. (1988b) Sanders, D. B., Soifer, B. T., Elias, J. H., Neugebauer, G., & Matthews, K. 1988b, ApJ, 328, L35
- Sellgren (1981) Sellgren, K. 1981, ApJ, 245, 138
- Shirahata et al. (2007) Shirahata, M., et al. 2007, ApJ, submitted
- Siebenmorgen et al. (2004) Siebenmorgen, R., Krugel, E., & Spoon, H. W. W. 2004, A&A, 414, 123
- Smith et al. (2004) Smith, J. D. T. et al. 2004, ApJS, 154, 199
- Soifer et al. (1987) Soifer, B. T., Sanders, D. B., Madore, B. F., Neugebauer, G., Danielson, G. E., Elias, J. H., Lonsdale, C. J., & Rice, W. L. 1987, ApJ, 320, 238
- Soifer et al. (2000) Soifer, B. T. et al. 2000, AJ, 119, 509
- Soifer et al. (2003) Soifer, B. T., Bock, J. J., Marsh, K., Neugebauer, G., Matthews, K., Egami, E., & Armus, L. 2003, AJ, 126, 143
- Soifer et al. (2002) Soifer, B. T., Neugebauer, G., Matthews, K., Egami, E., & Weinberger, A. J. 2002, AJ, 124, 2980
- Spaans (2006) Spaans, M. 2006, Dust and gas in ULIRGs: Tracing Star Formation and Black Hole Growth at the Centers of Ultraluminous Infrared Galaxies, http://isc.astro.cornell.edu/s̃poon/workshop/spaans.pdf
- Spoon et al. (2002) Spoon, H. W. W., Keane, J. V., Tielens, A. G. G. M., Lutz, D., Moorwood, A. F. M., & Laurent, O. 2002, A&A, 385, 1022
- Spoon et al. (2006) Spoon, H. W. W., Tielens, A. G. G. M., Armus, L., Sloan, G. C., Sargent, B., Cami, J., Cahmandaris, V., & Houck, J. R. 2006, ApJ, 638, 759
- Spoon et al. (2007) Spoon, H. W. W., Marshall, J. A., Houck, J. R., Elitzur, M., Hao, L., Armus, L., Brandl, B. R., & Charmandaris, V. 2007, ApJ, 654, L49
- Takeuchi et al. (2003) Takeuchi, T. T., Yoshikawa, K., & Ishii, T. T. 2003, ApJ, 587, L89
- Taniguchi et al. (1999) Taniguchi, Y., Yoshino, A., Ohyama, Y., & Nishiura, S. 1999, ApJ, 514, 660
- Veilleux et al. (1999a) Veilleux, S., Kim, D. -C., & Sanders, D. B. 1999a, ApJ, 522, 113
- Veilleux et al. (1999b) Veilleux, S., Sanders, D. B., & Kim, D. -C. 1999b, ApJ, 522, 139
- Veilleux et al. (1995) Veilleux, S., Kim, D. -C., Sanders, D. B., Mazzarella, J. M., & Soifer, B. T. 1995, ApJS, 98, 171
- Veilleux & Osterbrock (1987) Veilleux, S., & Osterbrock, D. E. 1987, ApJS, 63, 295
- Voit (1992) Voit, G. M. 1992, MNRAS, 258, 841
- Weedman et al. (2005) Weedman, D. W., et al. 2005, ApJ, 633, 706
- Werner et al. (2004) Werner, M. W., et al. 2004, ApJS, 154, 1
| Object | Redshift | f12 | f25 | f60 | f100 | log LIR | f25/f60 | Optical |
|---|---|---|---|---|---|---|---|---|
| (Jy) | (Jy) | (Jy) | (Jy) | L⊙ | Class | |||
| (1) | (2) | (3) | (4) | (5) | (6) | (7) | (8) | (9) |
| IRAS 001880856 | 0.128 | 0.12 | 0.37 | 2.59 | 3.40 | 12.3 | 0.14 (C) | LINER |
| IRAS 004822721 | 0.129 | 0.10 | 0.18 | 1.13 | 1.84 | 12.0 | 0.16 (C) | LINER |
| IRAS 03250+1606 | 0.129 | 0.10 | 0.15 | 1.38 | 1.77 | 12.1 | 0.11 (C) | LINER |
| IRAS 041032838 | 0.118 | 0.08 | 0.54 | 1.82 | 1.71 | 12.2 | 0.30 (W) | LINER |
| IRAS 08572+3915 | 0.058 | 0.32 | 1.70 | 7.43 | 4.59 | 12.1 | 0.23 (W) | LINER |
| IRAS 09039+0503 | 0.125 | 0.07 | 0.12 | 1.48 | 2.06 | 12.1 | 0.08 (C) | LINER |
| IRAS 09116+0334 | 0.146 | 0.09 | 0.14 | 1.09 | 1.82 | 12.1 | 0.13 (C) | LINER |
| IRAS 09539+0857 | 0.129 | 0.15 | 0.15 | 1.44 | 1.04 | 12.0 | 0.11 (C) | LINER |
| IRAS 10378+1108 | 0.136 | 0.11 | 0.24 | 2.28 | 1.82 | 12.3 | 0.11 (C) | LINER |
| IRAS 104851447 | 0.133 | 0.11 | 0.25 | 1.73 | 1.66 | 12.2 | 0.14 (C) | LINER |
| IRAS 10494+4424 | 0.092 | 0.12 | 0.16 | 3.53 | 5.41 | 12.1 | 0.05 (C) | LINER |
| IRAS 110950238 | 0.106 | 0.06 | 0.42 | 3.25 | 2.53 | 12.2 | 0.13 (C) | LINER |
| IRAS 111302659 | 0.136 | 0.09 | 0.20 | 1.21 | 1.24 | 12.1 | 0.17 (C) | LINER |
| IRAS 12112+0305 | 0.073 | 0.12 | 0.51 | 8.50 | 9.98 | 12.3 | 0.06 (C) | LINER |
| IRAS 121271412 | 0.133 | 0.13 | 0.24 | 1.54 | 1.13 | 12.1 | 0.16 (C) | LINER |
| IRAS 123590725 | 0.138 | 0.09 | 0.15 | 1.33 | 1.12 | 12.1 | 0.11 (C) | LINER |
| IRAS 133352612 | 0.125 | 0.13 | 0.14 | 1.40 | 2.10 | 12.1 | 0.10 (C) | LINER |
| IRAS 142521550 | 0.149 | 0.09 | 0.23 | 1.15 | 1.86 | 12.2 | 0.20 (C) | LINER |
| IRAS 143481447 | 0.083 | 0.07 | 0.49 | 6.87 | 7.07 | 12.3 | 0.07 (C) | LINER |
| IRAS 15327+2340 (Arp 220) | 0.018 | 0.48 | 7.92 | 103.33 | 112.40 | 12.1 | 0.08 (C) | LINER |
| IRAS 160900139 | 0.134 | 0.09 | 0.26 | 3.61 | 4.87 | 12.5 | 0.07 (C) | LINER |
| IRAS 16468+5200 | 0.150 | 0.06 | 0.10 | 1.01 | 1.04 | 12.1 | 0.10 (C) | LINER |
| IRAS 16487+5447 | 0.104 | 0.07 | 0.20 | 2.88 | 3.07 | 12.1 | 0.07 (C) | LINER |
| IRAS 17028+5817 | 0.106 | 0.06 | 0.10 | 2.43 | 3.91 | 12.1 | 0.04 (C) | LINER |
| IRAS 17044+6720 | 0.135 | 0.07 | 0.36 | 1.28 | 0.98 | 12.1 | 0.28 (W) | LINER |
| IRAS 213292346 | 0.125 | 0.05 | 0.12 | 1.65 | 2.22 | 12.1 | 0.07 (C) | LINER |
| IRAS 23234+0946 | 0.128 | 0.06 | 0.08 | 1.56 | 2.11 | 12.1 | 0.05 (C) | LINER |
| IRAS 23327+2913 | 0.107 | 0.06 | 0.22 | 2.10 | 2.81 | 12.1 | 0.10 (C) | LINER |
| IRAS 000910738 | 0.118 | 0.07 | 0.22 | 2.63 | 2.52 | 12.2 | 0.08 (C) | HII |
| IRAS 004562904 | 0.110 | 0.08 | 0.14 | 2.60 | 3.38 | 12.2 | 0.05 (C) | HII |
| IRAS 010042237 | 0.118 | 0.11 | 0.66 | 2.29 | 1.79 | 12.3 | 0.29 (W) | HII |
| IRAS 011660844 | 0.118 | 0.07 | 0.17 | 1.74 | 1.42 | 12.1 | 0.10 (C) | HII |
| IRAS 012980744 | 0.136 | 0.12 | 0.19 | 2.47 | 2.08 | 12.3 | 0.08 (C) | HII |
| IRAS 015692939 | 0.141 | 0.11 | 0.14 | 1.73 | 1.51 | 12.2 | 0.08 (C) | HII |
| IRAS 02411+0353 | 0.144 | 0.08 | 0.22 | 1.37 | 1.95 | 12.2 | 0.16 (C) | HII |
| IRAS 10190+1322 | 0.077 | 0.07 | 0.38 | 3.33 | 5.57 | 12.0 | 0.11 (C) | HII |
| IRAS 11387+4116 | 0.149 | 0.12 | 0.14 | 1.02 | 1.51 | 12.2 | 0.14 (C) | HII |
| IRAS 11506+1331 | 0.127 | 0.10 | 0.19 | 2.58 | 3.32 | 12.3 | 0.07 (C) | HII |
| IRAS 13509+0442 | 0.136 | 0.10 | 0.23 | 1.56 | 2.53 | 12.2 | 0.15 (C) | HII |
| IRAS 13539+2920 | 0.108 | 0.09 | 0.12 | 1.83 | 2.73 | 12.0 | 0.07 (C) | HII |
| IRAS 14060+2919 | 0.117 | 0.10 | 0.14 | 1.61 | 2.42 | 12.1 | 0.09 (C) | HII |
| IRAS 15206+3342 | 0.125 | 0.08 | 0.35 | 1.77 | 1.89 | 12.2 | 0.20 (C) | HII |
| IRAS 15225+2350 | 0.139 | 0.07 | 0.18 | 1.30 | 1.48 | 12.1 | 0.14 (C) | HII |
| IRAS 16474+3430 | 0.111 | 0.13 | 0.20 | 2.27 | 2.88 | 12.1 | 0.09 (C) | HII |
| IRAS 204141651 | 0.086 | 0.65 | 0.35 | 4.36 | 5.25 | 12.2 | 0.08 (C) | HII |
| IRAS 212080519 | 0.130 | 0.09 | 0.15 | 1.17 | 1.66 | 12.0 | 0.13 (C) | HII |
| IRAS 222062715 | 0.132 | 0.10 | 0.16 | 1.75 | 2.33 | 12.1 | 0.09 (C) | HII |
| IRAS 224911808 | 0.076 | 0.05 | 0.55 | 5.44 | 4.45 | 12.1 | 0.10 (C) | HII |
Note. — Col.(1): Object name. Col.(2): Redshift. Col.(3)–(6): f12, f25, f60, and f100 are IRAS fluxes at 12 m, 25 m, 60 m, and 100 m, respectively, taken from Kim & Sanders (1998). Col.(7): Decimal logarithm of infrared (81000 m) luminosity in units of solar luminosity (L⊙), calculated with D(Mpc)2 (13.48 + 5.16 + ) ergs s-1 (Sanders & Mirabel, 1996). Since the calculation is based on our adopted cosmology, the infrared luminosities slightly (10%) differ from the values shown in Kim & Sanders (1998, their Table 1, column 15). For sources that have upper limits in some IRAS bands, we can derive upper and lower limits of the infrared luminosity, by assuming that the actual flux is the IRAS-upper limit and zero value, respectively. The difference of the upper and lower values is usually very small, less than 0.2 dex. We assume that the infrared luminosity is the average of these values. Col.(8): IRAS 25 m to 60 m flux ratio. ULIRGs with f25/f60 0.2 and 0.2 are classified as cool and warm sources (denoted as “C” and “W”), respectively (Sanders et al., 1988b). Col.(9): Optical spectral classification by Veilleux et al. (1999a).
| Object | PID | Date | Integration time [sec] | |||
|---|---|---|---|---|---|---|
| [UT] | SL2 | SL1 | LL2 | LL1 | ||
| (1) | (2) | (3) | (4) | (5) | (6) | (7) |
| IRAS 001880856 | 105 | 2003 Dec 17 | 240 | 240 | 180 | 180 |
| IRAS 004822721 | 3187 + 2306 | 2005 Jul 7 + 2004 Jul 18 | 240 | 240 | 240 | 240 |
| IRAS 03250+1606 | 3187 + 2306 | 2005 Feb 11 | 240 | 240 | 240 | 240 |
| IRAS 041032838 | 3187 + 2306 | 2005 Feb 10 + 2004 Aug 10 | 240 | 240 | 240 | 240 |
| IRAS 08572+3915 | 105 | 2004 Apr 15 | 84 | 84 | 84 | 84 |
| IRAS 09039+0503 | 3187 + 2306 | 2005 Apr 18 + 2004 Nov 17 | 240 | 240 | 240 | 240 |
| IRAS 09116+0334 | 2306 | 2005 Apr 21 | 240 | 240 | 240 | 240 |
| IRAS 09539+0857 | 3187 + 2306 | 2005 Jun 5 + 2005 May 31 | 240 | 240 | 240 | 240 |
| IRAS 10378+1108 | 105 | 2005 Jun 8 | 240 | 240 | 180 | 180 |
| IRAS 104851447 | 3187 + 2306 | 2005 May 23 + 2005 Jan 4 | 240 | 240 | 480 aaAlthough separate spectroscopy of double nuclei (Kim et al., 2002) was proposed, the same coordinate was observed twice, probably because IRS blue peak up camera (13–18.5 m) pointed to the same position. | 480 aaAlthough separate spectroscopy of double nuclei (Kim et al., 2002) was proposed, the same coordinate was observed twice, probably because IRS blue peak up camera (13–18.5 m) pointed to the same position. |
| IRAS 10494+4424 | 2306 | 2004 Nov 17 | 240 | 240 | 240 | 240 |
| IRAS 110950238 | 105 | 2005 Jun 7 | 240 | 120 | 240 | 120 |
| IRAS 111302659 | 2306 | 2005 Jul 12 | 240 | 240 | 240 | 240 |
| IRAS 12112+0305 | 105 | 2004 Jan 4 | 84 | 84 | 120 | 120 |
| IRAS 121271412 | 3187 + 2306 | 2005 Jun 30 | 240 | 240 | 240 | 240 |
| IRAS 123590725 | 2306 | 2005 Jun 30 | 240 | 240 | 240 | 240 |
| IRAS 133352612 | 3187 + 2306 | 2005 Feb 15 + 2004 Jul 17 | 240 | 240 | 240 | 240 |
| IRAS 142521550 | 2306 | 2004 Jul 17 | 240 | 240 | 240 | 240 |
| IRAS 143481447 | 105 | 2004 Feb 7 | 120 | 120 | 120 | 120 |
| Arp 220 | 105 | 2004 Feb 29 | 84 | 84 | 60 | 60 |
| IRAS 160900139 | 105 | 2005 Aug 6 | 120 | 120 | 180 | 180 |
| IRAS 16468+5200 | 2306 | 2004 Jul 14 | 480 bbWe combined SL spectra of double nuclei with 3” separation (Kim et al., 2002), because both nuclei are very faint. The combined SL1 spectrum is smoothly connected to the LL2 spectrum. | 480 bbWe combined SL spectra of double nuclei with 3” separation (Kim et al., 2002), because both nuclei are very faint. The combined SL1 spectrum is smoothly connected to the LL2 spectrum. | 480 aaAlthough separate spectroscopy of double nuclei (Kim et al., 2002) was proposed, the same coordinate was observed twice, probably because IRS blue peak up camera (13–18.5 m) pointed to the same position. | 480 aaAlthough separate spectroscopy of double nuclei (Kim et al., 2002) was proposed, the same coordinate was observed twice, probably because IRS blue peak up camera (13–18.5 m) pointed to the same position. |
| IRAS 16487+5447 | 2306 | 2004 Jul 17 | 240 | 240 | 240 | 240 |
| IRAS 17028+5817 | 2306 | 2004 Jul 17 | 240 | 240 | 240 | 240 |
| IRAS 17044+6720 | 2306 | 2004 Jul 17 | 240 | 240 | 240 | 240 |
| IRAS 213292346 | 3187 + 2306 | 2004 Nov 16 + 2004 Oct 23 | 240 | 240 | 240 | 240 |
| IRAS 23234+0946 | 3187 + 2306 | 2004 Dec 13 + 2004 Dec 8 | 240 | 240 | 240 | 240 |
| IRAS 23327+2913 | 2306 | 2004 Dec 8 | 240 | 240 | 240 | 240 |
| IRAS 000910738 | 3187 + 2306 | 2005 Jun 30 + 2004 Dec 8 | 240 | 240 | 240 | 240 |
| IRAS 004562904 | 3187 + 2306 | 2005 Jul 14 + 2004 Jul 17 | 240 | 240 | 240 | 240 |
| IRAS 010042237 | 105 | 2004 Jan 4 | 120 | 120 | 120 | 120 |
| IRAS 011660844 | 3187 + 2306 | 2005 Jan 3 + 2005 Jan 15 + 2004 Jul 17 | 480 ccWe combined SL spectra of double nuclei with 5” separation (Kim et al., 2002), because the fainter northern nucleus is very faint. The combined SL1 spectrum is smoothly connected to the LL2 spectrum. | 480 ccWe combined SL spectra of double nuclei with 5” separation (Kim et al., 2002), because the fainter northern nucleus is very faint. The combined SL1 spectrum is smoothly connected to the LL2 spectrum. | 480 aaAlthough separate spectroscopy of double nuclei (Kim et al., 2002) was proposed, the same coordinate was observed twice, probably because IRS blue peak up camera (13–18.5 m) pointed to the same position. | 480 aaAlthough separate spectroscopy of double nuclei (Kim et al., 2002) was proposed, the same coordinate was observed twice, probably because IRS blue peak up camera (13–18.5 m) pointed to the same position. |
| IRAS 012980744 | 105 | 2005 Jul 14 | 240 | 240 | 120 | 120 |
| IRAS 015692939 | 2306 | 2004 Jul 18 | 240 | 240 | 240 | 240 |
| IRAS 02411+0353 | 2306 | 2005 Jan 14 | 240 | 240 | 240 | 240 |
| IRAS 10190+1322 | 3187 + 2306 | 2005 May 22 + 2004 Dec 12 | 240 + 240 ddSL spectra of the eastern and western nuclei with 4” separation (Kim et al., 2002) are analyzed separately, because both nuclei have similar flux levels. The combined SL1 spectrum is smoothly connected to the LL2 spectrum. | 240 + 240 ddSL spectra of the eastern and western nuclei with 4” separation (Kim et al., 2002) are analyzed separately, because both nuclei have similar flux levels. The combined SL1 spectrum is smoothly connected to the LL2 spectrum. | 480 aaAlthough separate spectroscopy of double nuclei (Kim et al., 2002) was proposed, the same coordinate was observed twice, probably because IRS blue peak up camera (13–18.5 m) pointed to the same position. | 480 aaAlthough separate spectroscopy of double nuclei (Kim et al., 2002) was proposed, the same coordinate was observed twice, probably because IRS blue peak up camera (13–18.5 m) pointed to the same position. |
| IRAS 11387+4116 | 2306 | 2005 Jan 11 | 240 | 240 | 240 | 240 |
| IRAS 11506+1331 | 3187 + 2306 | 2005 May 25 + 2005 Jan 3 | 240 | 240 | 240 | 240 |
| IRAS 13509+0442 | 2306 | 2004 Jul 17 | 240 | 240 | 240 | 240 |
| IRAS 13539+2920 | 2306 | 2005 Feb 7 | 240 | 240 | 240 | 240 |
| IRAS 14060+2919 | 2306 | 2004 Jul 16 | 240 | 240 | 240 | 240 |
| IRAS 15206+3342 | 105 | 2004 Jun 24 | 120 | 120 | 180 | 180 |
| IRAS 15225+2350 | 2306 | 2005 Feb 7 | 240 | 240 | 240 | 240 |
| IRAS 16474+3430 | 2306 | 2004 Jul 14 | 240 | 240 | 240 | 240 |
| IRAS 204141651 | 105 | 2004 May 14 | 120 | 120 | 120 | 120 |
| IRAS 212080519 | 3187 + 2306 | 2004 Nov 13 + 2004 Oct 22 | 240 eeOnly the brighter northern nucleus (Kim et al., 2002) was analyzed, because (1) the fainter southern nucleus with 7” separation is very faint, (2) it may not be fully covered with the LL spectrum, and (3) the SL1 spectrum of the northern nucleus is smoothly connected to the LL2 spectrum. | 240 eeOnly the brighter northern nucleus (Kim et al., 2002) was analyzed, because (1) the fainter southern nucleus with 7” separation is very faint, (2) it may not be fully covered with the LL spectrum, and (3) the SL1 spectrum of the northern nucleus is smoothly connected to the LL2 spectrum. | 480 aaAlthough separate spectroscopy of double nuclei (Kim et al., 2002) was proposed, the same coordinate was observed twice, probably because IRS blue peak up camera (13–18.5 m) pointed to the same position. | 480 aaAlthough separate spectroscopy of double nuclei (Kim et al., 2002) was proposed, the same coordinate was observed twice, probably because IRS blue peak up camera (13–18.5 m) pointed to the same position. |
| IRAS 222062715 | 3187 + 2306 | 2004 Nov 15 + 2004 Oct 25 | 240 | 240 | 480 aaAlthough separate spectroscopy of double nuclei (Kim et al., 2002) was proposed, the same coordinate was observed twice, probably because IRS blue peak up camera (13–18.5 m) pointed to the same position. | 480 aaAlthough separate spectroscopy of double nuclei (Kim et al., 2002) was proposed, the same coordinate was observed twice, probably because IRS blue peak up camera (13–18.5 m) pointed to the same position. |
| IRAS 224911808 | 105 | 2004 Jun 24 | 120 | 120 | 120 | 120 |
Note. — Col.(1): Object name. Col.(2): PID number: 105 (PI = J. Houck), 2306 (PI = M. Imanishi), and 3187 (PI = S. Veilleux). For sources denoted with “3187 + 2306”, SL and LL spectra were taken by observations with PID = 3187 and 2306, respectively. Col.(3): Observing date in UT. Col.(4): Net on-source integration time for SL2 spectroscopy in sec. Col.(5): Net on-source integration time for SL1 spectroscopy in sec. Col.(6): Net on-source integration time for LL2 spectroscopy in sec. Col.(7): Net on-source integration time for LL1 spectroscopy in sec.
| Object | EW6.2PAH | EW7.7PAH aaWe regard flux excess at = 7.3–8.1 m above an adopted continuum level as 7.7 m PAH emission, to reduce the effects of the strong 9.7 m silicate dust absorption feature. Our definition is different from those in many previous literatures. | EW11.3PAH | EW3.3PAH | L6.2PAH | L7.7PAH aaWe regard flux excess at = 7.3–8.1 m above an adopted continuum level as 7.7 m PAH emission, to reduce the effects of the strong 9.7 m silicate dust absorption feature. Our definition is different from those in many previous literatures. | L11.3PAH | L6.2PAH/LIR | L11.3PAH/LIR |
|---|---|---|---|---|---|---|---|---|---|
| [nm] | [nm] | [nm] | [nm] | 1042 [ergs s-1] | 1042 [ergs s-1] | 1042 [ergs s-1] | [ 10-3] | [ 10-3] | |
| (1) | (2) | (3) | (4) | (5) | (6) | (7) | (8) | (9) | (10) |
| IRAS 001880856 | 85 (40) | 305 | 290 | 50 | 3.5 | 17 | 3.4 | 0.4 | 0.4 |
| IRAS 004822721 | 260 | 710 | 465 | 1.8 | 4.8 | 0.9 | 0.5 | 0.2 | |
| IRAS 03250+1606 | 325 | 740 | 570 | 80 | 7.0 | 18 | 4.6 | 1.6 | 1.1 |
| IRAS 041032838 | 165 | 365 | 120 | 8.4 | 21 | 6.6 | 1.4 | 1.1 | |
| IRAS 08572+3915 | 15 | 100 | 30 | 5 | 1.9 | 18 | 0.5 | 0.4 | 0.1 |
| IRAS 09039+0503 | 325 (200) | 625 | 580 | 95 | 3.7 | 11 | 2.2 | 0.8 | 0.5 |
| IRAS 09116+0334 | 360 | 730 | 630 | 75 | 9.4 | 27 | 7.4 | 1.9 | 1.5 |
| IRAS 09539+0857 | 145 | 405 | 390 | 65 | 2.5 | 12 | 1.3 | 0.6 | 0.3 |
| IRAS 10378+1108 | 110 (50) | 450 | 210 | 40 | 2.2 | 14 | 1.5 | 0.3 | 0.2 |
| IRAS 104851447 | 225 (150) | 400 | 150 | 80 | 3.7 | 11 | 1.1 | 0.6 | 0.2 |
| IRAS 10494+4424 | 345 (250) | 715 | 495 | 110 | 6.1 | 19 | 3.1 | 1.1 | 0.6 |
| IRAS 110950238 | 20 (10) | 250 | 110 | 150 | 1.0 | 17 | 0.9 | 0.2 | 0.1 |
| IRAS 111302659 | 95 (60) | 490 | 280 | 1.9 | 13 | 1.0 | 0.4 | 0.2 | |
| IRAS 12112+0305 | 390 | 565 | 425 | 100+160 | 6.1 | 15 | 3.2 | 0.8 | 0.4 |
| IRAS 121271412 | 5 (3) | 95 | 20 | 0 | 0.7 | 11 | 0.6 | 0.1 | 0.1 |
| IRAS 123590725 | 220 | 445 | 165 | 75 | 3.1 | 8.8 | 1.1 | 0.6 | 0.2 |
| IRAS 133352612 | 310 | 700 | 610 | 6.6 | 17 | 5.1 | 1.5 | 1.2 | |
| IRAS 142521550 | 225 | 685 | 320 | 60+60 | 3.6 | 12 | 2.3 | 0.6 | 0.4 |
| IRAS 143481447 | 260 (110) | 540 | 500 | 70+110 | 5.9 | 19 | 3.6 | 0.8 | 0.5 |
| Arp 220 | 215 (120) | 410 | 315 | 80 | 1.5 | 5.1 | 0.8 | 0.3 | 0.2 |
| IRAS 160900139 | 110 (70) | 265 | 325 | 75 | 8.1 | 30 | 5.6 | 0.7 | 0.5 |
| IRAS 16468+5200 | 230 | 470 | 435 | 120 | 2.9 | 11 | 2.0 | 0.7 | 0.5 |
| IRAS 16487+5447 | 250 | 580 | 570 | 70 | 2.8 | 9.6 | 2.2 | 0.5 | 0.4 |
| IRAS 17028+5817 | 375 | 800 | 595 | 120 | 4.6 | 14 | 2.8 | 0.9 | 0.6 |
| IRAS 17044+6720 | 55 | 165 | 30 | 10 | 3.9 | 13 | 1.0 | 0.8 | 0.2 |
| IRAS 213292346 | 230 | 635 | 370 | 50 | 3.0 | 12 | 1.3 | 0.6 | 0.3 |
| IRAS 23234+0946 | 220 | 695 | 445 | 75 | 3.1 | 11 | 2.0 | 0.7 | 0.4 |
| IRAS 23327+2913 | 255 | 485 | 175 | 45 | 2.5 | 6.9 | 1.4 | 0.6 | 0.3 |
| IRAS 000910738 | 50 (30) | 350 | 255 | 1.3 | 15 | 1.5 | 0.2 | 0.3 | |
| IRAS 004562904 | 385 | 750 | 545 | 11 | 27 | 7.6 | 1.9 | 1.4 | |
| IRAS 010042237 | 45 | 190 | 8 | 3.1 | 19 | 0.5 | 0.4 | 0.1 | |
| IRAS 011660844 | 30 | 430 | 190 | 0.5 | 8.5 | 0.7 | 0.1 | 0.2 | |
| IRAS 012980744 | 10 (6) | 380 | 155 | 0.7 | 37 | 1.1 | 0.1 | 0.1 | |
| IRAS 015692939 | 115 | 555 | 255 | 3.1 | 20 | 2.0 | 0.5 | 0.3 | |
| IRAS 02411+0353 | 300 | 695 | 375 | 13 | 38 | 7.9 | 2.1 | 1.3 | |
| IRAS 10190+1322E | 375 | 680 | 510 | 95 | 4.4 | 12 | 3.0 | 1.2 | 0.8 |
| IRAS 10190+1322W | 375 | 745 | 685 | 50 | 4.6 | 11 | 3.6 | 1.2 | 0.9 |
| IRAS 11387+4116 | 265 | 680 | 475 | 75 | 4.2 | 15 | 3.9 | 0.7 | 0.7 |
| IRAS 11506+1331 | 195 (120) | 540 | 305 | 95 | 8.5 | 26 | 3.4 | 1.1 | 0.4 |
| IRAS 13509+0442 | 490 | 795 | 590 | 135 | 9.7 | 22 | 4.7 | 1.5 | 0.7 |
| IRAS 13539+2920 | 355 | 755 | 600 | 85 | 7.6 | 22 | 4.4 | 1.9 | 1.1 |
| IRAS 14060+2919 | 340 | 860 | 530 | 150 | 8.6 | 27 | 6.5 | 2.0 | 1.5 |
| IRAS 15206+3342 | 225 | 525 | 230 | 55 | 12 | 32 | 7.7 | 2.0 | 1.3 |
| IRAS 15225+2350 | 145 (100) | 290 | 130 | 40 | 5.0 | 16 | 2.0 | 1.0 | 0.4 |
| IRAS 16474+3430 | 390 | 820 | 575 | 105 | 9.2 | 27 | 5.8 | 1.7 | 1.1 |
| IRAS 204141651 | 330 | 705 | 465 | 75 | 3.2 | 10 | 1.7 | 0.5 | 0.3 |
| IRAS 212080519 | 505 | 810 | 420 | 100 | 6.0 | 14 | 2.7 | 1.5 | 0.7 |
| IRAS 222062715 | 210 | 975 | 565 | 3.1 | 13 | 2.7 | 0.6 | 0.5 | |
| IRAS 224911808 | 325 | 695 | 460 | 3.9 | 12 | 2.6 | 0.8 | 0.5 |
Note. — Col.(1): Object name. Col.(2): Rest-frame equivalent width of the 6.2 m PAH emission. The values in parentheses are approximate ones after correction for the ice and HAC absorption features. Col.(3): Rest-frame equivalent width of the 7.7 m PAH emission. Col.(4): Rest-frame equivalent width of the 11.3 m PAH emission. Col.(5): Rest-frame equivalent width of the 3.3 m PAH emission, taken from Imanishi et al. (2006a). —: no data. Col.(6): Luminosity of the 6.2 m PAH emission in units of 1042 ergs s-1. Col.(7): Luminosity of the 7.7 m PAH emission in units of 1042 ergs s-1. Col.(8): Luminosity of the 11.3 m PAH emission in units of 1042 ergs s-1. Col.(9): The 6.2 m PAH to infrared luminosity ratio in units of 10-3. The ratio for normal starbursts with modest dust obscuration (AV 20–30 mag) is 3.4 10-3 (Peeters et al., 2004). Col.(10): The 11.3 m PAH to infrared luminosity ratio in units of 10-3. The ratio for normal starbursts with modest dust obscuration (AV 20–30 mag) is 1.4 10-3 (Soifer et al., 2002).
| Object | / | / | ||||
|---|---|---|---|---|---|---|
| (1) | (2) | (3) | (4) | (5) | (6) | (7) |
| IRAS 001880856 | 3.1 | 2.5 | 0.55 | 0.65 | 0.22 | 0.26 |
| IRAS 004822721 | 2.6 | 2.1 | 0.6 | 0.75 | 0.29 | 0.36 |
| IRAS 03250+1606 | 1.8 | 1.6 | ||||
| IRAS 041032838 | 0.5 | 0.6 | ||||
| IRAS 08572+3915 | 4.1 | 3.8 | 0.9 | 1.0 | 0.24 | 0.26 |
| IRAS 09039+0503 | 2.6 | 2.2 | 0.9 | 1.0 | 0.41 | 0.45 |
| IRAS 09116+0334 | 1.5 | 1.1 | ||||
| IRAS 09539+0857 | 3.8 | 3.5 | 1.3 | 1.6 | 0.37 | 0.46 |
| IRAS 10378+1108 | 2.6 | 2.4 | 0.45 | 0.55 | 0.19 | 0.23 |
| IRAS 104851447 | 3.0 | 3.0 | 0.8 | 0.95 | 0.27 | 0.32 |
| IRAS 10494+4424 | 2.2 | 1.7 | ||||
| IRAS 110950238 | 3.5 | 3.4 | 0.8 | 0.9 | 0.23 | 0.26 |
| IRAS 111302659 | 3.5 | 3.1 | 1.0 | 1.2 | 0.32 | 0.39 |
| IRAS 12112+0305 | 2.3 | 1.7 | ||||
| IRAS 121271412 | 3.0 | 2.5 | 0.6 | 0.7 | 0.24 | 0.28 |
| IRAS 123590725 | 2.2 | 1.8 | 0.5 | 0.55 | 0.28 | 0.31 |
| IRAS 133352612 | 1.6 | 1.4 | ||||
| IRAS 142521550 | 1.6 | 1.4 | ||||
| IRAS 143481447 | 2.8 | 2.0 | ||||
| Arp 220 | 3.7 | 3.2 | 0.95 | 1.1 | 0.30 | 0.34 |
| IRAS 160900139 | 3.0 | 2.6 | 0.7 | 0.8 | 0.27 | 0.31 |
| IRAS 16468+5200 | 3.0 | 2.5 | 0.65 | 0.8 | 0.26 | 0.32 |
| IRAS 16487+5447 | 2.4 | 1.8 | ||||
| IRAS 17028+5817 | 2.0 | 1.5 | ||||
| IRAS 17044+6720 | 1.7 | 1.8 | 0.4 | 0.5 | 0.22 | 0.28 |
| IRAS 213292346 | 2.7 | 2.2 | ||||
| IRAS 23234+0946 | 2.2 | 1.8 | ||||
| IRAS 23327+2913 | 1.5 | 1.3 | ||||
| IRAS 000910738 | 3.2 | 3.2 | 1.05 | 1.25 | 0.33 | 0.39 |
| IRAS 004562904 | 1.5 | 1.2 | ||||
| IRAS 010042237 | 0.4 | 0.4 | ||||
| IRAS 011660844 | 3.2 | 3.0 | 0.75 | 0.9 | 0.25 | 0.30 |
| IRAS 012980744 | 4.3 | 4.0 | 1.1 | 1.35 | 0.27 | 0.34 |
| IRAS 015692939 | 3.2 | 2.8 | 1.0 | 1.2 | 0.36 | 0.43 |
| IRAS 02411+0353 | 1.3 | 1.0 | ||||
| IRAS 10190+1322 aaTo estimate the optical depths of silicate dust absorption features, SL spectra of the eastern and western nuclei are summed. | 1.7 | 1.3 | ||||
| IRAS 11387+4116 | 1.6 | 1.1 | ||||
| IRAS 11506+1331 | 2.6 | 2.3 | 0.7 | 0.85 | 0.30 | 0.37 |
| IRAS 13509+0442 | 2.0 | 1.6 | ||||
| IRAS 13539+2920 | 1.8 | 1.6 | ||||
| IRAS 14060+2919 | 1.5 | 1.0 | ||||
| IRAS 15206+3342 | 0.9 | 0.6 | ||||
| IRAS 15225+2350 | 2.5 | 2.2 | 0.65 | 0.75 | 0.29 | 0.34 |
| IRAS 16474+3430 | 1.8 | 1.5 | ||||
| IRAS 204141651 | 2.4 | 1.9 | ||||
| IRAS 212080519 | 1.5 | 1.4 | ||||
| IRAS 222062715 | 2.4 | 1.7 | ||||
| IRAS 224911808 | 2.0 | 1.5 |
Note. — Col.(1): Object name. Col.(2): is an optical depth of the 9.7 m silicate dust absorption feature, against a power-law continuum determined from data points at = 5.6 m, 7.1 m and = 34–35 m, shown as dashed lines in Figures 3 and 4. Col.(3): is an optical depth of the 9.7 m silicate dust absorption feature, against a power-law continuum determined from data points at = 7.1 m and 14.2 m, shown as dotted lines in Figures 3 and 4. Once the continuum levels are fixed, the uncertainty of is 5% for ULIRGs with large values (2) and can be 10% for ULIRGs with small . Col.(4): is an optical depth of the 18 m silicate dust absorption feature, against a power-law continuum determined from data points at = 14.2 m and 24 m, shown as dotted lines in Figures 3 and 4. Once the continuum is fixed, the statistic uncertainty of is 10%, because the value is estimated only for ULIRGs with clearly detectable 18 m silicate absorption features. Col.(5): is an optical depth of the 18 m silicate dust absorption feature, against a power-law continuum determined from data points at = 14.2 m and 29 m, shown as dashed-dotted lines in Figures 3 and 4. Once the continuum is fixed, the statistic uncertainty is 10%. Col.(6): / ratio, only for ULIRGs with clearly detectable 18 m silicate absorption. The uncertainty is 10%, once the continuum is fixed. Col.(7): / ratio, only for ULIRGs with clearly detectable 18 m silicate absorption.
| Object | 6.0 m | 3.1 m | ||
|---|---|---|---|---|
| (1) | (2) | (3) | (4) | (5) |
| IRAS 001880856 | 0.9 | 1.8 | ||
| IRAS 004822721 | X | |||
| IRAS 03250+1606 | X | 0.8 | ||
| IRAS 041032838 | X | |||
| IRAS 08572+3915 | X | X | ||
| IRAS 09039+0503 | 0.6 | 0.8 | ||
| IRAS 09116+0334 | X | 0.4 | ||
| IRAS 09539+0857 | X | X | ||
| IRAS 10378+1108 | 0.8 | 0.6 | ||
| IRAS 104851447 | 0.5 | 0.8 | ||
| IRAS 10494+4424 | 0.4 | 1.0 | ||
| IRAS 110950238 | 0.5 | X | ||
| IRAS 111302659 | 0.5 | |||
| IRAS 12112+0305 | X | |||
| IRAS 121271412 | 0.4 | 0.4 | ||
| IRAS 123590725 | X | 0.5 | ||
| IRAS 133352612 | X | |||
| IRAS 142521550 | X | 0.7 | ||
| IRAS 143481447 | 0.9 | 0.5 | ||
| Arp 220 | 0.6 | |||
| IRAS 160900139 | 0.5 | 0.8 | ||
| IRAS 16468+5200 | X | |||
| IRAS 16487+5447 | 1.2 | |||
| IRAS 17028+5817 | 0.6 | |||
| IRAS 17044+6720 | X | X | ||
| IRAS 213292346 | 1.0 | |||
| IRAS 23234+0946 | X | X | ||
| IRAS 23327+2913 | X | X | ||
| IRAS 000910738 | 0.5 | |||
| IRAS 004562904 | X | |||
| IRAS 010042237 | X | |||
| IRAS 011660844 | X | |||
| IRAS 012980744 | 0.5 | |||
| IRAS 015692939 | X | |||
| IRAS 02411+0353 | X | |||
| IRAS 10190+1322E | X | X | ||
| IRAS 10190+1322W | X | X | ||
| IRAS 11387+4116 | X | X | ||
| IRAS 11506+1331 | 0.5 | 1.0 | ||
| IRAS 13509+0442 | X | X | ||
| IRAS 13539+2920 | X | X | ||
| IRAS 14060+2919 | X | X | ||
| IRAS 15206+3342 | X | X | ||
| IRAS 15225+2350 | 0.5 | 0.4 | ||
| IRAS 16474+3430 | X | 0.8 | ||
| IRAS 204141651 | X | X | ||
| IRAS 212080519 | X | X | ||
| IRAS 222062715 | X | |||
| IRAS 224911808 | X |
Note. — Col.(1): Object name. Col.(2): Detection or non-detection of the 6.0 m ice absorption feature. : clearly detected. : possibly detected. X: non-detected. The non-detection includes two cases; (i) the absorption feature is indeed weak or absent in high signal-to-noise ratios spectra, or (ii) the presence of ice absorption is not clear due to relatively large scatter in spectra or to the difficulty in separating the ice absorption and nearby PAH emission features. Col.(3): Optical depth of the 6.0 m ice absorption feature. —: not measurable. Since data scatter in spectra is not the same for individual ULIRGs, there is no fixed detection threshold. The uncertainty is 0.1 for detected sources. Col.(4): Detection or non-detection of the 3.1 m ice absorption feature in the 2.8–4.1 m spectra of Imanishi et al. (2006a). : clearly detected. X: non-detected. —: no data. Col.(5): Optical depth of the 3.1 m ice absorption feature. —: not measurable because (i) it is weak, (ii) data scatter is large in spectra, and (iii) 2.8–4.1 m spectra are lacking. Again there is no fixed detection threshold.
| Object | Spitzer IRS 5–35 m | 3–4 m | |||||
|---|---|---|---|---|---|---|---|
| EW6.2PAH | EW7.7PAH | EW11.3PAH | T-gradient | Total | |||
| (1) | (2) | (3) | (4) | (5) | (6) | (7) | (8) |
| IRAS 001880856 | X | X | |||||
| IRAS 004822721 | X | X | X | X | |||
| IRAS 03250+1606 | X | X | X | X | X | X | |
| IRAS 041032838 | X | X | X | ||||
| IRAS 08572+3915 | |||||||
| IRAS 09039+0503 | X | X | X | X | |||
| IRAS 09116+0334 | X | X | X | X | X | X | |
| IRAS 09539+0857 | X | X | X | X | |||
| IRAS 10378+1108 | X | X | |||||
| IRAS 104851447 | X () | X | |||||
| IRAS 10494+4424 | X | X | X | X | X | X | |
| IRAS 110950238 | X | X | |||||
| IRAS 111302659 | X | X | X | X | |||
| IRAS 12112+0305 | X | X | X | X | X | X | X |
| IRAS 121271412 | |||||||
| IRAS 123590725 | X | X | X | ||||
| IRAS 133352612 | X | X | X | X | X | X | |
| IRAS 142521550 | X | X | X | X | X | X | |
| IRAS 143481447 | X () | X | X | X | X | ||
| Arp 220 | X () | X | X | X | X | ||
| IRAS 160900139 | X | X | |||||
| IRAS 16468+5200 | X | X | X | X | |||
| IRAS 16487+5447 | X | X | X | X | X | X | |
| IRAS 17028+5817 | X | X | X | X | X | X | |
| IRAS 17044+6720 | X (—) aaThe small value is due to weak obscuration of a luminous AGN, rather than the normal starburst nature with mixed dust/source geometry. | ||||||
| IRAS 213292346 | X | X | X | X | |||
| IRAS 23234+0946 | X | X | X | X | X | X | X |
| IRAS 23327+2913 | X | X | X | X | X | ||
| IRAS 000910738 | X | X | X | ||||
| IRAS 004562904 | X | X | X | X | X | X | |
| IRAS 010042237 | X (—) aaThe small value is due to weak obscuration of a luminous AGN, rather than the normal starburst nature with mixed dust/source geometry. | X | |||||
| IRAS 011660844 | X | ||||||
| IRAS 012980744 | X | X | |||||
| IRAS 015692939 | X | X | X | ||||
| IRAS 02411+0353 | X | X | X | X | X | X | |
| IRAS 10190+1322 | X bbPAH equivalent widths are derived for both nuclei separately. No AGN signatures are found in both nuclei. | X bbPAH equivalent widths are derived for both nuclei separately. No AGN signatures are found in both nuclei. | X bbPAH equivalent widths are derived for both nuclei separately. No AGN signatures are found in both nuclei. | X | X | X | X |
| IRAS 11387+4116 | X | X | X | X | X | X | X |
| IRAS 11506+1331 | X () | X | X | X | |||
| IRAS 13509+0442 | X | X | X | X | X | X | X |
| IRAS 13539+2920 | X | X | X | X | X | X | X |
| IRAS 14060+2919 | X | X | X | X | X | X | X |
| IRAS 15206+3342 | X | X | X | X | X | X | X |
| IRAS 15225+2350 | X | X | |||||
| IRAS 16474+3430 | X | X | X | X | X | X | |
| IRAS 204141651 | X | X | X | X | X | X | X |
| IRAS 212080519 | X | X | X | X | X | X | X |
| IRAS 222062715 | X | X | X | X | X | X | |
| IRAS 224911808 | X | X | X | X | X | X | |
Note. — Col.(1): Object name. Col.(2): Buried AGN signatures based on the low equivalent width of the 6.2 m PAH emission (EW6.2PAH 180 nm) (5.2.1). : present. X: none. When the corrected EW6.2PAH value becomes less than 180 nm, the symbol “” is shown in parentheses. Col.(3): Buried AGN signatures based on the low equivalent width of the 7.7 m PAH emission (EW7.7PAH 230 nm) (5.2.1). : present. X: none. Col.(4): Buried AGN signatures based on the low equivalent width of the 11.3 m PAH emission (EW11.3PAH 200 nm) (5.2.1). : present. X: none. Col.(5): Buried AGN signatures based on the large value (2) (5.2.2). : present. X: none. Col.(6): Buried AGN signatures based on the small / and / ratios. : present. : possibly present. X: none. Considering the uncertainty of the ratio with 10% (Table 4), ULIRGs showing / 0.27 and / 0.32 are taken as sources with detectable signatures of strong dust temperature gradients (5.2.3). Col.(7): Buried AGN signatures from combined methods in Col. (2)–(6) based on Spitzer IRS spectra. : very strong. : strong. : possibly present. X: none. Please see 5.2.6 for more details. Col.(7): Buried AGN signatures based on infrared 3–4 m spectroscopic diagnostic by Imanishi et al. (2006a). : very strong. : strong. X: none. —: no data.
| Object | L(AGN) [1045 ergs s-1] |
|---|---|
| (1) | (2) |
| IRAS 001880856 | 1.5 |
| IRAS 041032838 | 1.5 |
| IRAS 08572+3915 | 5.5 |
| IRAS 10378+1108 | 1.0 |
| IRAS 104851447 | 1.0 |
| IRAS 110950238 | 2.5 |
| IRAS 111302659 | 1.0 |
| IRAS 121271412 | 2.5 |
| IRAS 160900139 | 2.0 |
| IRAS 17044+6720 | 2.0 |
| IRAS 000910738 | 1.5 |
| IRAS 010042237 | 1.5 |
| IRAS 011660844 | 1.0 |
| IRAS 012980744 | 3.5 |
| IRAS 15225+2350 | 1.5 |
Note. — Col.(1): Object name. Col.(2): Absorption-corrected intrinsic luminosity of the AGN energetic radiation (X-ray – UV – optical) in units of 1045 ergs s-1.
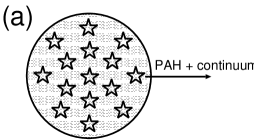
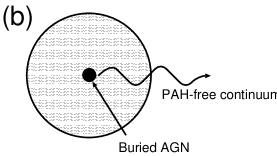
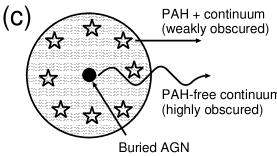
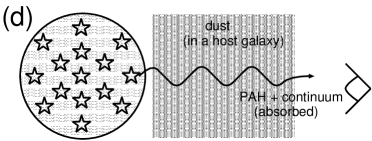
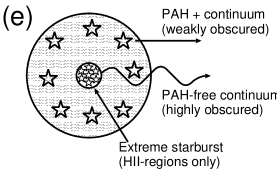
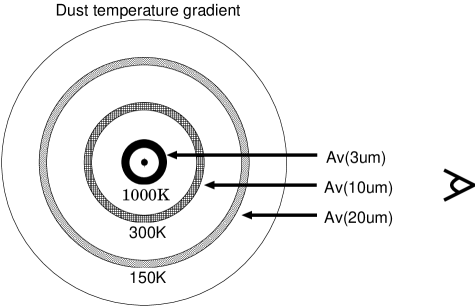
![[Uncaptioned image]](/html/astro-ph/0702136/assets/x7.png)
![[Uncaptioned image]](/html/astro-ph/0702136/assets/x8.png)
![[Uncaptioned image]](/html/astro-ph/0702136/assets/x9.png)
![[Uncaptioned image]](/html/astro-ph/0702136/assets/x10.png)
![[Uncaptioned image]](/html/astro-ph/0702136/assets/x11.png)
![[Uncaptioned image]](/html/astro-ph/0702136/assets/x12.png)
![[Uncaptioned image]](/html/astro-ph/0702136/assets/x13.png)
![[Uncaptioned image]](/html/astro-ph/0702136/assets/x14.png)
![[Uncaptioned image]](/html/astro-ph/0702136/assets/x15.png)
![[Uncaptioned image]](/html/astro-ph/0702136/assets/x16.png)
![[Uncaptioned image]](/html/astro-ph/0702136/assets/x17.png)
![[Uncaptioned image]](/html/astro-ph/0702136/assets/x18.png)
![[Uncaptioned image]](/html/astro-ph/0702136/assets/x19.png)
![[Uncaptioned image]](/html/astro-ph/0702136/assets/x20.png)
![[Uncaptioned image]](/html/astro-ph/0702136/assets/x21.png)
![[Uncaptioned image]](/html/astro-ph/0702136/assets/x22.png)
![[Uncaptioned image]](/html/astro-ph/0702136/assets/x23.png)
![[Uncaptioned image]](/html/astro-ph/0702136/assets/x24.png)
![[Uncaptioned image]](/html/astro-ph/0702136/assets/x25.png)
![[Uncaptioned image]](/html/astro-ph/0702136/assets/x26.png)
![[Uncaptioned image]](/html/astro-ph/0702136/assets/x27.png)
![[Uncaptioned image]](/html/astro-ph/0702136/assets/x28.png)
![[Uncaptioned image]](/html/astro-ph/0702136/assets/x29.png)
![[Uncaptioned image]](/html/astro-ph/0702136/assets/x30.png)


![[Uncaptioned image]](/html/astro-ph/0702136/assets/x35.png)
![[Uncaptioned image]](/html/astro-ph/0702136/assets/x36.png)
![[Uncaptioned image]](/html/astro-ph/0702136/assets/x37.png)
![[Uncaptioned image]](/html/astro-ph/0702136/assets/x38.png)
![[Uncaptioned image]](/html/astro-ph/0702136/assets/x39.png)
![[Uncaptioned image]](/html/astro-ph/0702136/assets/x40.png)
![[Uncaptioned image]](/html/astro-ph/0702136/assets/x41.png)
![[Uncaptioned image]](/html/astro-ph/0702136/assets/x42.png)
![[Uncaptioned image]](/html/astro-ph/0702136/assets/x43.png)
![[Uncaptioned image]](/html/astro-ph/0702136/assets/x44.png)
![[Uncaptioned image]](/html/astro-ph/0702136/assets/x45.png)
![[Uncaptioned image]](/html/astro-ph/0702136/assets/x46.png)


![[Uncaptioned image]](/html/astro-ph/0702136/assets/x55.png)
![[Uncaptioned image]](/html/astro-ph/0702136/assets/x56.png)
![[Uncaptioned image]](/html/astro-ph/0702136/assets/x57.png)
![[Uncaptioned image]](/html/astro-ph/0702136/assets/x58.png)
![[Uncaptioned image]](/html/astro-ph/0702136/assets/x59.png)
![[Uncaptioned image]](/html/astro-ph/0702136/assets/x60.png)
![[Uncaptioned image]](/html/astro-ph/0702136/assets/x61.png)
![[Uncaptioned image]](/html/astro-ph/0702136/assets/x62.png)
![[Uncaptioned image]](/html/astro-ph/0702136/assets/x63.png)
![[Uncaptioned image]](/html/astro-ph/0702136/assets/x64.png)
![[Uncaptioned image]](/html/astro-ph/0702136/assets/x65.png)
![[Uncaptioned image]](/html/astro-ph/0702136/assets/x66.png)
![[Uncaptioned image]](/html/astro-ph/0702136/assets/x67.png)
![[Uncaptioned image]](/html/astro-ph/0702136/assets/x68.png)
![[Uncaptioned image]](/html/astro-ph/0702136/assets/x69.png)
![[Uncaptioned image]](/html/astro-ph/0702136/assets/x70.png)
![[Uncaptioned image]](/html/astro-ph/0702136/assets/x71.png)
![[Uncaptioned image]](/html/astro-ph/0702136/assets/x72.png)
![[Uncaptioned image]](/html/astro-ph/0702136/assets/x73.png)
![[Uncaptioned image]](/html/astro-ph/0702136/assets/x74.png)
![[Uncaptioned image]](/html/astro-ph/0702136/assets/x75.png)
![[Uncaptioned image]](/html/astro-ph/0702136/assets/x76.png)
![[Uncaptioned image]](/html/astro-ph/0702136/assets/x77.png)
![[Uncaptioned image]](/html/astro-ph/0702136/assets/x78.png)
![[Uncaptioned image]](/html/astro-ph/0702136/assets/x79.png)
![[Uncaptioned image]](/html/astro-ph/0702136/assets/x80.png)
![[Uncaptioned image]](/html/astro-ph/0702136/assets/x81.png)
![[Uncaptioned image]](/html/astro-ph/0702136/assets/x82.png)
![[Uncaptioned image]](/html/astro-ph/0702136/assets/x83.png)
![[Uncaptioned image]](/html/astro-ph/0702136/assets/x84.png)
![[Uncaptioned image]](/html/astro-ph/0702136/assets/x85.png)
![[Uncaptioned image]](/html/astro-ph/0702136/assets/x86.png)
![[Uncaptioned image]](/html/astro-ph/0702136/assets/x87.png)
![[Uncaptioned image]](/html/astro-ph/0702136/assets/x88.png)
![[Uncaptioned image]](/html/astro-ph/0702136/assets/x89.png)
![[Uncaptioned image]](/html/astro-ph/0702136/assets/x90.png)
![[Uncaptioned image]](/html/astro-ph/0702136/assets/x91.png)
![[Uncaptioned image]](/html/astro-ph/0702136/assets/x92.png)
![[Uncaptioned image]](/html/astro-ph/0702136/assets/x93.png)
![[Uncaptioned image]](/html/astro-ph/0702136/assets/x94.png)
![[Uncaptioned image]](/html/astro-ph/0702136/assets/x95.png)
![[Uncaptioned image]](/html/astro-ph/0702136/assets/x96.png)
![[Uncaptioned image]](/html/astro-ph/0702136/assets/x97.png)


![[Uncaptioned image]](/html/astro-ph/0702136/assets/x106.png)
![[Uncaptioned image]](/html/astro-ph/0702136/assets/x107.png)
![[Uncaptioned image]](/html/astro-ph/0702136/assets/x108.png)
![[Uncaptioned image]](/html/astro-ph/0702136/assets/x109.png)
![[Uncaptioned image]](/html/astro-ph/0702136/assets/x110.png)
![[Uncaptioned image]](/html/astro-ph/0702136/assets/x111.png)
![[Uncaptioned image]](/html/astro-ph/0702136/assets/x112.png)
![[Uncaptioned image]](/html/astro-ph/0702136/assets/x113.png)
![[Uncaptioned image]](/html/astro-ph/0702136/assets/x114.png)
![[Uncaptioned image]](/html/astro-ph/0702136/assets/x115.png)
![[Uncaptioned image]](/html/astro-ph/0702136/assets/x116.png)
![[Uncaptioned image]](/html/astro-ph/0702136/assets/x117.png)


