Effects of the energy error distribution of fluorescence telescopes on the UHECR energy spectrum
Abstract
The measurement of the ultra high energy cosmic ray (UHECR) spectrum is strongly affected by uncertainties on the reconstructed energy. The determination of the presence or absence of the GZK cutoff and its position in the energy spectrum depends not only on high statistics but also on the shape of the energy error distribution. Here we determine the energy error distribution for fluorescence telescopes, based on a Monte Carlo simulation. The HiRes and Auger fluorescence telescopes are simulated in detail. We analyze the UHECR spectrum convolved with this energy error distribution. We compare this spectrum with one convolved with a lognormal error distribution as well as with a Gaussian error distribution. We show that the energy error distribution for fluorescence detectors can not be represented by these known distributions. We conclude that the convolved energy spectrum will be smeared but not enough to affect the GZK cutoff detection. This conclusion stands for both HiRes and Auger fluorescence telescopes. This result differs from the effect of the energy error distribution obtained with ground detectors and reinforces the importance of the fluorescence energy measurement. We also investigate the effect of possible fluorescence yield measurement errors in the energy spectrum.
keywords:
cosmic rays , energy spectrum , fluorescence telescopes , energy reconstruction errorPACS:
96.40-z,96.40.Pq,96.40.De1 Introduction
A sharp steepening of the cosmic ray energy spectrum is expected around eV. This cutoff is due to the energy loss of ultra high energy cosmic rays (UHECR111cosmic rays with energies above eV.) when traveling through the Cosmic Microwave Background Radiation (CMB). Greisen [1] and Zatsepin and Kuzmin [2, 3] showed that the main energy loss mechanism of UHECRs interactions with the CMB is the photo production of pions. In order to reach the Earth, UHECR should be produced within Mpc radius unless it is a nonstandard particle [4, 5, 6]. As no known powerful source [7] is located within this range, the spectrum is expected to steepen. However, detection of events with energies above eV [8, 9] questions the existence of the steepening of the spectrum and is known as the GZK puzzle. One of the keys to solve this puzzle is the determination of the UHECR energy spectrum.
The observation or the absence of the cutoff in the spectrum have different consequences. The absence will most likely be explained by new physics predicted by models beyond the standard model of particle physics. It is hard to understand the production mechanism and the composition of the most energetic end of the spectrum with our current knowledge of astroparticle physics. If the cutoff is present the understanding of the spectrum will not necessarily involve new physics but the high end of the energy spectrum is not yet fully understood.
The recent experimental results from HiRes [8] and AGASA [9] are not conclusive about the presence of the GZK cutoff. The Pierre Auger Observatory [10] is already active and has the capability of measuring the UHECR spectrum with a statistically significant data set to determine the presence or absence of the GZK cutoff.
Within this scenario, it is important to assure that the features of the energy spectrum can be well measured despite of fluctuations that are intrinsic to the shower development and to energy errors due to detection techniques and reconstruction procedures. Recently, it has been shown [11] that the energy error distribution (from now on EED) due to the detection of cosmic rays at ground level resembles a lognormal distribution. If the standard deviation of this distribution is too large it will smear the UHECR spectrum in a way that the GZK cutoff might not be seen. The effect of various kinds of EEDs on the energy spectrum is also done in reference [12]. It has also been argued that the discrepancy between AGASA [9] and HiRes [8] suggests the presence of systematic errors in the energy reconstruction [13].
In this analysis, we determine the EED for fluorescence telescopes. We then analyze the UHECR spectrum convolved with this EED. This convolved spectrum is compared with two different convolutions: one using a lognormal and another using a Gaussian EED. We show that these known distributions do not represent well the fluorescence EED. We also show that not only the average energy error varies with energy but also the shape of the EED is energy dependent.
Fluorescence telescopes play an important role in the cosmic ray energy determination due to its calorimetric measurement. Our determination of the fluorescence EED includes missing energy corrections and estimated errors for fluorescence yield measurements. We determine the EED for two limiting cases. First, we consider only the intrinsic features of air showers and the EED that arises due to its natural fluctuations. The effect of this EED in the UHECR spectrum represents the minimum modification that will be obtained through longitudinal development measurements.
Secondly, a full simulation of the shower detection and reconstruction procedure is done for fluorescence telescopes and a realistic smoothing of the energy spectrum is determined. This analysis has two steps: the EED is first determined with no error over the fluorescence yield simulation and later this error is included in an arbitrary way. We show that in both cases the EED produces a noticeable smoothing in the energy spectrum. The simulation with no fluorescence yield error however does not smear the GZK cutoff significantly. When these errors are introduced there is a significant change in the number of events around the GZK cutoff position of the spectrum although not big enough to erase the cutoff. In both cases there is a significant shift on the flux weighted by a third power of energy.
This article is organized in the following way: in section 2 we describe the shower and telescope simulations, in section 3 we determine the EED as a function of energy for different telescope configurations and analysis procedures, in section 4 we analyze the influence of the EED on the energy spectrum reconstruction and in the last section we discuss reconstruction procedures, illustrate the differences between telescope configurations and describe our conclusions.
2 Shower and telescope simulation
As our goal is to determine the effect of energy measurement errors on the reconstructed UHECR energy spectrum we determine the EED in two ways: first, we only consider the errors that arise from natural shower fluctuations [11] and then we simulate the EED from fluorescence telescope measurements.
Our Monte Carlo air shower simulation was performed using the CORSIKA package [14]. Hadronic interactions were simulated using QGSJET01 [15]. Four sets of 2000 proton induced showers were simulated. Each set had a different primary energy which ranged from to eV with the index varying in steps of . The thinning factor was set to with a maximum weight factor of . The energy thresholds were set to 0.1 MeV for electrons and photons; 0.3 GeV for hadrons and 0.7 GeV for muons. The longitudinal particle and energy deposit profile were sampled in steps of 5 . Each set of 2000 showers were generated at fixed zenith angle of 60 degrees. Each shower was used several times by drawing a different zenith angle and shower core position in relation to the telescope.
Fluorescence telescopes were simulated according to the general procedure described in [16]. The simulation program was adapted to produce fluorescence photons from the energy deposited by the shower at each atmospheric depth. Photons were generated taking into account the energy deposition as a function of shower depth [17], and atmospheric pressure dependence [18]. These photons were then propagated from the emission point to the telescope. The attenuation due to Rayleigh (molecular) and Mie (aerosol) scattering was taken into account. Čerenkov light is not taken into account.
Characteristics of the fluorescence detection were simulated in detail. The effective collection area, mirror reflectivity, filter transmission and phototube quantum efficiency were included in the telescope efficiency. We assumed a 20% telescope efficiency for both Auger and HiRes-II. The telescope aperture, size of pixels in the camera, electronic noise and simplified trigger conditions were also simulated and are defined in section 3.1.
The Photo Multiplier Tubes (PMT) were then simulated. The number of photons per PMT was determined where both energy threshold and noise [19] were taken into account. The energy threshold was set as four times the background. The background is determined from stable sources of light that are present during data taking. It yields approximately 40 photons/m2degs [20].
3 Energy reconstruction
When charged particles transverse the atmosphere the rotational modes of nitrogen molecules are excited and fluorescence photons are emitted. Fluorescence telescopes detect these photons as a function of the atmospheric depth [21].
The number of fluorescence photons produced by an electron traveling in air is proportional to the electron energy deposition [17, 22]. As the particle’s energy as a function of its energy loss is known, the calorimetric energy of the shower is determined by the number of detected photons. The integration of the detected fluorescence light over the full shower path determines the total calorimetric energy of the shower. This energy plus the energy of particles that do not generate fluorescence light (denominated by missing energy) determines the total primary energy of the shower.
The missing energy is carried mainly by high energy muons which lose most of their energy to the ground and neutrinos. At ultra high energies, the correction to account for this energy [23, 24] is around 10% and has small deviations for different primary particles and shower inclinations. In our simulation we correct for the missing energy according to [23].
The determination of the shower longitudinal development requires a fit to the data. Not only the data is taken in discrete steps as the longitudinal development of the atmospheric shower is not always fully detected by the telescope. For the full evaluation of the shower longitudinal development, we use the Gaisser-Hillas function [25].
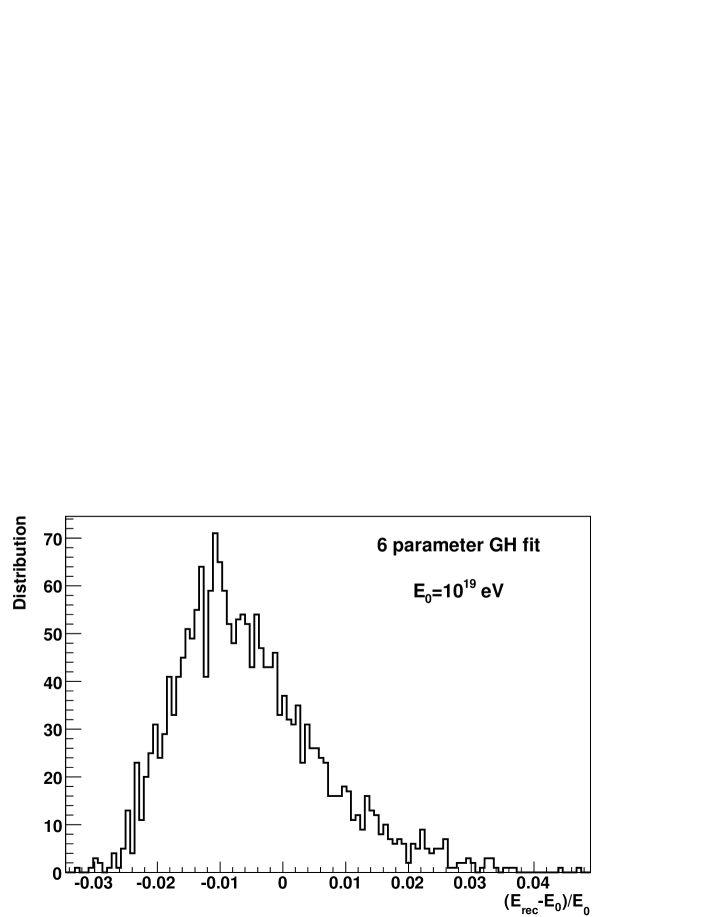
We first reconstructed the energy taking into account only natural shower fluctuations, that is, fluctuations that are intrinsic to the cascade of particles that constitute the shower [11]. We fitted the longitudinal energy deposition profile simulated by CORSIKA and sampled in 5 g/cm2 with a six parameters (, , , , and ) Gaisser-Hillas function:
| (1) |
where ; is the energy deposition at the depth where the shower has its maximum longitudinal size.
The energy of the primary particle was determined by the integration of the fitted Gaisser-Hillas function plus missing energy corrections.
Figure 1 shows the EED from 2000 simulated eV proton showers generated at a zenith angle of 60 degrees. At this level, there are three main contributions to the reconstructed energy error: a) air shower intrinsic fluctuations, b) fitting errors and c) missing energy corrections. The error distribution is very narrow, illustrating the effectiveness of the calorimetric procedure. The maximum energy error is of the order of 4%.
The influence of this EED in the energy spectrum is minimum and will be discussed in section 4.
3.1 HiRes-II and Auger Telescopes
The HiRes-II telescope covers in azimuth and an angle from to in elevation with a pixel size camera [26, 27]. It has a 5.1 m2 aperture [8] and is located at an altitude of 1597 m above sea level. We assume a 20% telescope efficiency.
The Pierre Auger Observatory uses both ground array and fluorescence techniques [10]. The energy spectrum in this experiment [28] is determined from events detected by its ground array calibrated by the energy measured by its fluorescence detectors. This calibration assumes a linear relation between the signal measured at 1000 meters (S1000) from the shower axis and the energy measured by the fluorescence telescope. The final EED that folds into the Auger spectrum is therefore a combination of the fluorescence telescope error with the ground array energy calibration.
Since the relation between S1000 and energy determined by the fluorescence telescopes must be fitted, systematic and statistical errors of both detector influences the final EED shape. However, it is clear that the energy scale of the Auger spectrum is dominated by the fluorescence telescopes systematic error and that the EED width is most influenced by the ground detector statistical error.
In this analysis we took into account the energy errors due to the fluorescence telescope. One of the four eyes used by the Auger Collaboration covering an angle from to in elevation with a pixel size camera [19] was simulated. The telescope has 10 m2 aperture and is located at an altitude of 1400 m above sea level. A 20% telescope efficiency was assumed.
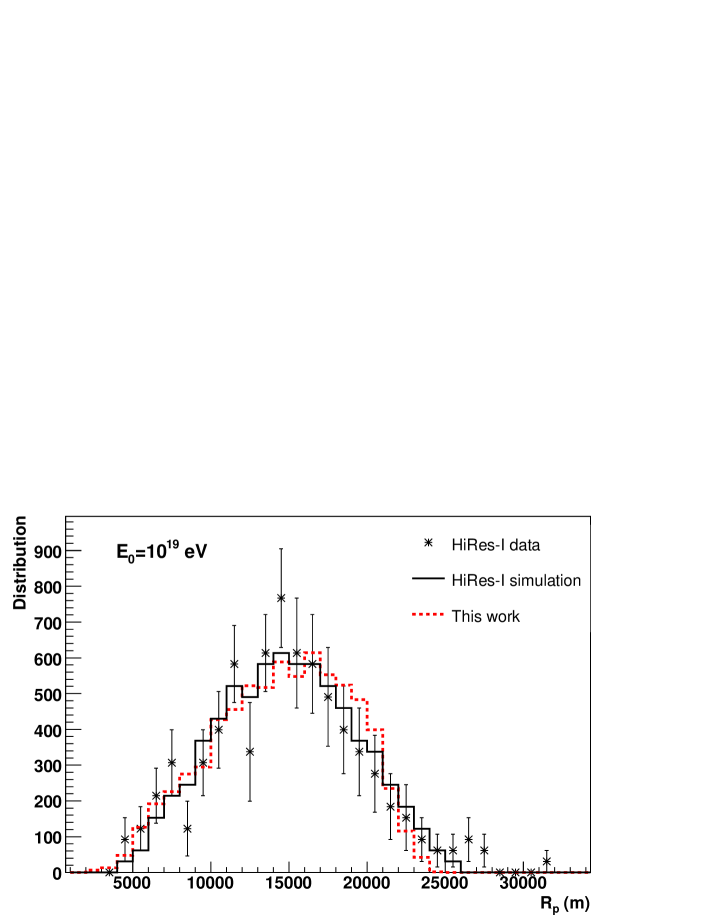
In order to test our simulation we determined the impact parameter from our fluorescence simulation222for this test we defined our simulation parameters as in HiRes-I [29]. and compared it with HiRes-I results [29]. Figure 2 shows a good agreement between our simulation and the HiRes Collaboration analysis.
Using the simulated signal in each PMT of the telescope we reconstructed the total energy of the shower. In this procedure, a Gaussian error was folded into the axis direction within the shower-detector plane in order to account for errors in the reconstruction of the shower axis. The sequence of hit PMTs was then transformed back into energy deposited in the atmosphere per path interval. Attenuation effects were taken into account using the new reconstructed shower direction.
The reconstructed energy deposited as a function of atmospheric depth was fit by a Gaisser-Hillas with two parameters ( and ) 333 was set to 70 g/cm2.. The reduced number of parameters is due to the reduced number of points measured by the telescope in comparison to the full longitudinal profile fit of section 3. The primary energy was then determined by adding the missing energy correction [23] to the integration of the Gaisser-Hillas function.
Quality cuts applied in the UHECR energy spectrum analysis by Auger [28] and HiRes [29] were included in our simulations. They are shown in Table 1. These cuts are applied in order to clean the data sample from events which do not allow a good energy reconstruction. Most of them have only few longitudinal data points or the is not visible.
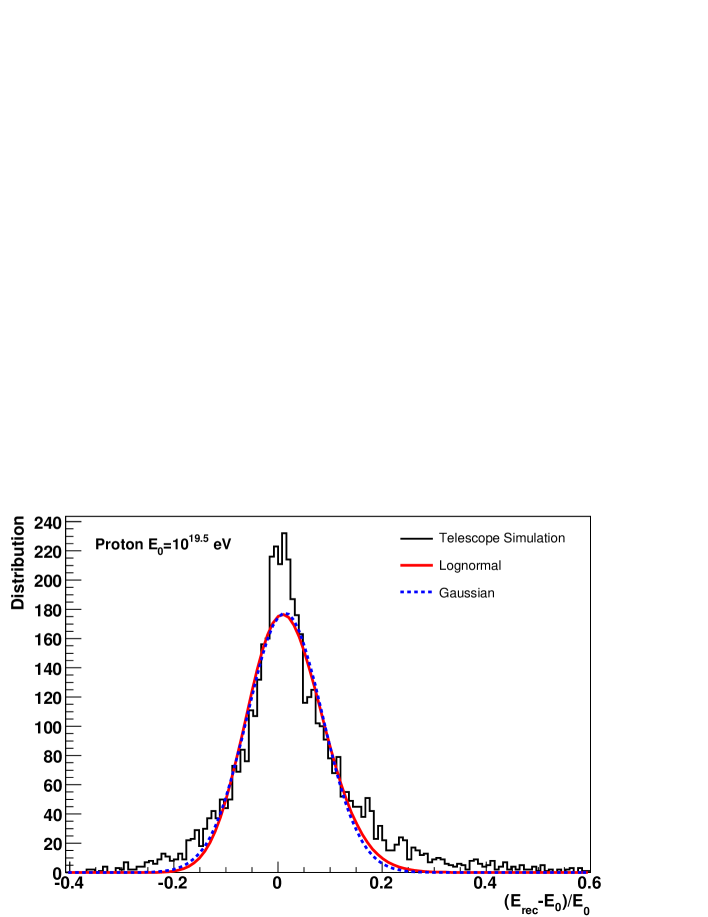
Figure 3 shows the EED for eV proton showers after our simulation of the HiRes-II telescope, reconstruction procedure and quality cuts. As expected this EED is much wider than the one shown in Figure 1 with an asymmetric tail to higher energies. The instrumental detection and energy reconstruction add sources of errors such as the shower axis geometry reconstruction, PMT noise, number of hit PMTs and telescope field of view. These uncertainties result in a more scarce sampling of the longitudinal profile. The contribution of each of these errors to the overall energy reconstruction is quite difficult to disentangle.
For comparison we fitted the EED shown in Figure 3 with a Gaussian and a lognormal curve. The Gaussian standard deviation () is 0.07 and the lognormal standard deviation of is 0.03 (from here on we will use this definition of the lognormal standard deviation). It is clear that neither of these curves represent well the fluorescence EED.
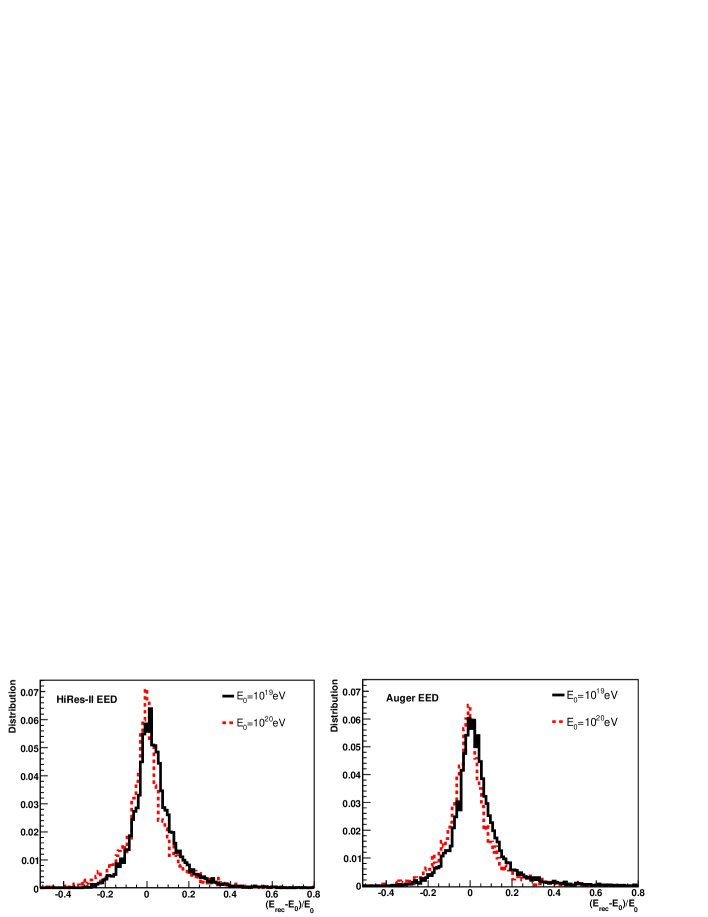
Figure 4 shows the EED for and eV proton showers after our simulation of both HiRes-II and Auger fluorescence telescopes, including energy reconstruction and quality cuts. It can be seen that the EED’s shape is different for each energy. In section 4.1 we discuss this energy dependence on the UHECR spectrum reconstruction.
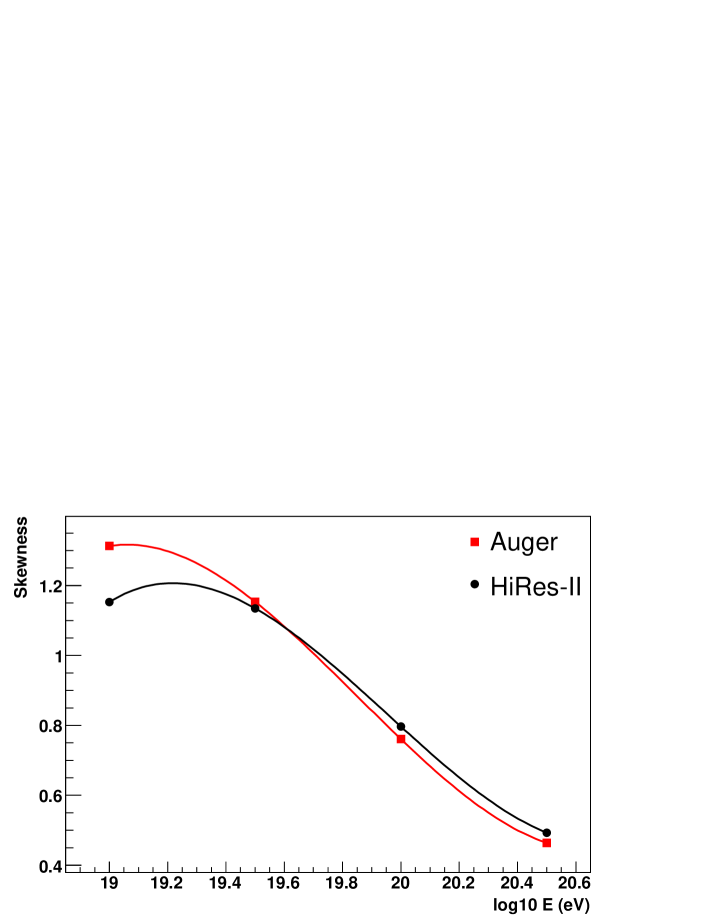
It is also clear that the asymmetric tail also varies with energy. In order to better represent this aspect we calculated the skewness of the EED as a function of energy. Figure 5 shows the skewness of the EEDs and Table 2 shows the EED’s average and RMS as a function of energy according to our simulation of the HiRes-II and Auger telescopes.
4 UHECR Energy Spectrum
The UHECR energy spectrum at the Earth was determined following the analysis described in [11]. Sources were isotropically distributed at different redshifts and produced a power law injection spectrum given by:
| (2) |
where is the cosmic ray energy, is a normalization factor, is the spectral index and is the maximum cosmic ray energy at the source. We set , eV and normalize the flux at eV as measured by HiRes-II [29]. Our conclusions are independent of [11] and is large enough to not interfere with our results.
Energy losses due to pair production, expansion of the universe and photo-pion production were included in the propagation of particles through the CMB [11]. The energy spectrum at Earth reproduces the expected GZK cutoff.
We took this UHECR energy spectrum as the true spectrum and convolved it with the EEDs determined from our simulation of fluorescence telescopes (described in section 3). As we did not find any good parameterization for the EED as a function of energy, we defined a Monte Carlo simulation procedure for the convolution. The UHECR flux was convoluted in the following way:
| (3) |
where F is given by Equation 2 and is the probability that a cosmic ray with energy has its energy reconstructed as . The energy E’ was randomly selected from the fluorescence EED.
To take into account the EED energy dependency, the fluorescence EED determined from eV showers was used to convolve the energy spectrum from below to eV; the EED from eV showers to convolve it from to eV and the EED from eV showers to convolve the spectrum range above . No unusual feature appeared in the spectrum due to the abrupt change of EEDs used in the convolution. In section 4.1 we will discuss the EED energy dependence on the UHECR spectrum reconstruction.
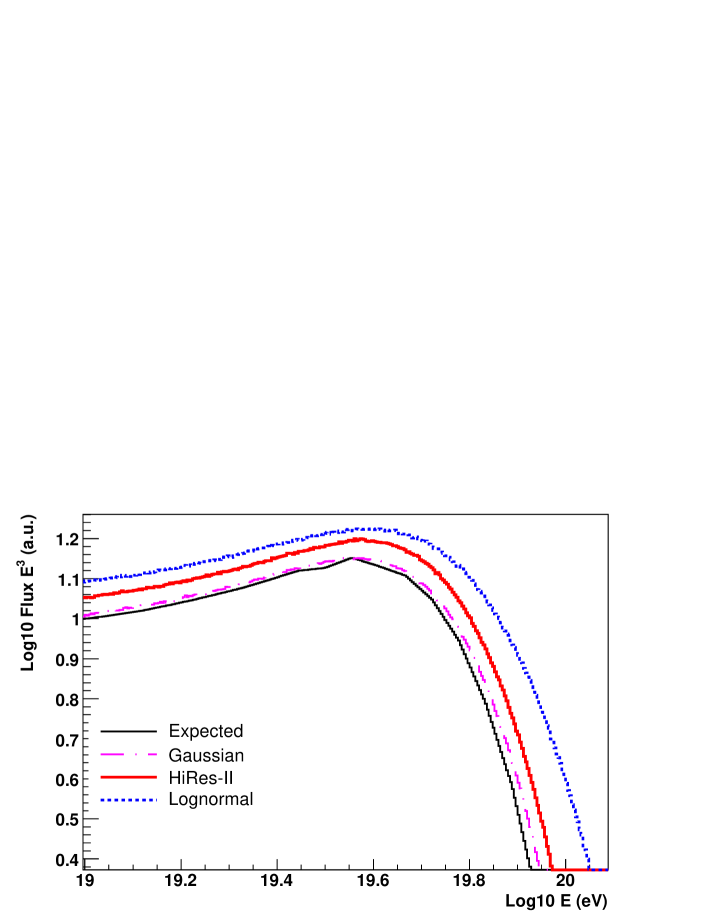
Figure 6 shows the UHECR convolved spectrum. The solid thin black line represents the true spectrum. The solid thick red line is the true spectrum convolved with the fluorescence EED from our simulation of the HiRes-II energy reconstruction. The convolution with the fluorescence EED determined by our simulation of the Auger telescope gives a very similar result. The dashed-doted magenta curve represents the Gaussian (with ) and the doted blue curve represents lognormal (with a standard deviation equal to 0.1) convolutions. The energy spectrum convolved with an EED determined only from intrinsic shower fluctuations (see section 3) is very close to the true spectrum and is not shown.
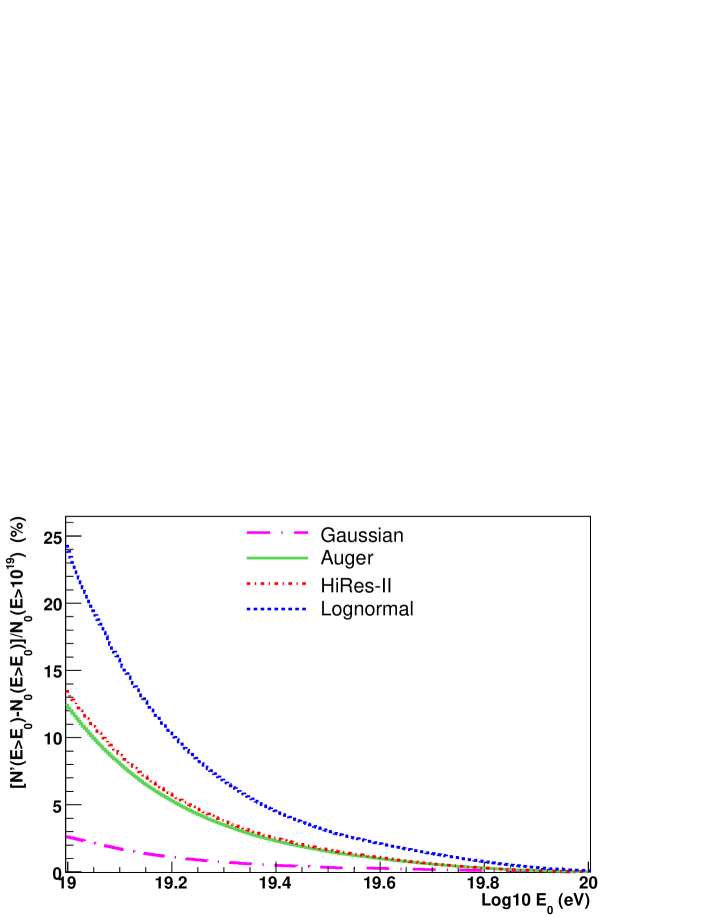
In order to understand the EED smearing of the spectrum we determined the excess of events of the convolved spectrum. Figure 7 shows the percentage excess of events determined from a spectrum convolved with different EEDs compared to the number of events above eV determined from the GZK theoretical prediction (our true spectrum). As can be seen, the excess of events is still significant around the expected GZK energy. Although fluorescence measurements errors will not erase the GZK cutoff from the spectrum they might shift its position.
The convolutions with the known Gaussian and lognormal EEDs as well as the excess of events shown in Figure 7 are for for the Gaussian and lognormal respectively. Although these are not representative of the simulated fluorescence EED we chose standard deviations for these fits close to the ones shown in Figure 3. Larger lognormal deviations [11] will smear the spectrum in a way that the GZK cutoff will not be seen.
4.1 EED energy dependence effect on UHECR spectrum
The EED energy dependence can be seen in Figures 4 and 5. In order to analyze the effect of this energy dependence on the UHECR spectrum, we convolved the full spectrum with a EED determined from showers generated with the same primary energy.
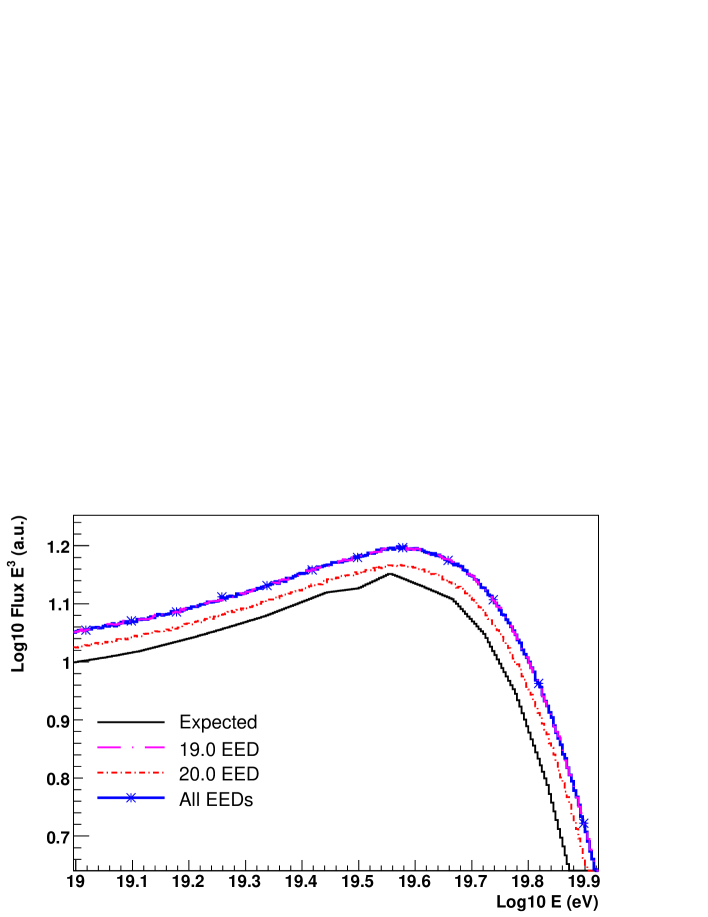
Figure 8 shows the spectrum convolved with EEDs from showers with and eV, as well as the spectrum convolved with all EEDs as described in section 4. It illustrates the difference in the analysis of the energy spectrum when the EED is evaluated at a single energy from the one when the EED energy dependence is taken into account.
It can be seen that the spectrum convolved with the eV EED falls on top of the spectrum convolved with an energy dependent EED. If however the convolution is done with the eV EED, the spectrum will differ from the one in which the EED energy dependence was taken into account.
As the UHECR is a steep falling spectrum the influence between different EEDs in the spectrum convolution is as expected. As the flux at eV is larger than at higher energies its influence on the spectrum convolution is also larger. The EEDs determined from higher energy showers, have smaller weight in the convolution and the UHECR spectrum will be significantly different than when the EED energy dependence is taken into account.
Another important aspect seen from the spectrum convolution with the eV EED is the effect of the EED shape. Even small differences in the shape of EEDs as those shown in figure 4 can significantly modify the energy spectrum (figure 8). The curve representing the spectrum convolution with an eV EED shows this effect.
4.2 Uncertainties on the Fluorescence Yield
The fluorescence yield (FY) of particles in air is an important parameter in the energy reconstruction procedure. The proportionality between the energy deposited by an electron and the number of photons produced per traveled distance is based on a few measurements [17, 22]. Recently, some new experiments have been proposed in order to measure the fluorescence yield in a wider energy range and different conditions including air pressure, composition and temperature [30, 31, 32, 33, 34, 35].
In order to analyze the effect of possible errors in the FY measurements in the determination of the spectrum we assumed an arbitrary FY systematic error in our simulation. This systematic error was introduced when the energy deposited in the atmosphere was transformed into fluorescence photons. We introduced a 10, 30 or 50% error in this transformation, that is, the number of photons produced in our simulation following [17] (FYK) was either increased or decreased by an arbitrary percentage. In the reconstruction procedure the original FYK [17] was used.
We would like to stress that a shift on the FY is not equivalent to a shift on the shower energy. When the number of produced photons along the shower development is changed, absorption effects and trigger efficiencies must be re-evaluated and the overall result is different from a simple systematic shift of the shower energy.
As a result of this analysis, the distribution of reconstructed energies was not only shifted to either larger or smaller energies but the shape of the EED was also modified. The mean of the EED will shift by approximately the same percentage as the FY.
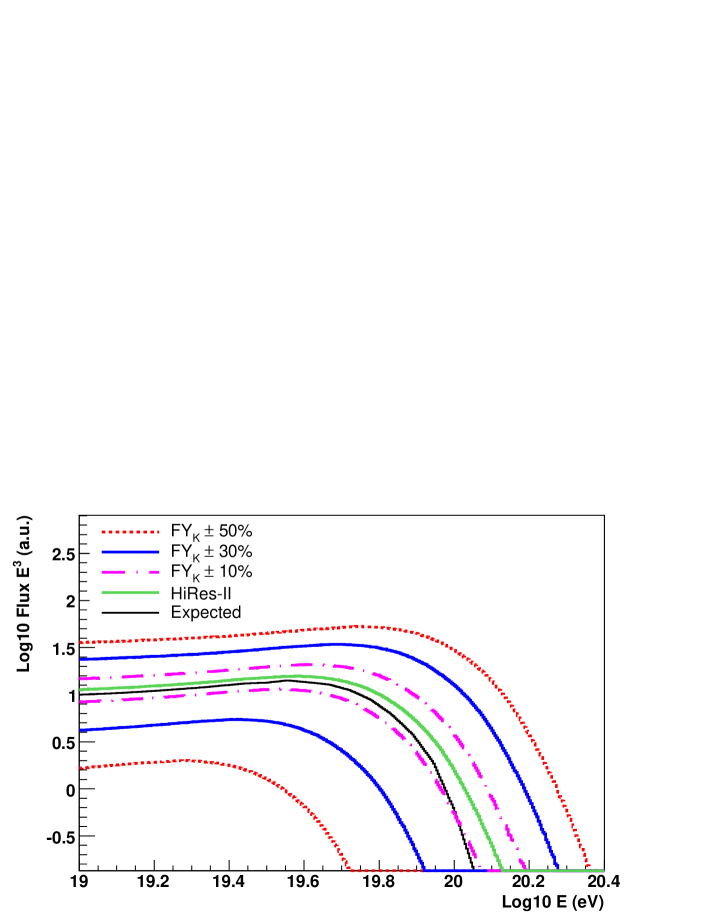
Figure 9 shows the UHECR spectrum convolved with the fluorescence EED taking FY errors into account. As can be seen the flux times the third power of energy shifts significantly. It shifts to larger values when the FY error is positive and in the opposite case, it shifts to lower values when the FY error is negative. The GZK cutoff is also smeared but not enough to be absent from the spectrum.
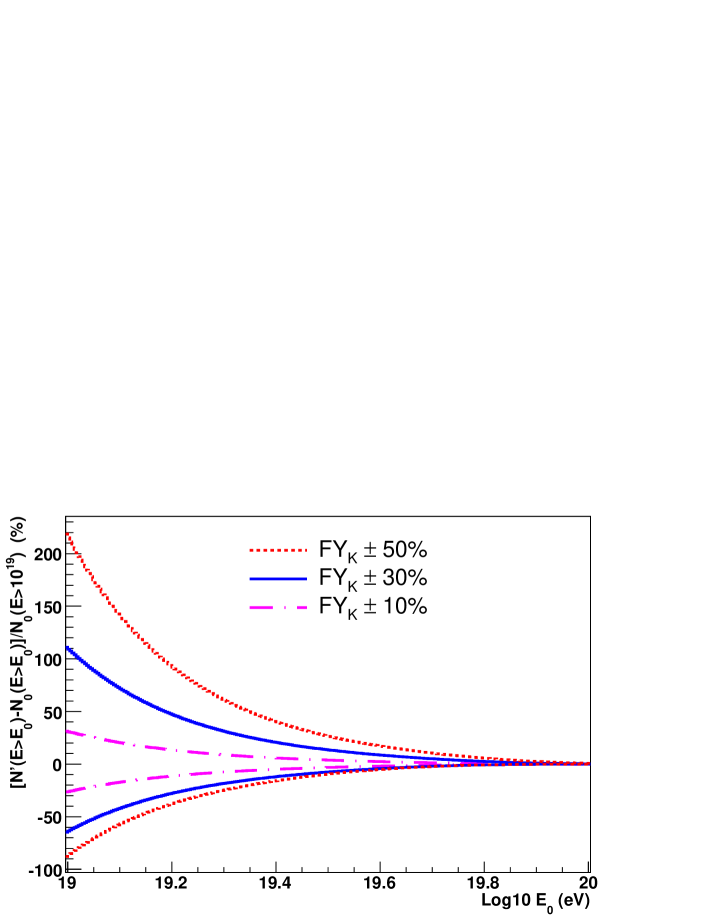
In order to analyze the effects of a FY systematic error on the spectrum, we determined the percentage excess of events in relation to the theoretical spectrum convolved with our simulation of the HiRes-II fluorescence telescope. Figure 10 shows the excess of events above a given energy normalized to the total number of events above eV. We considered positive and negative FY systematic error which corresponds respectively to a significant increase and decrease of the event flux up to energies around the GZK cutoff.
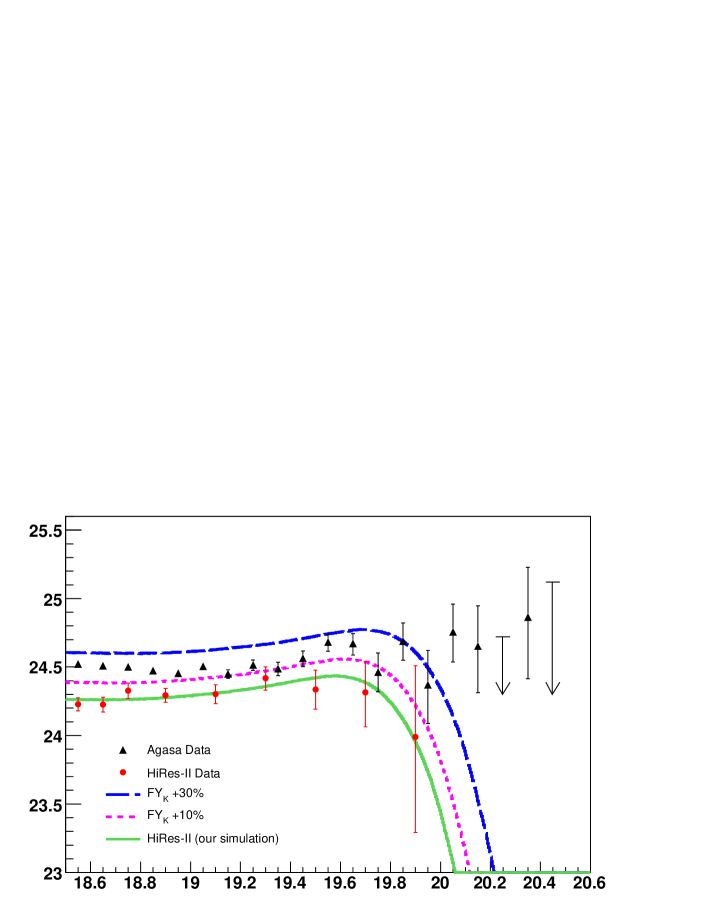
It is clear that an error on the FY will influence the determination of the GZK cutoff energy. The flux will also be affected by this error. Figure 11 shows the spectra measured by AGASA and HiRes-II experiments. We also show our calculation of the GZK theoretical spectrum convolved with the HiRes-II EED. We have considered three values of the fluorescence yield in this analysis: FYK (green solid line), FYK+10% (magenta dotted line) and FYK+30% (blue dashed line). It can be seen that a FY systematic error larger than 10% and smaller than 30% would be enough to match HiRes and AGASA fluxes but would not smear the GZK cutoff in an important way.
5 Discussion and conclusions
The influence of various fluorescence telescopes energy error distributions (EED) in the UHECR energy spectrum was determined through Monte Carlo simulations. We first analyzed the intrinsic and unavoidable atmospheric shower fluctuations. The energy errors that come exclusively from the determination of the energy from its longitudinal profile, the Gaisser-Hillas fit and missing energy corrections are smaller than 4%. We conclude that their effect on the energy spectrum – when the energy is determined through the longitudinal profile – is negligible.
Inclusion of detection and energy reconstruction simulation of fluorescence telescopes results in a considerable broadening of the EED (Figure 4). The simulated fluorescence EED can not be described by a Gaussian nor by a lognormal distribution. Moreover, the shape of the EEDs change with energy as shown by their skewness parameter (Figure 5).
We convolved the UHECR spectrum with fluorescence EEDs determined from four shower simulations with primary energies of or eV. These EEDs were generated simulating either the HiRes-II or the AUGER telescopes. Similar results were obtained for both telescopes despite the different quality cuts applied. The convolved spectrum changes in shape and flux as shown in Figure 6. In order to illustrate the EED’s effect on the spectrum around the GZK cutoff we determined the excess of events (in percentage) above a given energy. Figure 7 shows that this effect on the spectrum can result in 5% more events above eV.
We also investigated the importance of taking the EED energy dependence into account when convolving the energy spectrum. We conclude that the EED energy dependence does not need to be taken into account if the EED is determined from showers with primary energies that have the largest weight in the flux. As an example, if the EED is determined from eV, the smearing of the energy spectrum will be the same as if the energy dependence is taken into account. If however one convolves the spectrum with an eV EED, the convolved spectrum will be significantly different from the one which is convolved taking the EED energy dependence into account. This is shown in Figure 8.
One of the most fundamental parameters in the energy reconstruction is the fluorescence yield (FY). We have analyzed the influence of a systematic error in the FY on the energy spectrum. The production of fluorescence photons in our simulation was increased by an arbitrary factor while the FY in the reconstruction procedure was always fixed to the value determined by Kakimoto et al. [17]. As stressed in section 4.2, shifting the FY is not equivalent to an automatic shift in the reconstructed energy. Not only the average reconstructed energy shifts systematically by the same FY error factor as the EED has its shape modified. The smearing of the energy spectrum due to the FY errors is greatly enhanced when compared to the spectrum convolution with no FY errors.
Figure 9 shows the GZK spectrum convolved with the HiRes-II simulation which included FY errors of 10%, 30% and 50%. Spectrum convolutions with fluorescence EEDs that include positive FY errors are not symmetric in relation to the ones with negative FY errors. It is clear that the modulation of the spectrum is not symmetric from positive to negative FY errors.
We conclude that taking the FY errors into account moves the GZK significantly. The position of the GZK cutoff in the spectrum might be shifted to higher or lower energies depending on the sign of the FY error. Figure 10 shows that this error can result in significant increase or decrease of events depending on it’s sign. We also conclude that although the GZK cutoff position might shift significantly it will not be erased.
The measured flux is also directly proportional to the FY error. A error larger than 10% and smaller than 30% of the FY is enough to match the flux measured by the HiRes and the AGASA collaborations.
Finally, we conclude that the energy error distributions of fluorescence telescopes including shower fluctuations, detection and reconstruction uncertainties and fluorescence yield errors will significantly smear the UHECR energy spectrum. The GZK cutoff position in the spectrum might shift significantly but not enough to erase the GZK cutoff.
Acknowledgements – We thank Bruce Dawson for his comments. W.C. and V.S. are supported by the State of São Paulo Research Foundation (FAPESP).
References
- [1] K. Greisen, Phys. Rev. Lett. 16 (1966) 748.
- [2] G. T. Zatsepin, V. A. Kuz’min, ZhETF Pis’ma Eksp 4 (1966) 114.
- [3] G. T. Zatsepin, V. A. Kuz’min, JETP Lett. 4 (1966) 78.
- [4] P. Bhattarcharjee, G. Sigl, Origin and propagation of extremely high energy cosmic rays, Phys. Rept. 327 (2000) 109.
- [5] D. Chung, G. Farrar, E. Kolb, Phys. Rev. D 57 (1998) 4606.
- [6] I. Albuquerque, G. Farrar, E. Kolb, Phys. Rev. D 59 (1999) 015021.
- [7] J. Elbert, P. Sommers, Astrophys. J. 441 (1995) 151.
- [8] R.U.Abbasi, et al., Monocular measurement of the spectrum of UHE cosmic rays by the FADC detector of the HiRes Experiment, Astroparticle Physics 23 (2005) 157–174.
- [9] M. Takeda, et al., Phys. Rev. Lett. 81 (1998) 1163.
- [10] The Auger Collaboration, Properties and perfomance of the prototype instrument for the Pierre Auger Observatory, Nuclear Instruments and Methods in Physics Research A, 523 (2004) 50-95.
- [11] I. F. Albuquerque, G. F. Smoot, GZK cutoff distortion due to the energy error distribution shape, Astroparticle Physics 25 (2006) 75–379.
- [12] C. Escobar, L. G. dos Santos, R. Vazquez, The effect of non gaussian errors on the determination of steeply falling spectra (astro-ph/0202172).
- [13] D. D. Marco, P. Blasi, A. V. Olinto, On the statistical significance of the GZK feature in the spectrum of ultra high energy cosmic rays, Astroparticle Physics 20 (2003) 53–65.
- [14] D. Heck, J. Knapp, J. Capdevielle, G. Schatz, T. Thouw., A monte-carlo code to simulate extensive air showers - report FZKA 6019, Tech. rep., Forschungszentrum Karlsruhe, www-ik.fzk.de/h̃eck/corsika (1998).
- [15] N. N. Kalmykov, S. S. Ostapchenko, A. I. Pavlov, Nucl. Phys. B (Proc. Suppl.) 52B (1997) 17.
- [16] V. de Souza, G. Medina-Tanco, J. Ortiz, Acceptance of fluorescence detectors for photons and its implication in e nergy spectrum inference at the highest energies, Physical Review D 72 (103009).
- [17] F. Kakimoto, E. C. Loh, M. Nagano, H. Okuno, M. Teshima, S. Ueno, A measurement of the air fluorescence yield, Nucl. Instr. Meth. A (372) (1996) 527–533.
- [18] U.S. Standard Atmosphere, http://modelweb.gsfc.nasa.gov/atmos/us_standard.html (1976).
- [19] L. Prado Jr, et al., Simulation of the fluorescence detector of the Pierre Auger Observatory, Nuclear Instruments and Methods A 545 (2005) 632–642.
- [20] The Pierre Auger Collaboration, Desing report, Tech. rep., www.auger.org.
- [21] P. Sokolsky, P. Sommers, B. Dawson, Extremely high energy cosmic rays, Phys. Rept. 217 (1992) 225.
- [22] M. Nagano, K. Kobayakawa, N. Sakaki, K. Ando, New measurement on photon yields from air and the application to the energy estimation of primary cosmic rays, Astroparticle Physics 22 (2004) 235–248.
- [23] H. Barbosa, et al., Astroparticle Physics 22 (2004) 159–166.
- [24] C. Song, Z. Cao, B. R. Dawson, B. E. Fick, P. Sokolsky, X. Zhang, Energy estimation of UHE cosmic rays using the atmospheric fluorescence technique, Astroparticle Physics 14 (2000) 7.
- [25] T. K. Gaisser, A. M. Hillas, Reliability of the method of constant intensity cuts for reconstructing the average development of vertical showers, in: Int. Cosmic Ray Conf., Vol. 8, Plovdiv (Bulgaria), 1977, pp. 353–356.
- [26] T. Abu-Zayyad, et al., The prototype high-resolution Fly’s Eye cosmic ray detector, Nucl. Instr. Meth. A (450) (2000) 253.
- [27] J. Bellido, Anisotropy studies of the HiRes EHECR, Ph.D. thesis, University of Adelaide (December 2002).
- [28] The Pierre Auger Collaboration, First estimate of the primary cosmic ray energy spectrum above 3 EeV form the Pierre Auger Observatory, in: Int. Cosmic Ray Conf., 2005, usa-sommers-P-abs1-he14-oral.
- [29] R.U.Abbasi, et al., Measurement of the flux of ultrahigh energy cosmic ray from monocular observations by the High Resolution Fly’s Eye Experiment, Physical Review Letter 92 (15) (2004) 151101–1.
- [30] F. Arciprete, et al., AIRFLY: Measurement of the fluorescence yield in atmospheric gases, in: Proc. 29th Int. Cosmic Ray Conference, 2005, pp. cze–bohacova–M–abs1–he14–poster.
- [31] T. Waldenmaier, et al., Measurement of the air fluorescence yield with the airlight experiment, in: Proc. 29th Int. Cosmic Ray Conference, 2005, pp. ger–keilhauer–B–abs3–he15–poster.
- [32] G. Leufeuvre, P. Gorodetzky, P. Salin, Measurements of the absolute fluorescence yield in nitrogen between 0.5 and 2.3 MeV, in: Proc. 29th Int. Cosmic Ray Conference, 2005, pp. fra–lefeuvre–G–abs1–he15–poster.
- [33] E. Kemp, et al., Study of the fluorescence yield for electrons between 0.5 - 2.2 MeV, in: Proc. Int. Cosmic Ray Conference, 2003, p. 853.
- [34] F. Arqueros, F. Blanco, A. Castellanos, M. Ortiz, J. Rosado, The yield of air fluorescence induced by electrons, Astroparticle Physics 26.
- [35] The FLASH Collaboration, Measurement of pressure dependent fluorescence yield of air: Calibration factor for UHECR detectors, Astroparticle Physics 25.
| CUT | HiRes-II | Auger |
|---|---|---|
| Angular Speed | ||
| Triggered PMTs | ||
| Track Length ( elevation) | ||
| Track Length ( elevation) | ||
| Path Length | g/cm2 | |
| Zenith Angle | ||
| Minimum Viewing Angle | ||
| visible | visible | |
| (GaisserHillas fit) |
| Auger | HiRes-II | |||
|---|---|---|---|---|
| Mean | RMS | Mean | RMS | |
| 19.0 | 2.87% | 11.67% | 3.38% | 11.01% |
| 19.5 | 2.23% | 12.11% | 3.22% | 12.13% |
| 20.0 | -0.30% | 11.43% | 0.75% | 12.10% |
| 20.5 | -3.30% | 9.98% | -2.30% | 10.14% |