–
Metallicity distribution of Cen Red Giants based on the Strömgren metallicity index
Abstract
We adopted uvby Strömgren photometry to investigate the metallicity distribution of Cen Red Giant (RG) stars. We provided a new empirical calibration of the Strömgren metallicity index based on cluster stars. The new calibration has been applied to a sample of Cen RGs. The shape of the estimated metallicity distribution is clearly asymmetric, with a sharp cut-off at low metallicities ( -2.0) and a metal-rich tail up to 0.0. Two main metallicity peaks have been identified, around -1.9 and -1.3 dex, and a metal-rich shoulder at -0.2 dex.
keywords:
globular clusters: general — globular clusters1 Introduction
The intermediate-band Strömgren photometric system (Strömgren 1966; Crawford 1975) presents several indisputable advantages when compared with broad-band photometric systems such as the Johnson-Cousins-Glass (Cousins 1976). The key advantages of the Strömgren photometric system are: i) the possibility to provide robust estimates of intrinsic stellar parameters such as the metal abundance ( index, Anthony-Twarog & Twarog 2000, hereinafter ATT; Hilker 2000, hereinafter H00), the surface gravity ( index), and the effective temperature ( index, Nissen 1988; Olsen 1988; ATT). Furthermore, theoretical and empirical evidence (Stetson 1991; Nissen 1994; Calamida et al. 2005) suggest that the reddening free index is a robust reddening indicator for HB stars hotter than 8,500 K. ii) Accurate Strömgren photometry can be adopted to constrain the ensemble properties of stellar populations in complex stellar systems like the Galactic bulge (Feltzing & Gilmore 2000) and the disk (Haywood 2001). iii) Strömgren photometry has been recently adopted to investigate the membership and the metallicity distribution of RG stars in the Local Group dwarf spheroidal galaxy Draco (Faria et al. 2006). Moreover, Strömgren photometry it has also been adopted to remove the degeneracy between age and metallicity in stellar systems hosting simple stellar populations (globular clusters, elliptical galaxies) and to investigate age and metallicity distribution of dwarf elliptical galaxies in the Coma and Fornax clusters (Rakos & Schombert 2005). On the other hand, the Strömgren system presents two substantial drawbacks: i) the bands have short effective wavelengths, namely Å. As a consequence the possibility to perform accurate photometry with current CCD detectors is hampered by their reduced sensitivity in this wavelength region. ii) The intrinsic accuracy of the stellar parameters, estimated using Strömgren indicators, strongly depends on the accuracy of the absolute zero-point calibrations. This typically means an accuracy better than 0.03 mag. This limit could be easily accomplished in the photoelectric photometry era, but it is not trivial at all in the CCD photometry era. Moreover and even more importantly, current empirical calibrations of the Strömgren metallicity index are based either on field stars (Anthony-Twarog & Twarog 1998) or on a mix of cluster and field stars (Schuster & Nissen 1989; H00). However, empirical spectroscopic evidence suggest that field and cluster stars present different heavy element abundance patterns (Gratton, Sneden & Carretta 2004). Moreover, the occurrence of CN and/or CH rich stars in GCs (Grundahl, Stetson, & Andersen 2002, hereinafter GSA02) along the RG (H00), the subgiant and the main sequence (Stanford et al. 2004; Kayser et al. 2006) opens the opportunity of an independent calibration of the Strömgren metallicity index only based on cluster stars as originally suggested by Richtler (1989).
2 Calibration of the Strömgren metallicity index
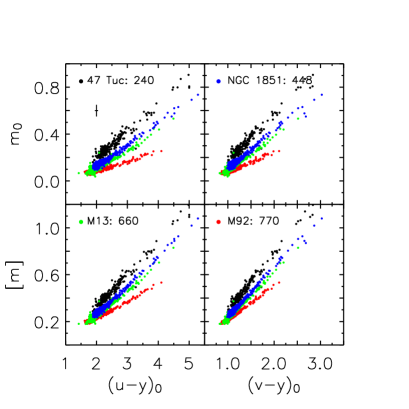
In order to calibrate the metallicity index we selected four globular clusters, namely M 92, M 13, NGC 1851, NGC 104, that cover a broad range in metallicity (), are marginally affected by reddening (), and for which accurate Strömgren photometry well-below the Turn-Off region is available. The photometry for these clusters was collected with the 2.56m Nordic Optical Telescope and with the Danish 1.54m Telescope. The reader interested in details of the observations, data reduction and calibration procedures is referred to Grundahl et al. (1999, GSA02) and to Calamida et al. (2005, 2007, in preparation). Empirical evidence suggests that the versus color relation of RG stars presents a linear trend and a good sensitivity to iron abundance (SN88; H00). Therefore, we selected cluster stars from the tip to the base of the RGB with a photometric accuracy 0.03 mag for each cluster in our sample. However, in order to avoid subtle systematic uncertainties in the empirical calibrations, current cluster RG stars need to be cleaned from the contamination of field stars. To accomplish this goal we decided to use optical-NIR color planes to split cluster and field stars. We cross-identified stars in common with our Strömgren catalogs and the Near-Infrared Two Micron All Sky Survey (2MASS) catalog (Skrutskie et al. 2006). We found that the best optical-NIR color-color plane to properly identify field and cluster stars is the . All cluster samples were reduced by 40% after the color-color plane selection. The reader interested in details concerning the cleaning procedures adopted is referred to Calamida et al. (2007). We derived new Metallicity-Index-Color (MIC) empirical relations that correlate the iron abundance of RG stars to their metallicity () and color () indices. Together with the unreddened index (, hereinafter ), we also derived independent empirical MIC relations for the reddening free parameter . This Strömgren index was adopted to overcome deceptive uncertainties in clusters affected by differential reddening. Fig. 1 shows the cleaned samples of candidate RGs for the four calibrating clusters in four different unreddened MIC planes. We assumed , , , adopting the reddening law from Cardelli et al. (1989) and . Reddening values for the selected clusters are from Harris (2003) and Schlegel et al. (1998). The error bars plotted in the top left panel display the photometric error budget for the unreddened color indices (, mag) and for the metallicity indices ( mag). Data plotted in Fig. 1 show two compelling empirical evidence: i) the relations are linear over a broad color range, namely and ; ii) the metallicity indices are well correlated with the cluster metal abundance, and indeed the four calibrating clusters present sharp and well-defined slopes. Hence, we applied a multilinear regression fit, by adopting cluster metallicities, to estimate the coefficients of the four MIC relations. Note that the metallicities adopted in the fit are in the Zinn & West (1984) scale and are based on the Calcium triplet measurements provided by Rutledge et al. (1997).
3 Metallicity distribution of Cen RGs
We applied the new MIC relations to estimate Cen RGs metal abundances. In order to verify the reliability of these estimates, we cross-correlated this sample with the high-resolution spectroscopy of 40 ROA stars by Norris et al. (1995), finding 26 common RGs. The difference between photometric metallicities estimated adopting the MIC relation and the spectroscopic measurements are plotted versus spectroscopic abundances in Fig. 2. The error bars plotted in the figure accounts for photometric and reddening uncertainties and spectroscopic measurement errors. The agreement between photometric and spectroscopic abundances is very good, with 0.3 dex for most of the stars, and the mean of the residuals is dex. However, seven RGs (marked with an asterisk) show systematic higher photometric abundances. We found that these stars are labeled as CN-strong stars in the list of Norris. Without taking into account these peculiar stars the dispersion of the residuals is 0.1 dex. Fig. 3 shows the metallicity distribution of selected Cen RGs, estimated adopting the MIC relation. The shape of the distribution is clearly asymmetric, with a sharp cut-off at low metallicities ( -2.0) and a metal-rich tail up to 0.0 dex. Two main metallicity peaks can be identified around -1.9 and -1.33 dex, and a metal-rich shoulder at -0.20 dex. Fig. 3 shows the best fitting curve to the distribution: given the non-gaussian shape the fit has been performed adopting a convolution of three gaussians. The three gaussian curves corresponding to different stellar groups are overplotted to the distribution. The figure shows that the dispersion of the metal-poor gaussian is 0.2 dex, accounting for the photometric and the reddening uncertainties. Moreover, the lack of a resolved metal-poor tail in our Cen metallicity distribution suggests that these stars could have formed in a chemically homogeneous environment, as already found by Norris et al. (1996) based on their spectroscopic RGs metallicity distribution. However, before we can reach firm conclusions concerning our metallicity distribution we still have to constrain on a quantitative basis the dependency of the photometric abundance estimates on the occurrency of CN and CH rich stars in Cen .


References
- [Anthony-Twarog & Twarog (1998)] Anthony-Twarog, B.J., & Twarog, B.A. 1998, AJ, 116, 1922
- [Anthony-Twarog & Twarog (2000)] Anthony-Twarog, B.J., & Twarog, B.A. 2000, AJ, 120, 3111 (ATT)
- [Calamida et al. (2005)] Calamida, et al. 2005, AJ, 634, L69
- [Cardelli et al. 1989] Cardelli, J.A., et al. 1989, ApJ, 345, 245
- [Cousins (1976)] Cousins, A. W. J. 1976, MNSSA, 35, 70
- [Crawford (1975)] Crawford, D. L. 1975, AJ, 80, 955
- [Faria et al. (2006)] Faria, D., et al. 2006, A&A, accepted, astro-ph/0611883
- [Feltzing & Gilmore (2000)] Feltzing, .S., & Gilmore, .G. 2000, A&A, 355, 949
- [Gratton, Sneden & Carretta (2004)] Gratton, R., Sneden, C. & Carretta, E. 2004, ARA&A, 42, 385
- [Grundahl et al. (1999)] Grundahl, F., et al. 1999, ApJ, 524, 242
- [Grundahl, Stetson, & Andersen (2002)] Grundahl, F., Stetson, P. B., Andersen, M. I. 2002, A&A, 395, 481
- [Haywood (2001)] Haywood, M. 2001, MNRAS, 325, 1365
- [Harris (2003)] Harris, W.E. 2003, http://physun.physics.mcmaster.ca/ harris/mwgc.dat
- [Hilker (2000)] Hilker, M. 2000, A&A, 355, 994 (H00)
- [Kayser et al. (2006)] Kayser, A., Hilker, M., Richtler, T., & Willemsen, P. G. 2006, A&A, 458, 777
- [Nissen (1988)] Nissen, P.E. 1988, A&A, 199, 146
- [Nissen (1994)] Nissen, P.E. 1994, RMxAA, 29, 129
- [Norris & Da Costa (1995)] Norris, J. E., & Da Costa, G. S. 1995, ApJ, 447, 680
- [Norris et al. (1996)] Norris, J. E., Freeman, K. C., & Mighell, K. J. 1996, ApJ, 462, 241
- [Olsen (1988)] Olsen, E.H. 1988, A&A, 189, 173
- [Rakos & Schombert (2005)] Rakos, K., & Schombert, J. 2005, PASP, 117, 245
- [Richtler (1989)] Richtler, T. 1989, A&A, 211, 199
- [Rutledge et al. (1997)] Rutledge, et al. 1997, PASP, 109, 907
- [Schlegel et al. (1998)] Schlegel, D.J., Finkbeiner, D.P., Davis, M. 1998, ApJ, 500, 525
- [Schuster & Nissen (1988)] Schuster, W. J., Nissen, P. E. 1988, A&AS, 221, 65 (SN88)
- [Schuster & Nissen (1989)] Schuster, W. J., Nissen, P. E. 1989, A&AS, 73, 225
- [Skrutskie et al. (2006)] Skrutskie, M.F., et al. 2006, AJ, 131, 1163, http://www.ipac.caltech.edu/2mass/releases
- [Stanford et al. (2004)] Stanford, L. M., Da Costa, G. S., Norris, J. E., Cannon, R. D. 2004, MemSAIt, 75, 290
- [Stetson 1991] Stetson, P.B. 1991, AJ, 102, 589
- [Stroemgren 1966] Stroemgren, B. 1966, Ann.Rev. A&A, 4, 433
- [Zinn & West (1984)] Zinn, R., & West, M. J. 1984, ApJS, 55, 45