The CoRoT exoplanet programme: exploring the gas-giant/terrestrial planet transition
Abstract
CoRoT, which was launched successfully on the 27th of December 2006, is the first space mission to have the search for planetary transits at the heart of its science programme. It is expected to be able to detect transits of planets with radii down to approximately two Earth radii and periods up to approximately a month. Thus, CoRoT will explore the hereto uncharted area of parameter space which spans the transition between the gaseous giant planets discovered in large numbers from the ground, and terrestrial planets more akin to our own. This papers briefly sketches out the main technical characteristics of the mission before summarising estimates of its detection potential and presenting the data analysis and follow-up strategy.
1. The CoRoT mission
1.1. Brief history
CoRoT (Convection, Rotation and Transits) is a modest scale satellite funded primarily by the French space agency CNES, with additional contributions from the European Space Agency (ESA), Belgium, Austria, Germany, Spain and Brazil. The project was first proposed to CNES as an asteroseismology mission in 1993. An exoplanet programme was added to the mission soon after the discovery of the first exoplanet around a Sun-like star (Mayor & Queloz 1995), and it soon became clear that a long baseline, high-precision stellar photometry mission had major potential in exo-planetology as well as in stellar structure and evolution (see Barge et al. 2006a). The new mission concept was formally selected by CNES in 2001, and CoRoT was launched on the of December 2006 after a successful development and integration phase.
1.2. The satellite and payload
The main technical characteristics of the mission, and in particular of the instrument, are described in detail in the CoRoT instrument handbook111See http://corotsol.obspm.fr/web-instrum/payload.param/. and the reference ESA Publication on the pre-launc status of the CoRoT mission (see Section 5.) and are thus only briefly sketched out here.
The payload consists of a 27 cm aperture afocal telescope equipped with an extremely high performance baffle to minimise straylight on the detector. The telescope feeds a focal plane unit of four pixel CCDs arranged in a square pattern, with a pixel scale of m, corresponding to arcsec on the sky. Two of the CCDs are dedicated to asteroseismology, and two to planet finding, giving rectangular fields of for each program (see Figure 1, left).
The asteroseismology CCDs are set slightly forwards of the focal plane to create a defocussed image, and are read in frame transfer mode every second. Up to 5 stars with apparent magnitudes in the range are monitored on each CCD, and their light curves are transmitted to the ground with 32 s sampling (1 s on request). In addition, up to six pixel windows can be transmitted to the ground every 32 s. The exoplanet CCDs are read every 32 s, and up to 6000 stars per CCD in the range are monitored. Because of telemetry limitations, aperture photometry is performed on-board and light curves with 512 s sampling are downloaded (32 s sampling is available for up to 500 stars per CCD). An objective prism inserted in the light path of the exoplanet CCDs gives rise to a very low-resolution spectrum at the location of each star (see Figure 1, right), allowing the generation of 3-colour light curves for up to 5000 stars with using appropriately positioned apertures. Small windows spread over the CCD are used in both fields to monitor the background level. The pointing of the satellite is adjusted based on astrometry from the asteroseismology channel.
CoRoT uses the multi-mission PROTEUS platform developed by CNES, which allowed for significant cost savings in the development phase. It was launched on the of December 2006 by a Soyuz II 1-b launcher from Baïkonour in Kazakhstan, into a polar orbit with an altitude of 896 km and a period of 6714 s.
1.3. Observing strategy
To keep scattered light to a minimum implies a Sun angle constraint which results in two 6-month continuous viewing zones of roughly diameter on opposite sides of the sky along the plane of the ecliptic. To maximise the number of targets available for planet finding, two ‘CoRoT eyes’ were selected at the intersections of the ecliptic and Galactic planes, one towards the Galactic centre (, ) and one towards the Galactic anti-centre (, ). CoRoT is restricted to point within these two eyes only.
After a commissioning phase lasting roughly one month, the first science observations will be in the Galactic centre direction, with an initial run lasting one month to six weeks. After that, CoRoT will start its regular observing pattern of observing one target field for 5 months continuously (long run), then switching to another field in the same eye for approximately 21 days (short runs), and then turning to face the opposite direction. This cycle will be repeated a minimum of 5 times during the mission lifetime, starting with the Galactic anti-centre direction in the spring of 2007.
The choice of each of the target fields for the long runs was a compromise between the needs of the asteroseismology and the exoplanet science programmes. Using GAUDI222See http://sdc.laeff.esa.es/gaudi/. (Solano et al. 2005), a database of all stars brighter than in the CoRoT eyes, promising targets for asteroseismology were identified as possible ‘primary targets’. The potential planet finding fields around each possible primary target (allowing for all rotations and translations of the detectors while keeping the primary target on the asteroseismology CCDs) were surveyed from the ground using multi-band optical photometry (Deleuil et al. 2006), combined with 2MASS, to evaluate the amount of reddening and the relative fraction of dwarf and giant or early type stars (the latter, which make an estimated 20% and 50% of the stellar population in the Galactic anti-centre and centre fields respectively, are not useful targets for transit finding). Also taken into account when selecting target fields were potential secondary targets for the asteroseismology fields and potential targets for additional programmes (see Section 4.) in both fields. The fields of the initial run and the first two long runs are listed in Table 1.
| Name | RA | Dec | Roll angle |
|---|---|---|---|
| [h m s] | [∘ ’ ”] | [∘] | |
| IR | |||
| LRc1 | |||
| LRa1 |
The choice of the target fields for the short runs is primarily driven by the requirements of the asteroseismology program (to ensure coverage of all the HR diagram), though a small number of short runs will be driven by the needs of the additional program.
2. Transit detection
The expected scientific performance of CoRoT from the exoplanet point of view is reported in Barge et al. (2006a). This section summarises the methods that are foreseen to be used to produce light curves and analyse them, and the results of simulations of the CoRoT fields which aim to give an estimate of the planet yield of the mission.
2.1. Light curve generation
The point spread function (PSF) in the exoplanet field is tear-shaped, owing to the presence of the prism in the optical path. It is strongly peaked at the red end and extended in the x- (East-West) direction. The exact PSF depends on the star’s temperature and position on the CCD, and the on-board software selects the most appropriate mask for each target from a set of 256 templates, based on an initial long-exposure image taken at the beginning of each run. Aperture photometry is then carried out by summing the flux in the pixels within the mask (see Figure 1, bottom right). To generate three-colour photometry, the mask is divided into three sub-masks and the columns falling into each of the sub-masks are summed separately. Binned averages from small background windows spread over each CCD are used to monitor the background level. Except for the 500 oversampled targets per CCD, the aperture photometry from 16 32 s exposures is summed on-board and individual light curve points are downlinked to Earth every 512 s. The raw data received from the satellite are labelled N0 data.
The data downlinked from the satellite (labelled N0 data) is further processed on the ground, first by a generic pipeline which corrects for anticipated astrophysical and instrumental noise sources and concatenates the photometry of each object into light curves (N1 data), and then by a pipeline specific to the exoplanet channel which is designed to correct for unanticipated noise sources identified from an ensemble analysis of the N1 light curves (N2 data). The N2 data are the science grade data on which all scientific analysis, including the transit detection, is performed. These data will typically be available a few months after the end of each run. However, a preliminary real-time analysis of the N1 light curves is carried out to detect interesting events (for example, events which could be transits of giant planets). The purpose of this ‘alarm mode’ is to provide a weekly update of the list of targets to be oversampled (i.e. targets for which data is downlinked to Earth every 32 rather than 512 s.)
2.2. Blind tests
The detection of transits in the CoRoT light curves, and particularly of shallow transits caused by terrestrial planets, is a challenging task. First one must minimise the impact of a number of high- and low-frequency noise sources affecting the light curves, which become important at the level of precision achieved with CoRoT. Data taken during passages through the South Atlantic Anomaly (SAA) unusable, and the light curves therefore contain a few gaps lasting approximately 10 min during each 24 h period. The data around these gaps are also affected by higher background noise level. Additionally, all stars are expected to display some degree of variability (micro-variability, associated with the rotational modulation and intrinsic evolution of surface features of magnetic or convective origin), which must be treated before the shallowest and most interesting transits can be detected.
In order to prepare for the analysis of the CoRoT light curves, the CoRoT Exoplanet Science Team (CEST) has conducted two blind tests. In both cases, a ‘game master’ generated a set of light curves including as many of the foreseen noise sources as possible, using a detailed model of the CoRoT instrument and the micro-variability models of Lanza et al. (2004) and Aigrain, Favata & Gilmore (2004). Simulated transit events and a range of astrophysical contaminants (events which mimic transits but are not of planetary origin) were then added some of the light curves before distributing them to the participating analysis teams, but the true content of the light curves was known only to the game master.
The first blind test (BT1, Moutou et al. 2005) was focussed on detection, and so a relatively large sample of light curves was generated with few containing transit-like events. Only white light light curves were simulated for this first exercise. Five teams took part (two from the Laboratoire d’Astrophysique de Marseille, one from Geneva Observatory, one from the Institute for Planetary research in Berlin and one from the Institute of Astronomy in Cambridge), and the main results of the exercise were the following:
-
•
Micro-variability can be filtered out relatively effectively without strongly affecting the transits by exploiting the distinct frequency signatures of the two types of signal: micro-variability is strongest on timescales of days and longer, while transits occur over timescales of minutes (ingress/egress) to hours.
-
•
A number of detection algorithms were tested, including matched filters, and cross-correlation methods, all of which were relatively successful, but the best performances in terms of sensitivity and false alarm rejection were obtained with algorithms based on least-squares fitting of box-shaped transits, such as the well-known BLS (Kovàcs, Zucker & Mazeh 2002).
-
•
No false alarms were reported by more than one team, highlighting the advantage of several teams working with different methods but sharing their results.
-
•
By tracing a line on a diagram of transit depth versus number of observed transits which separates events detected by most teams from events missed by most teams, a rough detection limit of was established. This dependence on is as expected if the number of observations per transit and the noise level per observation is roughly the same for all cases, although in reality a number of other factors, in particular star magnitude and activity level, also affect the detection limit.
The second blind test (BT2, Moutou & Aigrain 2007) was focussed mainly on discriminating between real transit events and transit-like events of stellar origin, often referred to as astrophysical false positives, and therefore a smaller number of light curves were generated but all contained a signal – transit or false positive. The transit or eclipse light curve alone does not enable the companion’s mass to be measured, and spectroscopic follow-up is always necessary to confirm the planetary nature of any candidate, but a significant fraction of the astrophysical false positives can be eliminated by a close inspection of the light curve, including the colour information.
An important aspect of BT2 was testing the use of the information which will be known about each target in advance as a result of the preliminary ground-based observations (see Section 1.3.). These observations provide a list of background stars which contribute some flux to the aperture of each target in the CoRoT fields, or ‘contaminants’. This information is stored, along with the results of other preliminary observations and, in the long run, the results of follow-up observations aimed at obtaining precise parameters for the host stars of the best planet candidates, in a dedicated database called EXODAT (Deleuil et al. 2006), which will be accessible to the scientist analysing the CoRoT light curves.
The exercise is still ongoing, but preliminary conclusions include:
-
•
Direct application of simple diagnostics to distinguish between planetary transits and stellar eclipses based on event duration (such as the parameter proposed by Tingley & Sackett 2005) or colour (assuming planetary transits are grey, whereas most stellar eclipses are not) can lead to the rejection of real transit events, and should be used with care.
-
•
Diagnostics using the presence of secondary eclipses or ellipsoidal variability are robust and can be used to distinguish some stellar binaries from planets.
-
•
Knowledge of the positions and colours of the ‘contaminants’ can be used along with the light curve (white light alone or including colour information) to identify many likely blended eclipsing binaries (stellar binaries whose signal is diluted by a third, constant light source and therefore resembles a planetary transit).
-
•
The most difficult type of false positive to identify from the light curves and contaminants information alone is the case of stellar eclipses with a small (M-type) secondary, but this type of system has a clear radial velocity signature easily identified from a few spectroscopic observations.
2.3. Estimating the planet yield and follow-up needs
The samples of planets and eclipsing binaries included in the blind tests were designed to contain examples of all the types of events expected, but were not intended to reproduce the real relative frequencies of the different events, or the incidence of transit-like event in the entire sample of light curves. Thus , they tell us what kind of events are detectable and characterisable, but not how many of them to expect.
CoRoTLux (Fressin et al. 2007) is a tool to evaluate the yield of transit surveys which simulates the entire stellar population observed (including background stars) based on standard Galactic models (Robin et al. 2003) and generates a population of eclipsing binaries and of planets using the most up-to date binarity and planet incidence statistics. It simulates light curves with realistic astrophysical and instrumental noise sources, after which a matched filter transit detection algorithm is used to evaluate the number of candidate transits expected. It can be applied to a number of ground or space-based surveys.
In the case of CoRoT, the Galactic model used is adjusted to match the star counts in EXODAT. Two sets of CoRoTLux simulations were carried out: one to investigate the yield of giant planets, for which the incidence and orbital period distribtions are relatively well known, and one to investigated the yield of ‘terrestrial’ planets (–), for which the incidence is unknown, but was assumed to be 5 times higher than that of the giants333The motivation behind this assumption is that less solid material is needed to form a terrestrial planet, and that rapid growth is less crucial than for a giant, which much reach the critical mass for runaway accretion before the gas in the proto-planetary disk disappears.. The results will be described in detail in a forthcoming paper (Fressin et al. in prep.), but preliminary indications are that CoRoT should detect giant planets per run and –4 terrestrial planets per long run, i.e. a total of giant planets and terrestrial planets. Approximately 100 transit candidates per long run are foreseen, of which the BT2 results to date suggest 50% may be identifiable as stellar events from the light curves and EXODAT information alone. The shallowest transits, which are potentially the most interesting, carry the highest follow-up cost, as the relative fraction of true transits to stellar mimics decreases strongly with decreasing transit depth.
3. Follow-up
Three main types of follow-up observations are foreseen:
-
•
Photometric follow-up, to obtain high spatial resolution images in- and out-of transit in order to identify which of the stars falling in the CoRoT aperture is being eclipsed, and thus what is the true (undiluted) depth of the event. As the PSF of CoRoT is large, 1 m class telescopes should suffice to obtain a significant resolution improvement. Among the facilities foreseen for this follow-up are the 80 cm telescope at Observatorio del Teide in Tenerife, and the Euler telescope in La Silla.
-
•
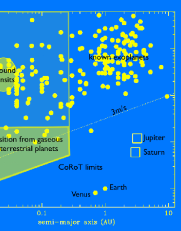
Radial velocity follow-up, to measure the companion mass. To make optimal use of the available facilities, a progressive strategy is foreseen, involving initial follow-up wit FLAMES in Paranal for the fainter objects and, for the brighter candidates, with CORALIE in la Silla, SOPHIE at the Observatoire de Haute Provence, and the 2 m telescope at the Thüringer Landessternwarte Tautenburg. The best low radial velocity amplitude candidates will then be targeted with HARPS in la Silla. As illustrated on Figure 2, CoRoT’s detection capabilities are particularly well-matched to the world-leading radial velocities currently available;
-
•
High-resolution spectra of the host stars, using e.g. UVES on the VLT, to derive accurate physical parameters (for confirmed candidates only).
To ensure prompt confirmation of transit candidates, the activities of the four CEST teams in charge of light curve analysis, photometric follow-up, radial velocity follow-up and stellar parameter determination will be co-ordinated by a small team which will regularly re-analyse the available data for each candidate in real time and review the candidate priority rankings for each type of follow-up. Once candidates are confirmed, further follow-up of the giant planets is foreseen using space based facilities, with the goal of obtaining extended baseline and improved precision light curves (HST: improved radii, search for other non-transiting planets by transit timing, search for rings and moons, oblateness measurements) and detecting secondary eclipses in the infrared (Spitzer: surface temperature measurement and atmospheric studies).
4. The additional program
Although primarily driven by asteroseismology and exoplanet detection, CoRoT also accomodates an additional program, that includes all scientific use of CoRoT data for purposes outside the core program areas of exoplanet detection in the exoplanet field and asteroseismology in the asteroseismology field. Thus, exoplanet detection in the asteroseismology field and asteroseismology in the exoplanet field, as well as any other analysis of CoRoT light curves (rotation, activity, flaring, eclipsing binaries) fall under the additional program.
Through yearly Announcements of Opportunity (AOs), members of the astronomical community at large in the participating countries (including all ESA member states) can propose either to systematically analyse core program data for scientific purposes outside the core program, or to observe specific targets in the CoRoT fields. Additionally, a small number of short runs will be driven primarily by the additional program. One such run is foreseen on the NGC 2264 star forming region. The AO for the first year of CoRoT operations is past, but an announcement for the second year is foreseen early in 2007.
5. Conclusions
CoRoT is the first space mission dedicated to exoplanet detection, and the first project capable of detecting transits of terrestrial planets. While stopping short of detecting habitable planets, its capabilities will enable it to explore for the first time the uncharted transition regime between the giant and terrestrial planets found in our own system.
Prompt follow-up is expected to enable the confirmation of the first candidate planets from the initial run and the first long run (alarm mode) by the summer of 2007. As shallow transits will be detectable only in the full long run N2 data, the first of which are expected around August 2007, the first confirmed terrestrial planets are expected in the spring of 2008. The CoRoT light curves will be come public one year after their release to the Co-Is, i.e. approximately 15 months after the end of each run.
For more information, the reader is referred to the following sources:
-
•
the official CoRoT website: http://corot.oamp.fr;
-
•
The CoRoT mission: pre-launch status – Stellar seismology and planet finding: ESA-SP 1306, eds. M. Fridlund, A. Baglin, L. Conroy & J. Lochard (2006)444Available on request from M. Fridlund, malcolm.fridlund@esa.int.;
-
•
for information on the additional program:
http://ams.astro.univie.at/?s=space;corotAPWG.
Acknowledgments.
The contents of this paper are the result of contributions from all members of the CoRoT community, and in particular from the CoRoT Exoplanet Science Team.
References
- Aigrain, Favata & Gilmore (2004) Aigrain, S., Favata, F. & Gilmore, G. 2004, A&A, 414, 1139
- Barge et al. (2006a) Barge, P., Léger, A., Ollivier, M., Rouan, D., Schneider, J. and the Exoplanet CoRoT Team 2006, in The CoRoT mission: pre-launch status, eds. M. Fridlund, A. Baglin, L. Conroy & J. Lochard, ESA-SP 1306, 83
- Barge et al. (2006a) Barge, P., Moutou, C., Léger, A., Bordé, P., Rouan, D., Pont, F., Guillot, T., Aigrain, S., Deeg, H., Erikson, A., Queloz, D., Rauer, H. and the Exoplanet CoRoT Team 2006, in The CoRoT mission: pre-launch status, eds. M. Fridlund, A. Baglin, L. Conroy & J. Lochard, ESA-SP 1306, 419
- Deleuil et al. (2006) Deleuil, M., Moutou, C., Deeg, H. J., Meunier, J. C., Surace, C., Guterman, P., Almenara, J. M., Alonso, R., Barge, P., Bouchy, F., Erikson, A., Léger, A., Loeillet, B., Ollivier, M., Pont, F., Rauer, H., Rouan, D. & Queloz, D. 2006, in The CoRoT mission: pre-launch status, eds. M. Fridlund, A. Baglin, L. Conroy & J. Lochard, ESA-SP 1306, 341
- Fressin et al. (2007) Fressin, F., Guillot, T., Morello, V. & Pont, F. (2007), A&A, submitted
- Kovàcs, Zucker & Mazeh (2002) Kovàcs, G., Zucker, S. & Mazeh, T. 2002, A&A, 399, 369
- Lanza et al. (2004) Lanza, A. F., Rodonò, M. & Pagano, I. 2004, A&A, 425, 707L
- Mayor & Queloz (1995) Mayor, M. & Queloz, D. 1995, Nature, 378, 355
- Moutou et al. (2005) Moutou, C., Pont, F., Barge, P., Aigrain, S., Auvergne, M., Blouin, D., Cautain, R., Erikson, A. R., Guis, V., Guterman, P., Irwin, M., Lanza, A. F., Queloz, D., Rauer, H., Voss, H. & Zucker, S. 2005, A&A, 437, 355
- Moutou & Aigrain (2007) Moutou, C. & Aigrain, S. 2007, in Transiting Extrasolar Planets, eds. C. Afonso, D. Weldrake & T. Henning, ASP Conf. Ser. in press
- Robin et al. (2003) Robin, A. C., Reylé, C., Derrière, S. & Picaud, S. 2003, A&A, 409, 523
- Solano et al. (2005) Solano, E., Catala, C., Garrido, R., Poretti, E., Janot-Pacheco, E., Gutiérrez, R., González, R., Mantegazza, L., Neiner, C., Fremat, Y., Charpinet, S., Weiss, W., Amado, P. J., Rainer, M., Tsymbal, V., Lyashko, D., Ballereau, D., Bouret, J. C., Hua, T., Katz, D., Lignières, F., Lüftinger, T., Mittermayer, P., Nesvacil, N., Soubiran, C., van’t Veer-Menneret, C., Goupil, M. J., Costa, V., Rolland, A., Antonello, E., Bossi, M., Buzzoni, A., Rodrigo, C., Aerts, C., Butler, C. J., Guenther, E. & Hatzes, A. 2005, AJ, 129, 547
- Tingley & Sackett (2005) Tingley, B. & Sackett, P. D. 2005, ApJ, 627, 1101