Evolution of stellar-gaseous disks in cosmological haloes
Abstract
Aims. We explore the growth and the evolution of the bar instability in stellar-gaseous disks embedded in a suitable dark matter halo evolving in a fully consistent cosmological framework. The aim of this paper is to point out the impact of different gas fractions on the bar formation, inside disks of different disk-to-halo mass ratio, and the role of the cosmological framework.
Methods. We perform cosmological simulations with the same disk-to-halo mass ratios as in a previous work where the gas was not taken into account. We compare results of the new simulations with the previous ones to investigate the effect of the gas by analysing the morphology of the stellar and gaseous components, the stellar bar strength and the behaviour of its pattern speed.
Results. In our cosmological simulations, inside dark-matter dominated disks, a
stellar bar, lasting 10 Gyr, is still living at even if the gaseous fraction
exceeds half of the disk mass. However, in the most massive disks we find a
threshold value (0.2) of the gas fraction able to destroy the bar.
The stellar bar strength is enhanced by the gas and in the more massive
disks higher gas fractions increase
the bar pattern speed.
Key Words.:
galaxies: spirals, structure, evolution, halos, kinematics and dynamics1 Introduction
In a pioneering paper Berentzen et al. (1998) presented the numerical results describing the impact of a gas fraction inside a stellar disk on the stellar orbits and on the whole bar instability. Their model galaxy containing stars and gas was compared with a pure stellar model, subject to the same initial conditions, chosen to produce the development of a strong stellar bar.
They showed that dynamical instabilities become milder in the presence of the gas component, and therefore a weakening of the bar itself is observed as a gradual process. Moreover, the overall evolution is accelerated because of the larger central mass concentration and the resulting decrease in the characteristic dynamical time.
The gas behaviour in disk galaxies and its connections with the bar feature was
studied in several papers (
Friedli & Benz (1993); Fux (1999); Berentzen et al. (2001); Athanassoula (2002);
Bottema (2003); Bournaud et al. (2005), Michel-Dansac & Wozniak (2006), Stinson et al. (2006)).
However in all these works
the evolution of the disk or of the disk+halo simulated system arises in a isolated framework,
outside the cosmological scenario, even if progressive efforts
for improving the model, accounting for more recent knowledges coming from
the cosmological
hierarchical clustering scenario of structures formation about
density distribution and concentration of the dark matter (DM) halos,
have been performed in
the last years (Curir & Mazzei (1999); Mazzei & Curir (2001); Athanassoula & Misiriotis (2002)).
Here, for the first time, we analyse the growth and the evolution of the bar
instability in stellar-gaseous disks embedded in a DM halo evolving in a
fully consistent cosmological scenario.
Our model cannot be viewed as a general galaxy evolution model, since the
gradual formation and growth of the stellar disk has not been taken into
account.
Thus our work cannot be compared with the more recent papers by
Abadi et al. (2003), Governato et al. (2004), Robertson et al. (2004), Sommer-Larsen et al. (2006) where
the formation of a realistic disk galaxy within the hierarchical scenario of
structure formation in -dominated cosmologies has been followed
self-consistently.
However our approach allows us to vary parameters like the
disk-to-halo mass ratio and the gas fraction inside the disk, and to
analyse the growth of the bar instability and its dependence on such parameters
in a self-consistent cosmological framework for the first time.
Following the pioneering study by Berentzen et al. (1998), we compare the results of
such new set of simulations with those of a previous set (Curir et al., 2006)
including a
pure stellar disk in the same scenario
and with the same initial conditions.
The plan of the paper is the following: in Section 2, we summarise
our recipe for the initial system fully described in Paper I.
In Section 3 we present the cosmological simulations and in Section 4 we point
out our results.
Section 5 is devoted to our discussion and conclusions.
2 Method
We embed a gaseous and stellar disk inside a cosmological halo selected in a suitable slice of Universe and follow its evolution inside a cosmological framework: a CDM model with 0.3, 0.7, 0.9, 0.7, where is the total matter of the Universe, the cosmological constant, the normalisation of the power spectrum, and the value of the Hubble constant in units of 100 km s-1Mpc-1.
A detailed description of our method to produce the cosmological scenario where the disk is evolved has been given in Curir et al. (2006). Here we present a short overview of our recipe. Moreover, Curir et al. (2006) showed that the numerical resolution does not impair their main result: in pure stellar disks, long living bars are a ’natural’ outcome of the cosmological scenario.
2.1 The DM halo
To select the DM halo, we perform a low-resolution simulation of a “concordance” CDM cosmological model. The initial redshift is 20.
From this simulation
we identify the DM halos at z=0 in the mass
111In the following, we refer to the mass as
the virial mass i.e. that enclosed in a sphere with overdensity
(Navarro et al., 2000). range
0.5- 51011h-1 M with a standard
friends-of-friends algorithm.
We select one suitable DM halo with a mass
M1011 M⊙ (at z=0). We
resample it with the multi-mass technique
described in Klypin et al. (2001). The particles of the DM halo, and those
belonging to a sphere with a radius Mpc, are followed
to their Lagrangian position and re-sampled to an equivalent resolution of
1024 3 particles.
The total number of DM particles in the high resolution region
is which corresponds to a DM mass resolution of
1.21 .
The high-resolution DM halo is followed to the redshift z=0.
After selecting the halo and resampling at the higher resolution
the corresponding Lagrangian region, we run the DM simulation, to extract
the halo properties in absence of any embedded stellar disk.
The mass of our halo at z=0,
M⊙, corresponds to a
radius, Kpc, which entails
84720 halo particles.
The nearest DM halo
222Halos have been identified
using the friends of friends algorithm with a linking length , i.e.
the mean
interparticle distances, and with more than 8 particles
more massive than is
Kpc away from the centre of our halo;
the less massive one, having mass of ,
is Kpc away. Moreover, the behaviour of
the density contrast, , is
monotonically decreasing with the radius, and falls below the
unity value at
physical Kpc away from the centre of our
halo at , , and respectively.
Therefore, we conclude that the selected halo is living in an
underdense environment.
From its accretion history (see Fig. 1 in Curir et al. (2006)) we conclude that our halo undergoes no
significant merger during the time it hosts our disk, nor immediately before.
The halo density profile is well–fitted by a Navarro, Frenk and White
(NFW) form (Navarro et al. (1996); Navarro et al. (1997))
at . The concentration, , equal to
333 We note, however, that
is defined against , the radius enclosing a sphere with overdensity equal to
200 times the critical density of the Universe, and not against as here;
therefore, in our cosmological model, it is always .
At our halo has
, takes an high value, 18.1, confirming that this halo does “form”
at quite high redshift ( e.g. Wechsler et al. (2002) for a discussion about
the link between concentration and assembly history of the halo).
The dimensionless spin parameter of the halo
is 0.04 at z=2, near to the average one for our cosmological
model (Maller et al., 2002).
2.2 The baryonic disk
The spatial distribution of particles follows the exponential surface density law: where is the disk scale length, Kpc, and is the surface central density. The disk is truncated at five scale lengths with a radius: Kpc. To obtain each disk particle’s position according to the assumed density distribution, we used the rejection method (Press et al., 1986). We used 56000 star particles and 56000 gaseous particles to describe our disk. The (Plummer equivalent) softening length, the same for DM, gas, and star particles, is in comoving coordinates. The stellar radial velocity dispersion, , is assigned through a Toomre parameter Q. Q is initially constant at all disk radii and it is defined as , where is the epicyclic frequency, and the surface density of the disk. We plug a value of Q: 1.5, which corresponds to a warm disk. The gas particles share the same velocity field as the stars. The constraint where , needed for the gaseous disk stability (Friedli & Benz, 1993) is always verified.
We embed the disk in the high resolution cosmological simulation, at redshift 2, in a plane perpendicular to the angular momentum vector of the halo and in gravitational equilibrium with the potential. Its centre of mass corresponds to the the minimum potential well of the DM halo. The initial redshift corresponds to 10.24 Gyr down to in our chosen cosmology.
3 Simulations
We performed eight cosmological simulations of a disk+halo system. We also performed one simulation in an isolated framework, using a NFW halo, to disentangle the effects of the dynamical state of the halo, and in particular of the evolutionary framework, on the growth of the bar instability (§ 4.1). We exploited the public parallel N-body treecode GADGET-2 (Springel, 2005).
The simulations run on the SP4 and CLX computers located at the CINECA computing centre (BO, Italy; grant inato003) and on OATo Beowulf-class cluster of 32 Linux-based PC (16 processor AMD K7, clock 700 MHz, and 16 Pentium 4, clock 1700 MHz) at the Osservatorio Astronomico di Torino.
| N | Mdisk | gas fraction | MDM | RDM | halo | ||
|---|---|---|---|---|---|---|---|
| c1 | 0.33 | 0.1 | 0.64 | 1.94 | 1. | 1.08 | cosmological |
| c2 | 0.33 | 0.2 | 0.64 | 1.94 | 1. | 1.08 | cosmological |
| c3 | 0.33 | 0.4 | 0.64 | 1.94 | 1. | 1.08 | cosmological |
| c4 | 0.1 | 0.1 | 0.64 | 6.4 | 0.9 | 1.68 | cosmological |
| c5 | 0.1 | 0.2 | 0.64 | 6.4 | 0.9 | 1.68 | cosmological |
| c6 | 0.1 | 0.4 | 0.64 | 6.4 | 0.9 | 1.68 | cosmological |
| c7 | 0.1 | 0.5 | 0.64 | 6.4 | 0.9 | 1.68 | cosmological |
| c8 | 0.1 | 0.6 | 0.64 | 6.4 | 0.9 | 1.68 | cosmological |
| i1 | 0.33 | 0.95 | 2.87 | 0.85 | 1.5 | NFW |
I col: simulation number and simulation type (c: cosmological simulation,
i: isolated simulation)
II col: mass of the disk in code units (i.e. )
III col: fraction of gas, i.e. gas–to–disk mass ratio
IV col: DM mass inside the disk radius in code units
V col: halo–to–disk mass ratio inside the disk radius
VI and VII cols: Efstathiou et al. (1982) parameters: , is
the maximum rotational velocity, the corresponding radius
VIII col: type of halo used
| N | MDM | RDM | Qb | amax | bulge | bars in bars | |
|---|---|---|---|---|---|---|---|
| c1 | 0.77 | 2.39 | 0.68 | 0.43 | 8.4 | y | n |
| c2 | 0.78 | 2.4 | 0.1 | 0.01 | n | n | n |
| c3 | 0.78 | 2.4 | 0.07 | 0 | n | n | n |
| c4 | 0.73 | 7.43 | 0.58 | 0.32 | 5.8 | n | y |
| c5 | 0.73 | 7.44 | 0.6 | 0.3 | 5.4 | n | n |
| c6 | 0.73 | 7.56 | 0.46 | 0.23 | 5.6 | n | n |
| c7 | 0.73 | 7.6 | 0.46 | 0.2 | 5.4 | n | n |
| c8 | 0.73 | 7.6 | 0.42 | 0.21 | 5.8 | n | n |
| i1 | 1. | 3.03 | n | n | n | n | n |
I col: simulation number and simulation type
II col: DM mass inside the disk radius in code units
III col: halo–to–disk mass ratio inside the disk radius
IV col: maximum ellipticity at z: strong
bar (Mazzei & Curir, 2001) require
V col: bar strength according to Combes & Sanders (1981); stronger bars
correspond to higher Qb values
VI col: major axis (physical Kpc) corresponding to the maximum bar strength
VII col: morphology of the inner region of the disk
VIII col: peculiar features inside the disk
The main parameters and the initial properties of our set of simulations are listed in Table 1.
A global stability criteria for the stellar bar instability in a disk galaxy is the one analysed in Efstathiou et al. (1982). In such a paper the parameters and (where is the maximum value of the disk rotational curve, the corresponding radius, and is the disk mass) have been defined. Efstathiou et al. (1982) stated the criterion over the range for a disk being stable to bar formation. The values of these parameters are reported in Table 1. Simulation i1 corresponds to the evolution of the same disk as in simulation c2 but we embedded it in a NFW halo with the same virial mass and particle number as in our cosmological halo at z=0 (see Curir et al. (2006) for more details). Such a halo is spherical, isotropic and in gravitational equilibrium. The procedure used to construct this halo is described by Hernquist (1993).
All the results in Table 1 can be compared with those of the homologous simulations performed with a pure stellar disk, presented in Curir et al. (2006). We repeated, indeed, one of the simulation of Curir et al. (2006) with the GADGET-2 code, since the time–stepping criterion we used is not present any more in the current version of the code. A comparison with the previous run does not show any significative change. In such a paper we also performed several numerical tests on the stability of the results. Here we summarise our findings:
-
•
a simulation performed with a mass resolution increased by a factor , i.e. with a force resolution increased by a factor (for a disk–to–halo mass ratio 0.1; see section A.2 in Curir et al. 2006), gives rise to a long living bar (10 Gyr old) as in the case of the lower mass and force resolution; note that in this test the mass and force resolution are respectively and pc, thus comparable to the resolution of recent works on galaxy formation simulations, e.g. (Sommer-Larsen et al., 2006; Stinson et al., 2006; Governato et al., 2006);
-
•
embedding adiabatically a classically stable stellar disk in a isolated DM halo having a NFW profile, while keeping the mass and force resolution constant, brings to no bar instability, thus ruling out the possibility that the embedding procedure is the main driver of the bar instability (see Section 5 in Curir et al. 2006);
-
•
varying the stellar softening, at fixed mass resolution, from 0.36h-1Kpc to 0.65h-1Kpc does not result in any significant changes as far as the bar instability is concerned (see section A.3 in Curir et al. 2006);
-
•
the same holds when the stellar mass resolution is reduced by a factor of 1/6 and increased up to 10 times the value adopted in our set of simulations (see A.2. in Curir et al. 2006).
These results guarantee that, in the dynamical range currently reached with tree–code N–body simulations, no mayor numerical shortcoming is expected, at least under the point of view of the gravitational evolution. Moreover, as a final test, we re-run simulation c2 using two times more gaseous particles, 112000 instead of 56000. We find that the final bar dissolution and the gas inflow are the same as in the previous case.
4 Results
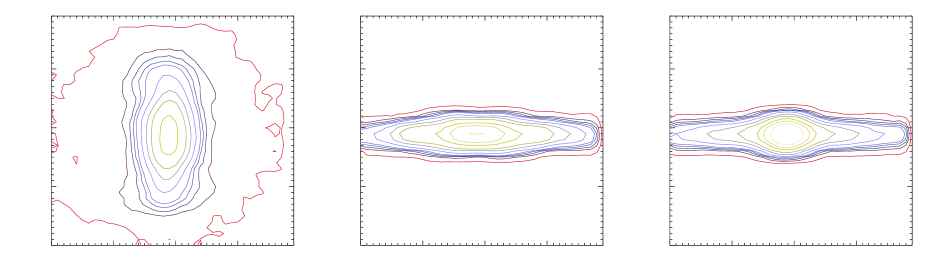
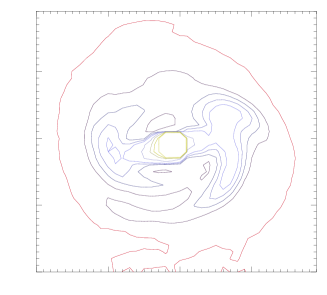
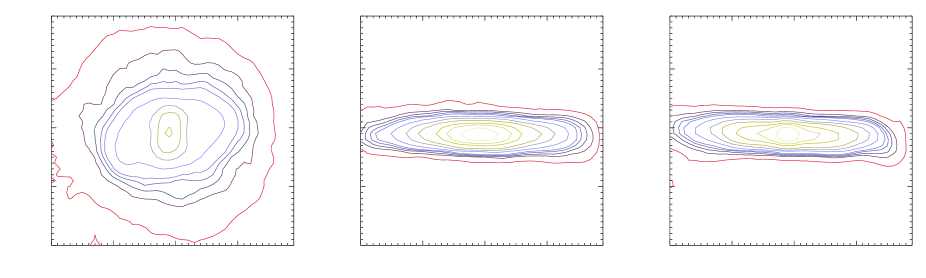
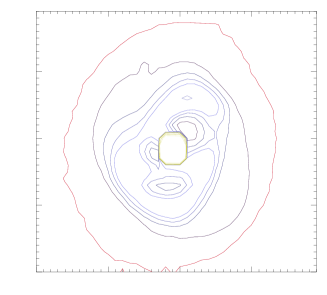
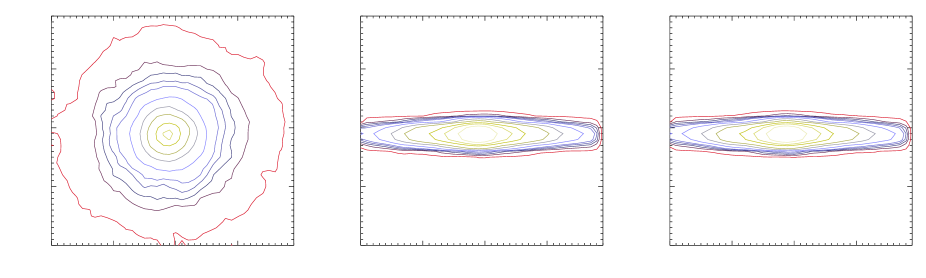
In this section we present the final ( i.e. at z=0)
isodensity contours for stars and gas of simulations in Table
1. All such figures have been built up with the same
box-size, number of levels, and density contrast (see caption of Fig.
1).
We define as a measure of the bar strength the value of
the ellipticity, (Table 2);
a strong bar corresponds to .
A more dynamical measure of the bar strength at radius R has been defined by Combes & Sanders (1981) by using the parameter: where is the maximum amplitude of tangential force at a given radius R and is the mean axisymmetric radial force derived from the component of the gravitational potential at the same radius. The maximum value of provides a measure of the bar strength for the whole galaxy. We evaluated the components of the gravitational force directly from the masses and the radii of the system produced by the simulations. We then represented the matrix on a suitable two dimensional grid in analogy with the method outlined by Buta & Block (2001). Naming the maximum value of in quadrant k of the map, according with Buta & Block (2001), we define:
We listed the final values of the parameter in Table 2. The values of the bar strength derived with both methods are consistent.
In all our cosmological simulations, with the exception of simulations c2 and c3, a stellar bar is still living at z=0.
4.1 Star and gas morphologies
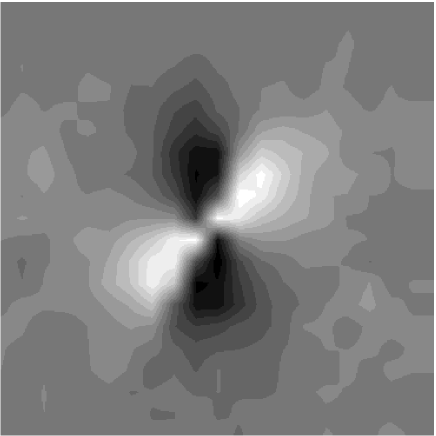
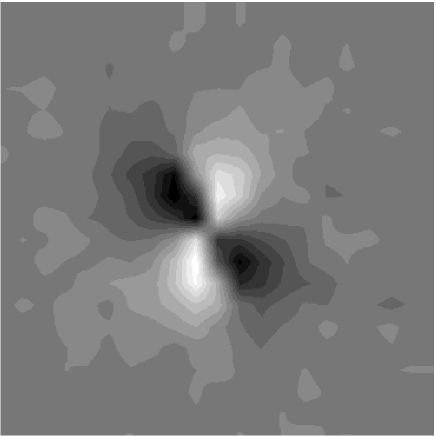
The strongest and the longest bar arises from simulation c1 (Fig. 1). In this case, the “geometrical” strength of such a bar, namely the ellipticity, , evaluated through the isodensity plots, is higher (0.68) than the one measured in the homologous case (0.52, Curir et al. (2006)). The strength measured through the parameter is also higher than the corresponding one in the non-dissipative homologous case as shown in Fig. 2 which compares the maps of final values of the stellar bars. The enhancement of the stellar bar strength is due to the gaseous bar which is superimposed, i.e coupled, to the stellar one along all the evolution. (see Fig. 1, bottom panel).
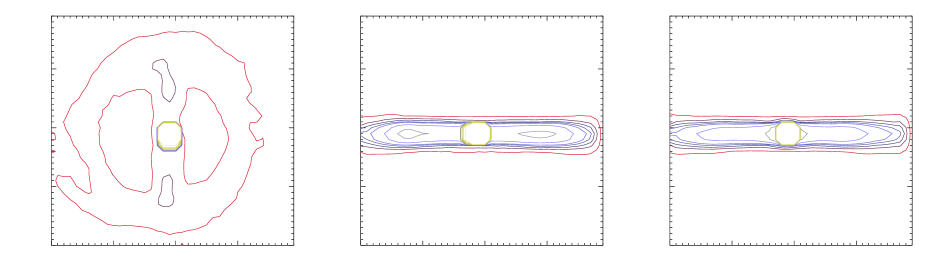
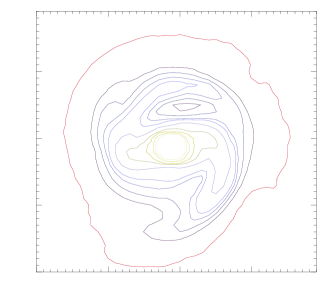
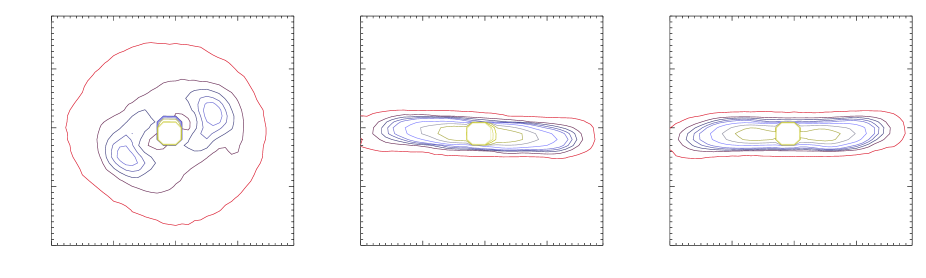
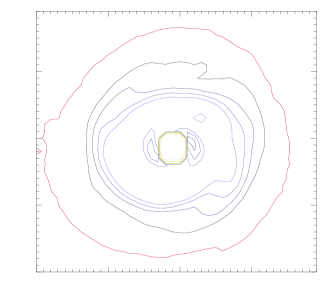
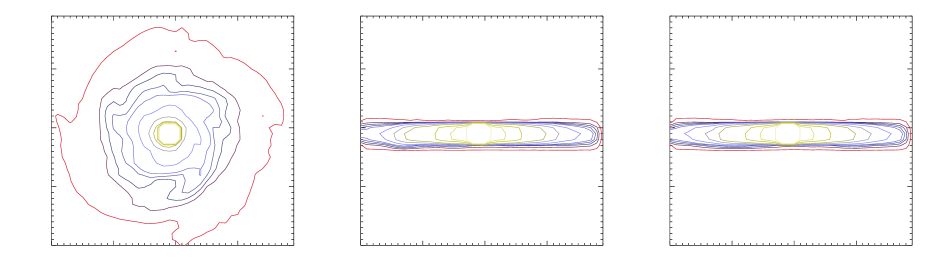
In the simulation c2, the gas develops a ’grand-design’ spiral structure, more evident than in simulation c1 (Fig. 3). Such an effect can contribute to destroy the stellar bar, in agreement with recent findings by Bournaud et al. (2005). In the same simulation, c2, the gas produces a barred feature from the earlier stages, lasting until . After such a redshift, the gaseous central condensation contributes to the bar destruction, according to the claim of Berentzen et al. (1998). These authors show that the growth of a gas mass concentration in the disk dissolves the regular orbits in the stellar bar. In such a simulation, the stellar bar decreases its strength and disappears completely at , whereas in the c3 case, which corresponds to a larger initial gas fraction, the bar disappears at . Fig. 4 shows the gas and star morphologies of simulation c2 at z=0.
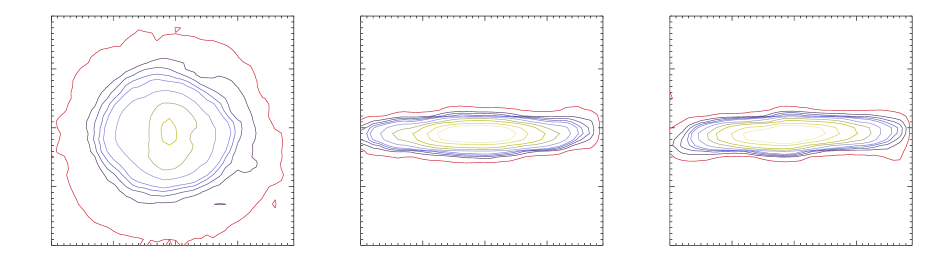
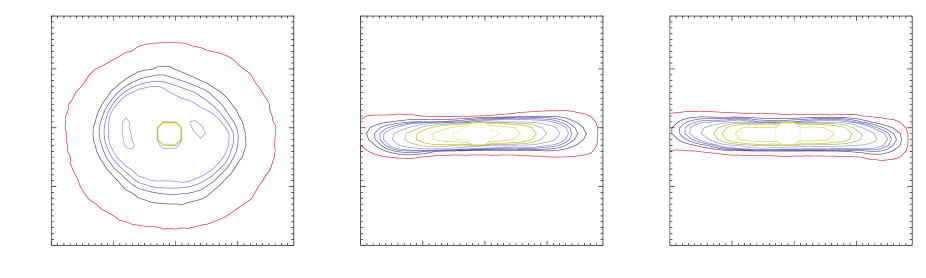
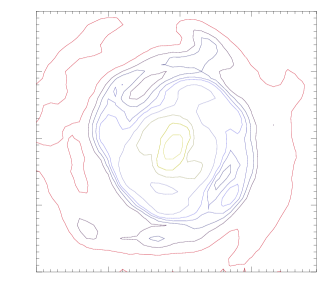
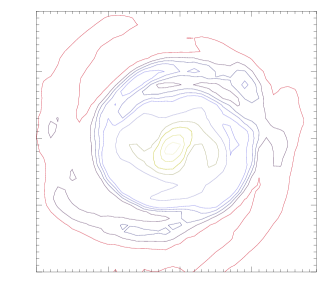

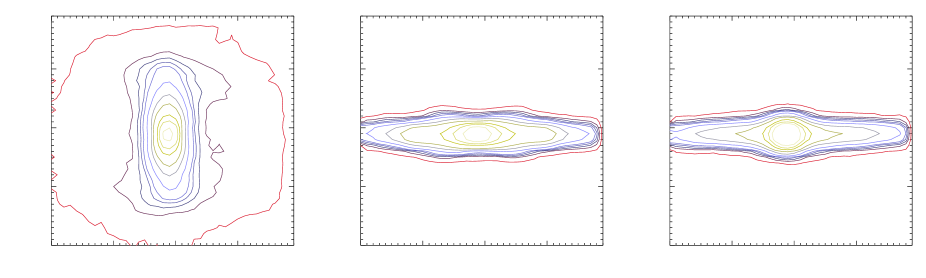
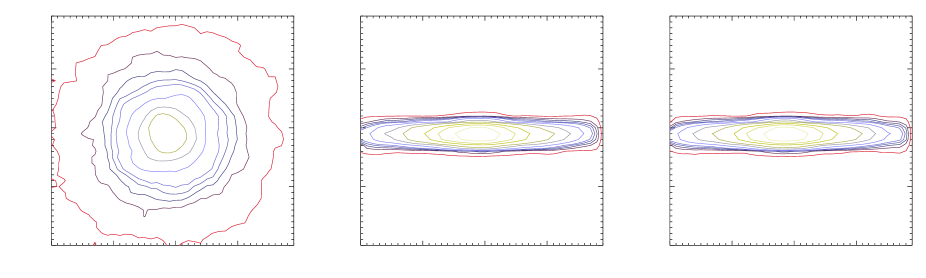
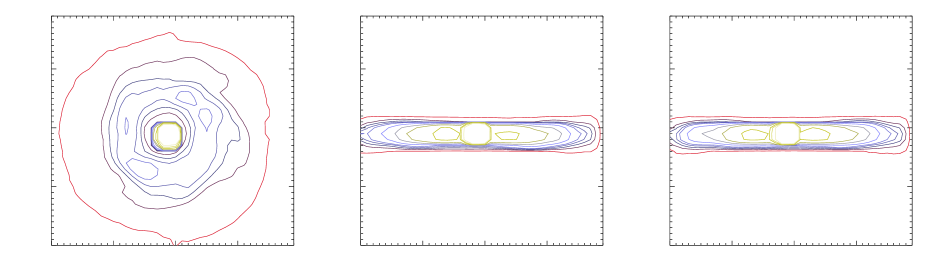
Simulation c4 shows a stronger stellar bar than in Curir et al. (2006) ( ellipticity 0.58 from Table 2 instead of 0.3 from their Table 3) and bar-in bar features along the whole evolution until z=0 (see Fig. 5). Simulations from c5 to c8, which correspond to increasing gas fractions, show the same but less enhanced features during the system evolution, so that at z=0 no bar-in-bar appear, and for simulation c8 (Fig. 6) the final bar is the weaker one. In this set of DM dominated disk simulations, the action of the increasing gas mass is not enough to destroy the bar. We note that, also in these cases, the gaseous bar is coupled with that of the stars from the beginning, however simulations with the larger gas fraction restore the gaseous disk earlier, so that gas and star distributions decouple from z=1 (Fig. 7).
In Fig. 8 we show the behaviour of the ellipticity and of the as a function of the increasing mass fraction in disks of different masses. It is remarkable the agreement we recover between the trends: the dynamical evaluation of the bar strength and the geometrical evaluation of it through ellipticities.
Fig. 9 compares the gas and star morphologies of the non-cosmological simulation, i1, with those of the homologous non-dissipative case (simulation i4 in Tables 2 and 3 of Curir et al. (2006)) after 10.24 Gyr. In simulation i1 the bar forms approximately at the same time as in the pure stellar case. However the presence of the gas destroys the bar after 7.5 Gyr instead of 8.3 Gyr as in simulation c2. Thus the cosmological framework fuels a longer living bar, moreover, when the disk–to–halo mass ratio is 0.33, in such a framework we find a critical value of the gas fraction, 0.2, able to destroy the bar.
In the case of DM dominated disks, all the simulations here performed show a bar feature still present at z=0. This is enhanced for the lower gas percentage, 0.1, and slightly weakened for the higher ones, compared with the corresponding no dissipative case (Curir et al., 2006), but the bar cannot be destroyed by the gas presence.
4.2 Mass inflow and circular velocities
The gas, initially distributed over all the disk surface with the same density distribution as the stars, evolves by increasing its concentration depending on the disk-to halo mass ratio and on its initial mass fraction. Both such parameters affect the life and the strength of the bar, as discussed above.
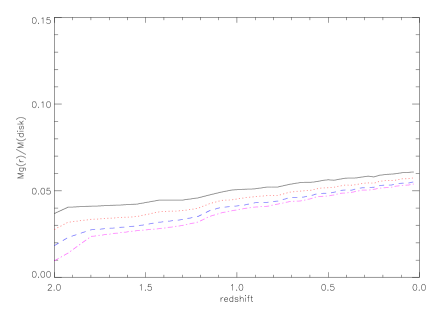
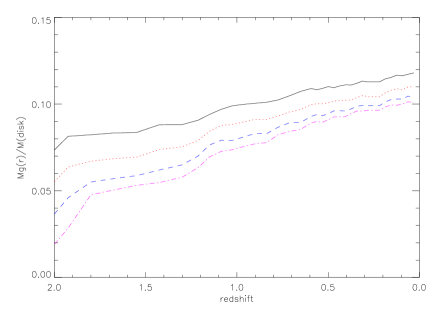
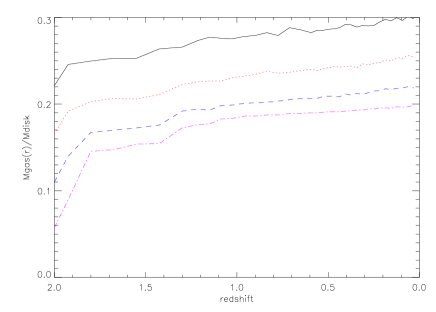
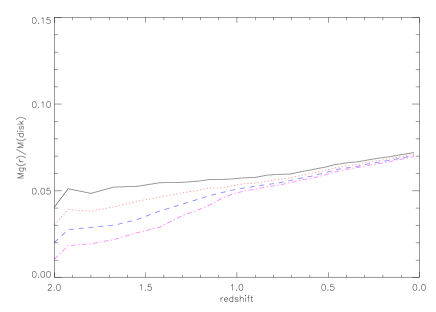
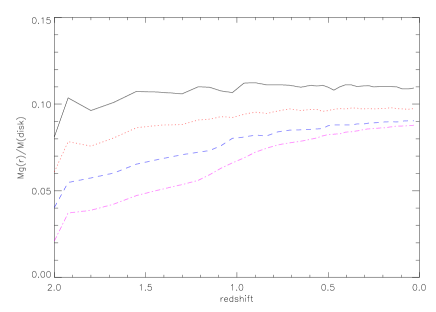
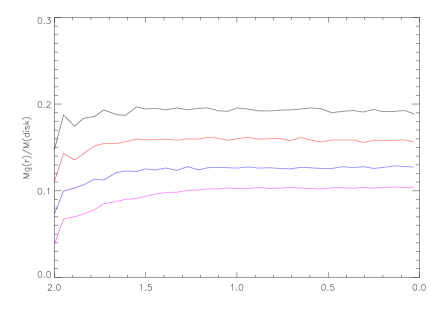
One crucial parameter to monitorate the ability of the central gas
condensation to destroy the bar, is indeed the ratio of the central gas
mass over the total disk mass, that
we show in Fig. 10 and 11.
Fig. 10, for DM dominated disk simulations,
show that the rate of inflow at each radius decreases for higher gas fractions:
from 65% to 37% at 2 Kpc
and from 56% to 35% at 5 Kpc as we go from simulation c4 to c8.
Fig. 11, for our more massive disks,
show the same trend but with a stronger decrease:
from 75% to 35% at 2 Kpc and from 66% to 41% at 5 Kpc
as we go from simulation c1 to c2.
In particular, for simulation c2, where the gas fraction is able to destroy the bar,
the accretion rate at the outer radii becomes quasi stationary after
(Fig. 11, middle panel) since
with the weakening
of the bar, the gas inflow is no longer forced.
In simulation c3, such a behaviour appears
earlier (Fig. 11, middle panel) as well as the bar disappears earlier than in the c2 case.
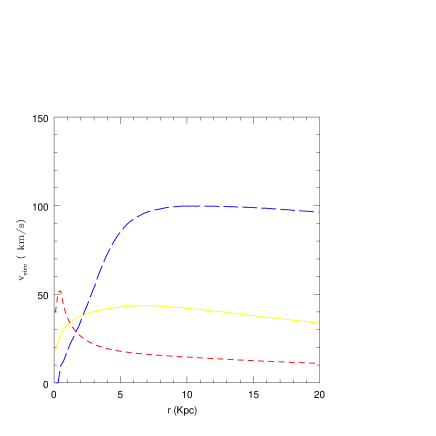
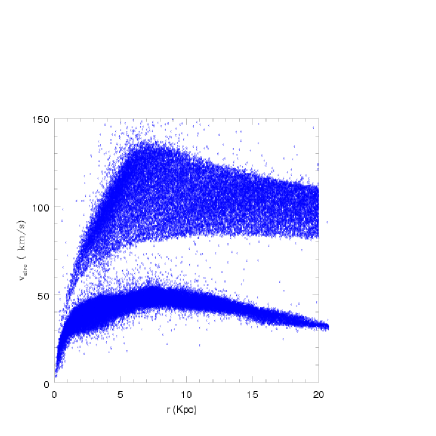
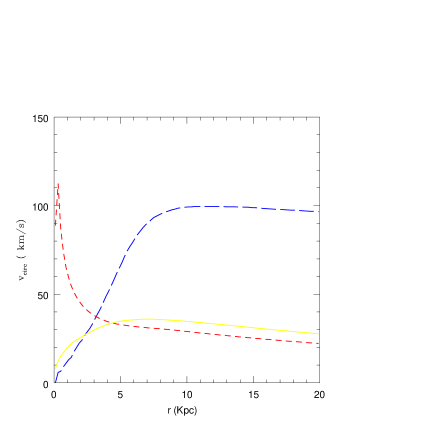
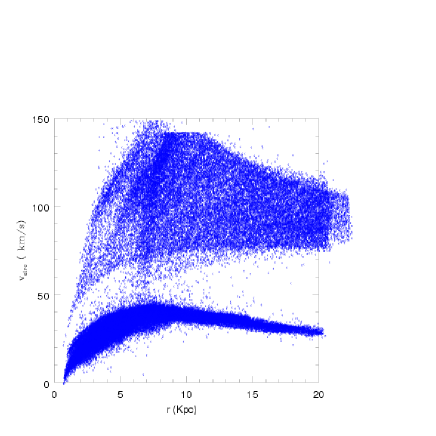
The circular velocity, vcirc, computed assuming a spherical mass
distribution and therefore having the expression where M is the mass of a
component of the system, gives a measure of the absolute concentration of
such a component.
In Figs. 12 and 13 (left panels) we
show its behaviour at for gas, stars and dark matter in
simulations c4 and c6.
In the same Figs. (right panels) we also show the behaviour of the
v evaluated
from the force field of the stellar and DM components.
The difference of these values from the previous ones
is due to the deviation from the spherical isotropy of the mass
distribution. In particular, the wide spread we observe for the DM
component indicates a wide anisotropy, wider at large radii.
The impact of a central mass concentration (CMC) on the bar evolution has been discussed in detail by Shen & Sellwood (2004). Their study is not directly comparable with ours, since the growth of the CMC is modelled with an analytic potential instead of being the result of gas inflow like in our simulations. In their work it was shown that the destruction power depends on the CMC, given as a fraction of the disk mass, and on the ’softening’ of its potential, rs, a parameter which controls the compactness of the CMC. Shen & Sellwood (2004) find that for a hard CMC (namely with very small) only few percent of the disk mass is able to destroy the bar, whereas for a soft CMC ( 0.3 Kpc) a fraction larger than 0.1 plays the job. In our scenario, rs qualitatively translates into the radius, rg, where we set the evaluation of the gas mass concentration. We deduce that for our more massive disks (i.e. when R in Table 1) a gas mass greater than 9% of the disk mass inside Kpc is needed to destroy the bar. However for DM dominated disks, (i.e. with R in Table 1) a value of 18% of the disk mass in the same rg cannot destroy the bar.
Therefore, our cosmological simulations point out that also the value of is a crucial parameter in this play.
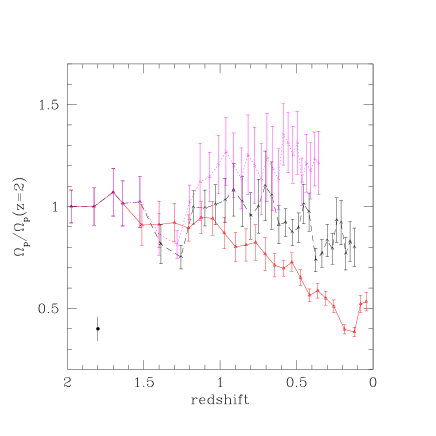
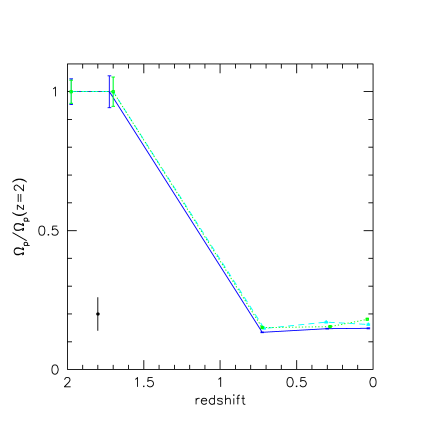
4.3 Bar pattern speed
The bar pattern speed, is the angular speed of the the bar-like density wave as viewed from an inertial frame. Here it is evaluated following the position angle of the major bar axis during the disk evolution, where the major axis is selected with the same criterion E1 quoted in Michel-Dansac & Wozniak (2006), namely as the radius where the ellipticity profile reaches a maximum. In Fig. 14 the values of as function of the redshift are shown for the two sets of our simulations: the more massive disks and the lighter disks respectively. Since the behaviour of is rather noisy, we provided also the error bars calculated with the running average method, i.e. they are obtained averaging three consecutive values and computing their standard deviations. This error bar is more representative of the fluctuations of the quantity than of the real errors on the measurements. On the other hand, the uncertainty in the measure of the position angle of the semimajor axis is always less than . Such a limit leads to a maximum error of 6% in the evaluation of . The error bar related to such a maximum error is presented at the bottom of each panel in Fig.14. For the more massive disks, the stronger decrease is observed in simulation c1. This is also the simulation with the longer and the stronger stellar bar (see Table 2), usually coupled with the higher decrease of the pattern speed during the evolution (Athanassoula, 2002). Simulation c2 shows the same trend, the decrease of is slightly lower, and the bar disappears before z, as in simulation c3. However in such a simulation, the pattern speed increases by decreasing the redshift.
We derive that in the more massive disks the increasing gas fraction produces a speed up of the stellar bar pattern since the gas presence both shortens the bar and decreases its ellipticity. Moreover such a behaviour is consistent with the findings of Berentzen et al. (1998), i.e. an accelerated evolution of the whole system when the gas is included.
On the other hand, the DM dominated disks show the strongest decrease of with the redshift. The lower dynamical support of these light disks compared to the more massive cases indeed enhances the role of the gas which slows down the pattern speed more quickly.
5 Discussion and conclusions
We presented eight cosmological simulations with the same disk–to–halo mass ratios as in Curir et al. (2006). In order to study the impact of the gaseous component, here we included and varied its percentage inside disks with different disk–to–halo mass ratios.
Between the more massive disks, simulation
c1, with the smaller gas percentage, shows a long lasting bar, 10 Gyr old,
stronger
than the one developed in the pure stellar case.
In simulation c2, a gas percentage of 20%
appears as a threshold value for the bar life as far as such
disk mass is concerned. In such a simulation, indeed,
the gas is able to destroy the bar at the very
end of the evolution (z=0.15). By increasing the gas percentage, as in simulation c3,
the bar disappears earlier than in c2 (at z=0.6).
We find that a
gaseous mass concentration equal to 9% of the total mass of the disk
inside a radius of 2 Kpc, is a lower limit for the bar dissolution.
In our more massive disks, where the baryons gravitational field is compelling with that
of the DM halo (i.e. disk-to-halo mass ratio 0.33),
we find a threshold value of the gas fraction, 0.2, able to destroy the bar.
The gas shows a trend to be more widely distributed by increasing its fraction, for a given disk mass. Moreover, for the same gas fraction, the mass inflow is larger in more massive disks. These effects contribute to weakening the bar which, however, in our cosmological framework, cannot be destroyed in DM dominated disks. In these cases, indeed, the cosmological evolution of the DM halo drives the growth of the bar instability so that the presence of the gas appears as a second order effect on its evolution.
The DM dominated disks show indeed a behaviour which is strongly driven by the cosmology as in Curir et al. (2006). In these cases : i) we do not find any value of the gas fraction, in the range 0.1–0.6, able to destroy the bar, ii) even a high value of central gas concentration does not succeed in dissolving the bar. The bars in these disks are not a classical product of the self–gravity, which is very weak, or of angular momentum exchanges, since the disk rotates very slowly, but they are features that strongly depend on the dynamical state and evolution of the cosmological halo. Therefore the classical results emphasising the gas impact obtained outside the cosmological scenario are no longer applicable. This confirms the results of Curir et al. (2006), where in the DM dominated disks the bar feature is triggered and maintained by the cosmological characteristics of the halo, namely its triaxiality and its dynamical state.
Therefore the whole set of cosmological simulations we present here is suggesting a play between three parameters which drive the bar formation and dissolution in cosmology: the gas fraction inside a suitable disk radius, , the value itself, and the halo-to-disk mass ratio inside the disk radius.
Acknowledgements Simulations have been performed on the CINECA IBM SP4 computer, thanks to the INAF-CINECA grants cnato43a/inato003 “Evolution of disk galaxies in cosmological contexts”, and on the Linux PC Cluster of the Osservatorio Astronomico di Torino. We wish to thank for useful discussions: L. Athanassoula, I. Berentzen, F. Bourneaud, E. D’Onghia, A. Klypin & V. Springel.
References
- Abadi et al. (2003) Abadi, M.G., Navarro, J.F., Steinmetz, M., Eke, V.R. 2003, ApJ 591, 499
- Athanassoula (2002) Athanassoula, E. 2002, in: Disks of Galaxies: Kinematics, Dynamics and Perturbations, ASP Conf. series 275, p. 141
- Athanassoula (2003) Athanassoula, E. 2003, MNRAS 341,1179
- Athanassoula et al. (1987) Athanassoula, E., Bosma, A., Papaioannou, S. 1987 A&A, 179,23
- Athanassoula & Misiriotis (2002) Athanassoula, A., Misiriotis, A. 2002, MNRAS, 330, 35
- Berentzen et al. (1998) Berentzen, I., Heller, C. H., Shlosman, I. and Fricke, K. J. 1998, MNRAS, 300, 49
- Berentzen et al. (2001) Berentzen, I., Heller, C.,H., Fricke, K., J., Athanassoula, E. 2001, Ap&SS 276,699
- Binney & Tremaine (1987) Binney, J., Tremaine, S. 1987, Galactic Dynamics,(Princeton, NJ: Princeton Series in Astrophysics)
- Bournaud et al. (2005) Bournaud, F. Combes, F., Semelin, B. 2005, MNRAS, 364, 18
- Bottema (2003) Bottema, R. 2003, MNRAS 344, 358
- Bullock et al. (2001) Bullock, J. S., Dekel, A., Kolatt, T.S., Kravtsov, A.V., Klypin, A., Porciani, R., Primack, S. 2001, ApJ, 555,240
- Buta & Block (2001) Buta, R., Block, D. L. 2001, ApJ 550,243
- Christodoulou et al. (1995) Christodoulou, D.M., Shlosman, I., Tohline, J.E. 1995, ApJ 443,551
- Combes & Sanders (1981) Combes, F., Sanders, R.H. 1981, A&A, 164,173
- Curir & Mazzei (1999) Curir, A., Mazzei, P. 1999 A&A, 352, 103
- Curir et al. (2006) Curir, A., Mazzei P., Murante G. 2006, A&A, 447, 453
- Debattista & Sellwood (2000) Debattista, V.P., Sellwood, J.A. 2000, ApJ, 543, 704
- Efstathiou et al. (1982) Efstathiou, G., Lake, G., Negroponte, J. 1982, MNRAS 199, 1069
- Elmegreen el al. (2003) Elmegreen, B.G., Elmegreen, D.B., Leitner, S.M. 2003, ApJ 590, 27
- Ettori (2003) Ettori, S. 2003, MNRAS, 344L, 13
- Friedli & Benz (1993) Friedli, D. and Benz, W., 1993, A&A 268, 65
- Fux (1999) Fux, R. 1999, A&A 345, 787
- Governato et al. (2004) Governato F., Mayer, L., Wadsley, J., Gardner, J. P., Wilman, B., Hayashi, E., Quinn, T., Stadel, J., Lake, G. 2004, ApJ, 607, 688
- Governato et al. (2006) Governato, F., Willman, B., Mayer, L., Brooks, A., Stinson, G., Valenzuela, O., Wadsley, J., Quinn, T., preprint, astro-ph/0602351
- Hernquist (1993) Hernquist, L. 1993, ApJS, 86,389
- Jesseit et al. (2002) Jesseit, R., Thorsten, N., Burkert, A. 2002, ApJ, 571, 89
- Klypin et al. (2001) Klypin, A., Kravtsov, A., Bullock, J., Primack, J. 2001, ApJ, 554, 903
- Kravtsov (1999) Kravtsov, A. 1999, Ph.D Thesis
- Kravtsov et al. (1997) Kravtsov, A., Klypin, A., Khokhlov, A. 1997, ApJ, 111, 73
- Lacey & Ostriker (1985) Lacey, C.G., Ostriker J. P. 1985, ApJ, 299, 633
- Maller et al. (2002) Maller, A.H., Dekel, A., Somerville, R. 2002, MNRAS, 329, 423
- Mayer & Wadsley (2004) Mayer, L., Wadsley, J. 2004, MNRAS, 347,277
- Mazzei (2003) Mazzei P. 2003, in : Recent Res. Devel. Astronomy and Astrophysics, 1, 457, Pondalai ed. (Kerala, India: Research Signpost)
- Mazzei & Curir (2001) Mazzei, P., Curir, A. 2001, A&A, 372, 803
- Mazzei & Curir (2003) Mazzei, P., Curir, A. 2003, ApJ, 591,784
- Navarro et al. (1996) Navarro, J.F., Frenk, C., White S.D.M. 1996, ApJ, 462, 563
- Michel-Dansac & Wozniak (2006) Michel-Dansac, L., Wozniak, H. 2006,A&A, 452, 97
- Navarro et al. (1997) Navarro, J.F., Frenk, C., White, S.D.M. 1997, ApJ, 490, 493
- Navarro et al. (2000) Navarro, J.F., Steinmetz, M. 2000, ApJ, 538, 477
- Ostriker & Peebles (1973) Ostriker, J.P., Peebles, P.J.E. 1973, , ApJ, 186, 467
- Patsis & Athanassoula (2000) Patsis, P. A., Athanassoula, E. 2000, A&A, 358, 45
- Press et al. (1986) Press, W.H., Flannery, B P., Teuloski, S.A., Wetterling, W.T. 1986, Numerical Recipes, (Cambridge, UK :Cambridge University Press)
- Power et al. (2003) Power, C., Navarro, J.F., Jenkins, A., Frenk, C.S., White, S.D.M., Springel, V., Stadel, J., Quinn, T. 2003, MNNRAS,338, 14
- Raha et al. (1991) Raha, N., Sellwood, J. A., James, R. A., Kahn, F. D. 1991, Nature, 352, 411
- Robertson et al. (2004) Robertson, B., Yoshida, N., Springel V., Hernquist, L. 2004, ApJ, 606, 32
- Shen & Sellwood (2004) Shen, J., Sellwood, J., A. 2004, ApJ, 604, 614
- Sommer-Larsen et al. (2006) Sommer-Larsen, J., ApJ, 661, 1, 2006
- Springel et al. (2001) Springel, V., Yoshida, N., White, S.D.M. 2001, New Astronomy, 6, 79
- Springel (2005) Springel, V., 2005, MNRAS, 364, 1105
- Stadel (2001) Stadel 2001, Ph.D. Thesis, see http://www-hpcc.astro.washington.edu/tools
- Stinson et al. (2006) Stinson, G., Seth, A., Katz, N., Wadsley, J., Governato, F., Quinn, T., preprint, astro-ph/0602350
- Vitvitska (2002) Vitvitska, M., Klypin, A.A., Kravtsov, A.V., Wechsler, R.H., Primack, J.R., Bullock, J.S. 2002, ApJ, 581, 799
- Wechsler et al. (2002) Wechsler, R.H., Bullock, J.S., Primack, J.R., Kravtsov, A.V., Dekel, A. 2002, ApJ, 568, 52