RXTE spectra of the Galactic microquasar GRO J1655–40 during the 2005 outburst
Abstract:
We report on the results of a detailed spectral analysis of 389 RXTE observations of the Galactic microquasar GRO J1655–40, performed during its 2005 outburst. The maximum luminosity reached during this outburst was 1.4 times higher than in the previous (1996–1997) outburst. However, the spectral behavior during the two outbursts was very similar. In particular, was proportional to up to the same critical luminosity and in both outbursts there were periods during which the energy spectra were very soft, but could not be fit with standard disk models.
1 Introduction and Observations
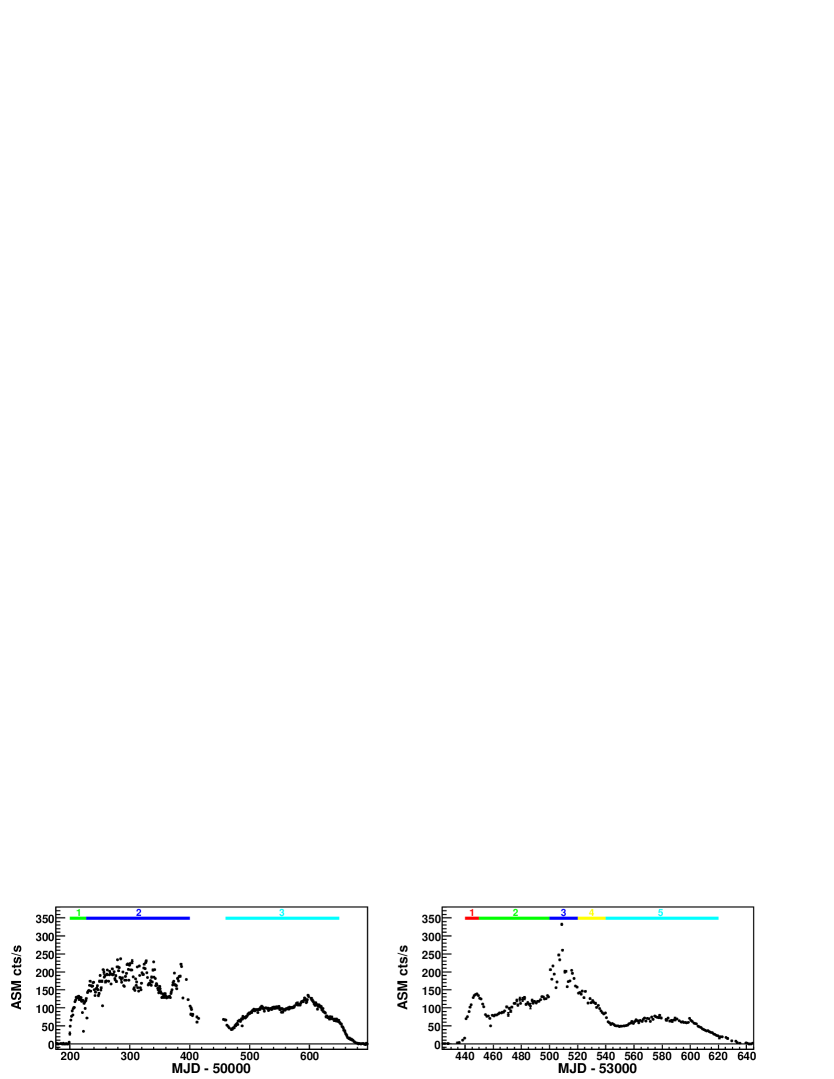
The black-hole transient GRO J1655–40 is a well known Galactic superluminal jet source [1][2]. After its 1996–1997 outburst it remained in quiescence for more than 7 years, until RXTE/ PCA detected a rise in the X-ray flux on 2005 February 17 [3]. Figure 1 shows RXTE/ASM light curves of the 1996–1997 and 2005 outbursts. The 2005 outburst lasted for 8 months and its maximum luminosity was about a factor of 1.4 higher than in the 1996–1997 outburst (which had a duration of 16 months).
We have analyzed 389 RXTE/PCA and HEXTE observations of GRO J1655–40, which were carried out between 2005 March 7 and 2005 September 17, and 80 observations from the period between 1996 May 9 and 1997 September 11. Spectra were extracted using FTOOLS v5.3.1. PCA spectra were produced using ’Standard 2 mode’ data from PCU2. We corrected not only for PCA dead-time but also for pile-up111From J. A. Tomsick and P. Kaaret (1998): http://astrophysics.gsfc.nasa.gov/xrays/programs/rxte/pca/. and a 2% systematic error was added. We found that pile-up effects could be as strong as 10%, but fitting parameters did not change significantly even for such high values. HEXTE spectra were produced from ’Archive mode’ data of cluster A (0–3) and cluster B (0,1,3). The PCA data were fitted between 3 and 20 keV and the HEXTE data between 17 and 240 keV (or lower energies, in case of low source counts).
2 Results
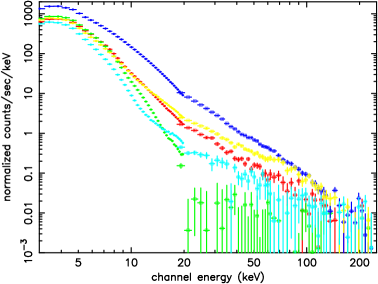
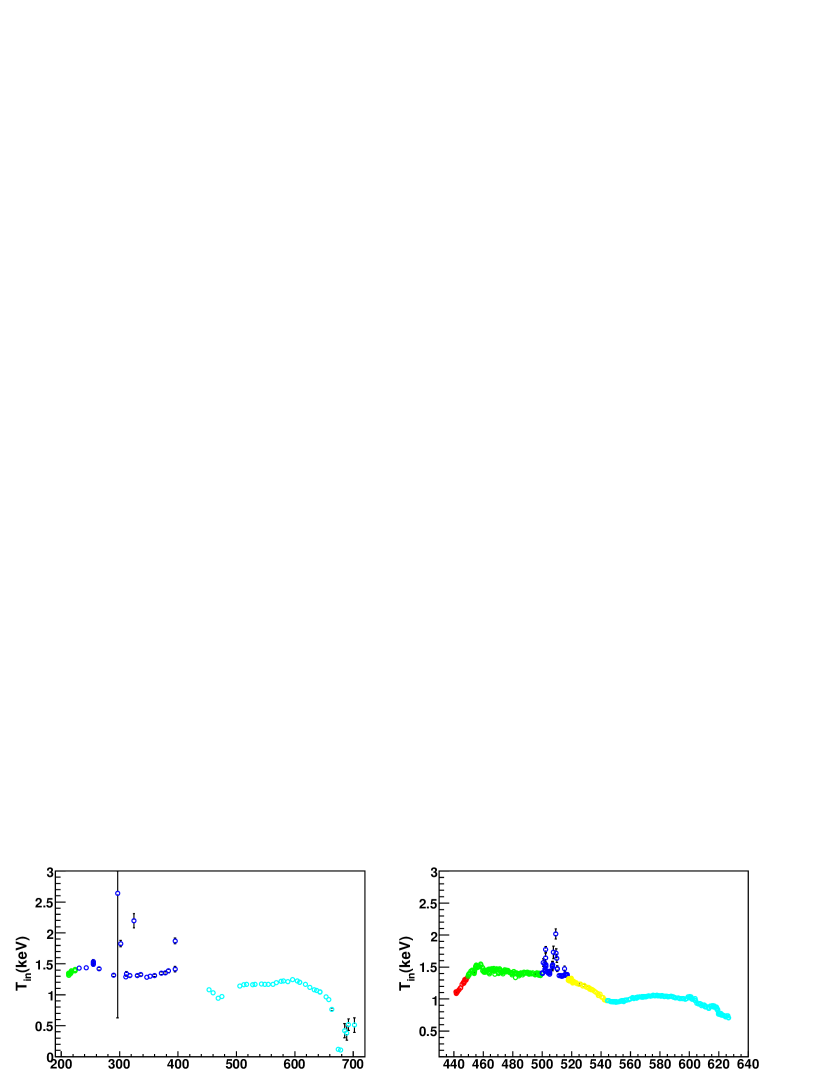
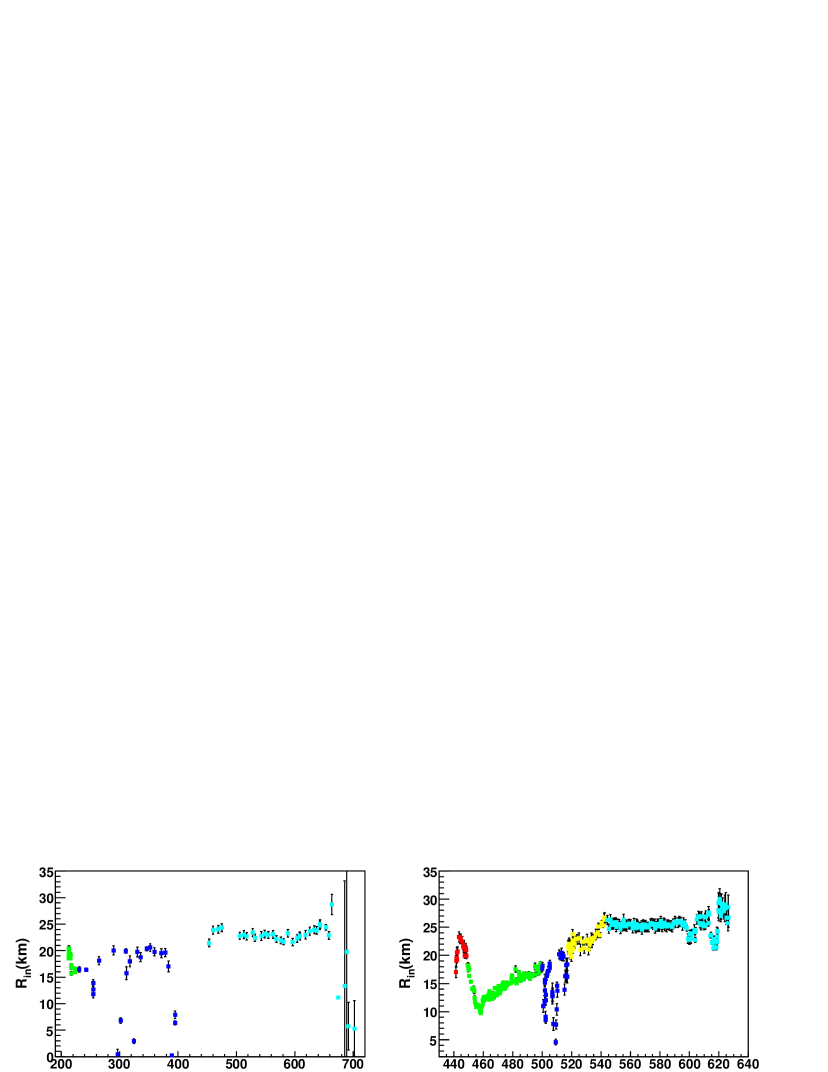
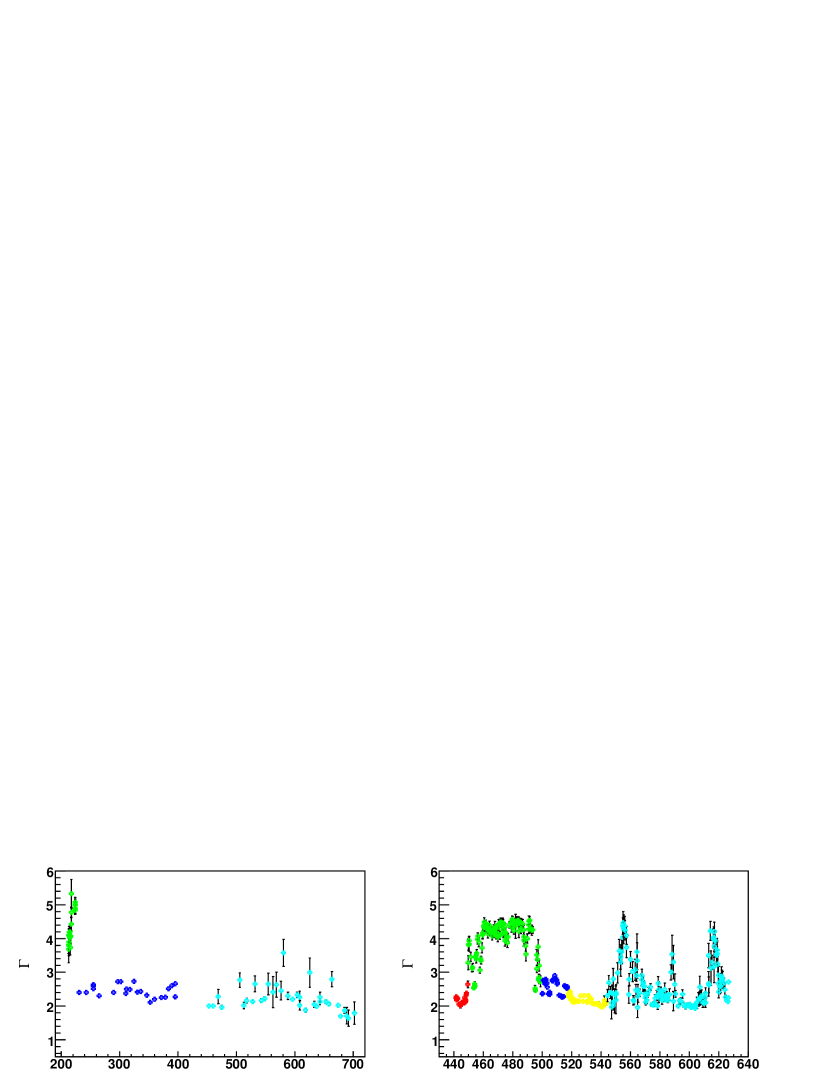
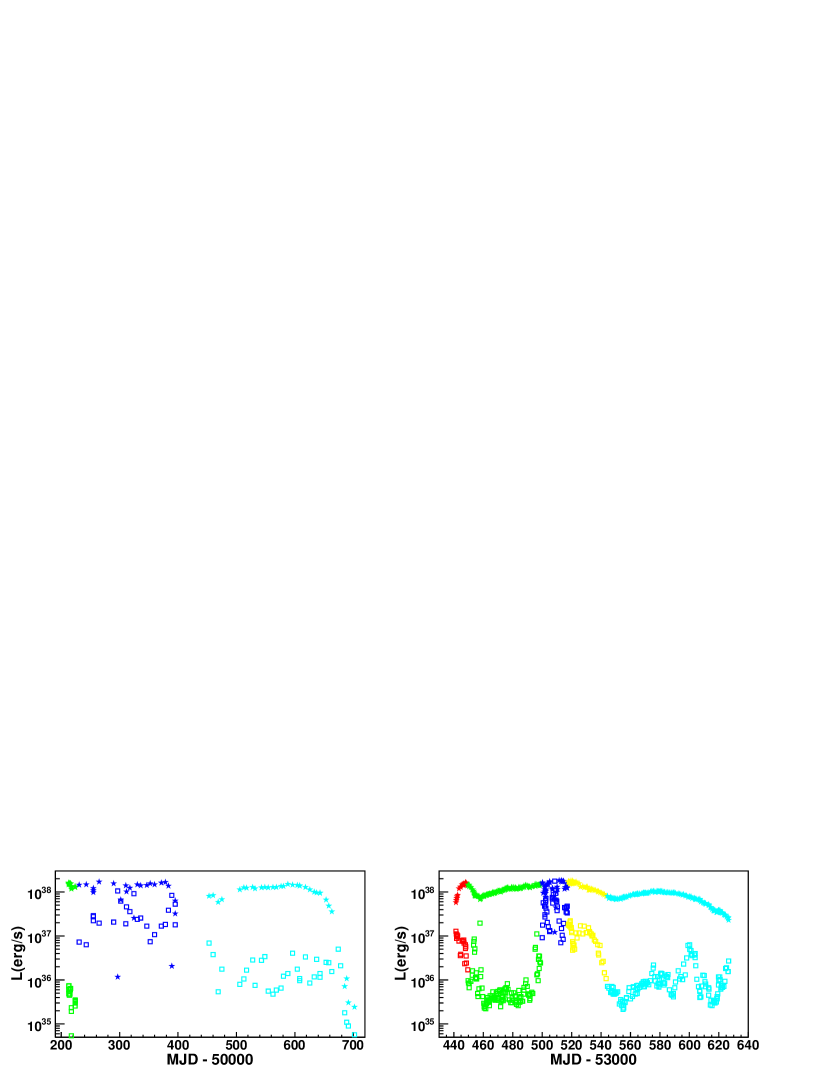
We applied a simple phenomenological spectral model consisting of a multi-color disk black body and a power-law component. Following [4] we added an absorption line at 6.8 keV and absorption edges at 7.7 keV, 8.8 keV, 9.3 keV and 10.8 keV to our model. The hydrogen column density () was fixed to 7.1 atoms cm-2. We were mainly interested in the evolution of the disk parameters and since no disk component could be detected in the hard state of GRO J1655–40, observations from that state were excluded from further consideration. Figure 2 shows the time evolution of the spectral parameters during both outbursts and Figure 3 shows typical PCA and HEXTE energy spectra of GRO J1655–40 for the 2005 outburst.
The values of were corrected by [5], where is a spectral hardening factor [6], is a correction factor for the inner boundary condition [7], and is the apparent inner disk radius. Although the value of depends on a luminosity, we followed [5] and corrected the values of with and as an approximation. The values of and are calculated for D = 3.2 kpc [2] and an inclination of 70∘ [8]. If D 1.7 kpc [9], and decrease by a factor of 53% and 30%, respectively. When and the power-law component could not be well constrained (i.e. when it was weak), was fixed to 2.1, which was nominal soft-state value.
Based on the spectral fit results, the observations of the 2005 outburst could be divided into 5 Epochs (this excludes the hard state). Epoch 1: the hard component was strong and the disk component was underestimated ( was smaller than the value in Epoch 5, which is discussed below). Epoch 2: the spectra were very soft and the source was rarely detected with HEXTE. was small ( 10–18 km) and was high ( 1.4–1.5 keV). During the transitions from Epoch 1 to Epoch 2 and from Epoch 2 to Epoch 3 the hardness fluctuated, so sharp boundaries between these Epochs were difficult to define. Epoch 3: the luminosity reached its maximum of the 2005 outburst and power-law component increased dramatically. and exhibited large fluctuations. Epoch 4: the hard component was strong and similar to Epoch 1. Epoch 5: was fairly constant at 26km and changed in accordance with the changes of . Although the hardness was not constant and there were days that was large (but not well constrained), the parameters of the disk component changed little and fitting was still acceptable when was fixed at 2.1. Since the disk component dominated the X-ray spectrum in Epoch 5, we consider the fitted disk parameters to be more reliable than in the other Epochs.
The 1996–1997 outburst could be roughly classified into 3 Epochs. Epoch 1, 2 and 3 in the 1996–1997 outburst were similar to Epoch 2, 3 and 5 in the 2005 outburst, respectively. GRO J1655–40 therefore passed through similar states in the roughly the same sequence in both outbursts. However, there was no period in the 1996–1997 outburst corresponding to Epoch 1 in the 2005 outburst, probably because the initial phase of the 1996–1997 outburst was not well covered by pointed RXTE observations. In addition, it is not clear whether the 1996–1997 outburst has a period similar to Epoch 4 in the 2005 outburst because the object went into the solar exclusion zone after Epoch 2 in the 1996–1997 outburst [10].
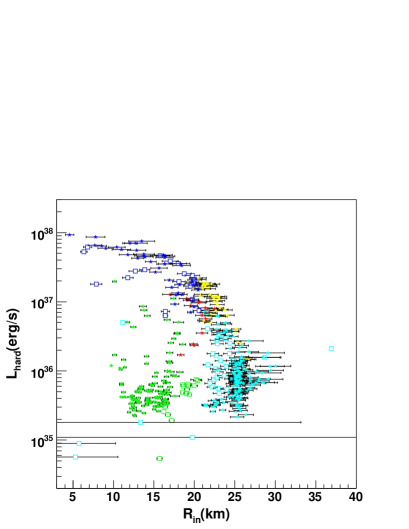
Although we tried to add emission lines and/or absorption edges [10][11][12], our fits for Epoch 2 in the 2005 outburst and Epoch 1 in the 1996–1997 outburst were poor ( 2-4). As can be seen from Figure 4, when the power-law component became strong, the disk component was underestimated and decreases. However, the distribution of Epoch 2 in 2005 and Epoch 1 in 1996–1997 was quite different from other Epochs in the sense that they did not fall on the main branch traced out by the other Epochs. Perhaps the state of the accretion disk was different in these two Epochs and other disk models need to be applied.
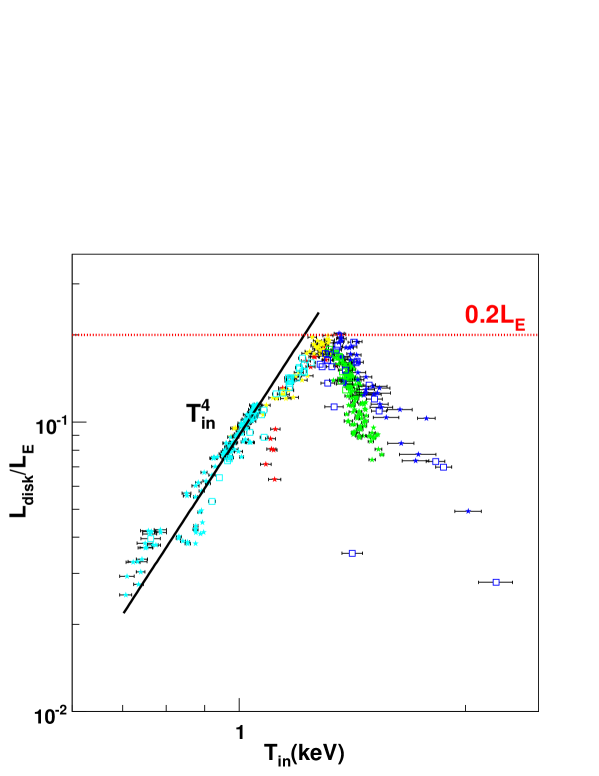
Finally, Figure 5 shows the correlation between and . was calculated for the mass of the compact object [8]. By comparing the 2005 outburst with the 1996–1997 outburst, we find that both outbursts traced out very similar tracks and have nearly the same critical luminosity () at which the source starts to leave the relation [5]. This result indicates that there is likely a fixed physical process that causes the departure from the relation in both outbursts.
Acknowledgment: We would like to thank J. A. Tomsick for providing his PCA pile-up correction program. This report has made use of data obtained through the High Energy Astrophysics Science Archive Research Center on-line service, provided by NASA/Goddard Space Flight Center.
References
- [1] S. J. Tingay et al., Relativistic motion in a nearby bright X-ray source, Nature, 374, 141 (1995).
- [2] R. M. Hjellming, & M. P. Rupen, Episodic ejection of relativistic jets by the X-ray transient GRO J1655–40, Nature, 375, 464 (1995).
- [3] C. B. Markwardt, & J. H. Swank, New Outburst of GRO J1655–40?, ATel, 414 (2005).
- [4] K. Yamaoka, Y. Ueda, H. Inoue, F. Nagase, K. Ebisawa, T. Kotani, Y. Tanaka, & S. N. Zhang, ASCA Observation of the Superluminal Jet Source GRO J1655–40 in the 1997 Outburst, PASJ, 53, 179 (2001).
- [5] A. Kubota, K. Makishima, & K. Ebisawa, Observational Evidence for Strong Disk Comptonization in GRO J1655–40, ApJ, 560, 147 (2001) [astro-ph/0105426].
- [6] T. Shimura, & F. Takahara, On the spectral hardening factor of the X-ray emission from accretion disks in black hole candidates, ApJ, 445, 780 (1995).
- [7] A. Kubota, Y. Tanaka, K. Makishima, Y. Ueda, T. Dotani, H. Inoue, & K. Yamaoka, Evidence for a Black Hole in the X-Ray Transient GRS 1009-45, PASJ, 50, 667 (1998).
- [8] J. A. Orosz, & C. D. Bailyn, Optical Observation of GRO J1655–40 in Quiescence. I. A. Precise Mass for the Black Hole Primary, ApJ, 477, 876 (1997) [astro-ph/9610211].
- [9] C. Foellmi, E. Depagne, T. H. Dall, & I. F. Mirabel, On the distance of GRO J1655–40, A&A, 457, 249 (2006) [astro-ph/0606269].
- [10] G. J. Sobczak, J. E. McClintock, R. A. Remillard, C. D. Bailyn, & J. A. Orosz, RXTE Spectral Observations of the 1996–1997 Outburst of the Microquasar GRO J1655–40, ApJ, 520, 776 (1999) [astro-ph/9809195].
- [11] C. Brocksopp et al., The 2005 outburst of GRO J1655–40: spectral evolution of the rise, as observed by Swift, MNRAS, 365, 1203 (2006) [astro-ph/0510775].
- [12] G .Sala, J. Greiner, J. Vink, F. Haberl, E. Kendziorra, & X. L. Zhang, The highly ionized disk wind of GRO J1655–40, A&A, in press (2006) [astro-ph/0606272].