INTEGRAL/IBIS all-sky survey in hard X-rays††thanks: Based on observations with INTEGRAL, an ESA project with instruments and science data centre funded by ESA member states (especially the PI countries: Denmark, France, Germany, Italy, Switzerland, Spain), Czech Republic and Poland, and with the participation of Russia and the USA
We present results of an all-sky hard X-ray survey based on almost four years of observations with the IBIS telescope on board the INTEGRAL observatory. The dead time-corrected exposure of the survey is Ms. Approximately 12% and 80% of the sky have been covered to limiting fluxes lower than and mCrab, respectively. Our catalog of detected sources includes 400 objects, 339 of which exceed a detection threshold on the time-averaged map of the sky and the rest were detected in various subsamples of exposures. Among the identified sources, 213 are Galactic (87 low-mass X-ray binaries, 74 high-mass X-ray binaries, 21 cataclysmic variables, 6 coronally active stars, and other types) and 136 are extragalactic, including 131 active galactic nuclei (AGNs) and 3 clusters of galaxies. We obtained number–flux functions for AGNs and Galactic sources. The – relation of AGNs (excluding blazars) is based on 69 sources with fluxes higher than erg s-1 cm-2 ( mCrab) in the 17–60 keV energy band. The cumulative number–flux function of AGNs located at Galactic latitudes , where the survey is characterized by high identification completeness, can be described by a power law with a slope of and normalization of sources per deg2 at fluxes erg s-1 cm-2 ( mCrab). AGNs with fluxes higher than make up of the cosmic X-ray background at 17–60 keV. We present evidence of strong inhomogeneity in the spatial distribution of nearby ( Mpc) AGNs, which reflects the large-scale structure in the local Universe.
Key Words.:
Surveys – X-rays: general – Galaxy: general – Galaxies: Seyfert – (Cosmology:) large-scale structure of Universe1 Introduction
The INTEGRAL observatory (Winkler et al. 2003) has been successfully operating in orbit since its launch in 2002. Due to the high sensitivity and relatively good angular resolution of its instruments, in particular the coded-mask telescope IBIS (Ubertini et al. 2003), surveying the sky in hard X-rays is one of the primary goals of INTEGRAL. A number of papers have reported results of deep observations of relatively compact regions of the sky (e.g Revnivtsev et al. 2003a; Molkov et al. 2004; Krivonos et al. 2005a; Revnivtsev et al. 2006) and of systematic searches for sources over very large sky areas (e.g., Bird et al. 2006a, b). However, until recently it was difficult to use INTEGRAL data for source population studies, in particular extragalactic, because the coverage of the sky remained substantially incomplete. Therefore, in 2005–2006 we performed dedicated observations of the previously unobserved regions of the sky and thereby completed the most sensitive ever all-sky survey in hard X-rays. In this paper, we present a catalog of sources detected during the all-sky survey (Sect. 4), discuss the number–flux relations of Galactic and extragalactic hard X-ray sources (Sect. 5), and investigate the spatial distribution of local AGNs (Sect. 6).
2 Survey coverage and sensitivity
The present survey is based on observations performed during the first four years of the INTEGRAL mission. We used data from the ISGRI detector of the IBIS telescope, which is well suited for carrying out imaging surveys in hard X-rays. The coded-mask telescope IBIS provides a wide field of view of ( fully coded) and moderate angular resolution of ′. The localization accuracy of 2–3′ is sufficiently good for searches of soft X-ray and optical counterparts and subsequent optical identification of newly discovered hard X-ray sources.
We used all public and proprietary data available to us. The observations were performed during spacecraft revolutions from 25 (end of December 2002) to 463 (June 2006). Importantly, our data set includes the special series of thirteen 200 ks-long extragalactic pointings (PI Churazov), which allowed us to complete the survey of the entire sky. Figure 2 shows the fraction of the sky covered by the survey as a function of the limiting flux for source detection with at least significance. Approximately 12% and 80% of the sky are covered down to 1 and 5 mCrab, respectively. After data cleaning and dead-time correction, the total exposure time of the survey is Ms.
3 Data analysis
We analyzed the entire set of INTEGRAL observations at the level of individual pointings (science windows, SCWs), which have typical exposures of 2 ksec. For each observation, the IBIS/ISGRI raw events list was converted to a sky image in our working energy band (17–60 keV). The employed algorithm of image reconstruction was previously described by Revnivtsev et al. (2004a) and Krivonos et al. (2005a). Here we outline only those steps that are essential for the present study.
We first accumulated raw detector images in the 17–60 keV energy band and cleaned them from bad and noisy pixels. The reconstruction starts with rebinning the raw detector images onto a grid with a pixel size equal to 1/3 of the mask pixel size. This is close but not exactly equal to the detector pixel size. Therefore, the rebinning causes a moderate loss in spatial resolution but enables a straightforward application of standard coded-mask reconstruction algorithms (e.g., Fenimore et al. 1981, Skinner et al. 1981). Essentially, for each sky location, the flux is calculated as the total flux in those detector pixels that “see” that location through the mask minus the flux in those detector pixels that are blocked by the mask.
The image reconstruction is based on the DLD deconvolution procedure (see the notations in Fenimore et al. 1981), with a mask pixel corresponding to detector pixels. The original detector is treated as independent detectors, and independent sky images are reconstructed and then combined into a single image. A point source in such an image is represented by a square. In our case, this leads to the effective point spread function (PSF) being approximately a square of detector pixels, or . After summing a large number of individual images, the 2D shape of the PSF can be well approximated by a Gaussian with .
The periodic structures in the IBIS mask cause the appearance of parasitic peaks (”ghosts”) in the images of real sources. We used an iterative procedure to eliminate such ghosts. For this purpose, we used a “current” catalog of sources, which was renewed each time a new bright source was detected. The image reconstruction was then redone for each observation containing the new source using the updated current catalog.

The case of a bright source
Since the pattern of the shadowgram cast by a point source through the mask is not ideally known, the ghost removal procedure is not perfect. Some photon counts can be left or oversubtracted at certain positions on the detector. This effect is usually small but can become significant for deep fields containing very bright sources. In this case, characteristic “crosses” and “rings” appear around the bright sources. The former artifact appears when the observational program of a bright source is dominated by starring pointings with a constant roll angle. A variable roll angle diminishes this effect but produces concentric structures. In practice this means that in regions with very bright sources, some source detections based on the criterion of exceeding a reasonable threshold, say , may be false. The level at which imperfect ghost removal starts to play a role depends on the observational pattern and typically corresponds to (3–5) of the flux of the brightest source within the IBIS field of view. Therefore, the extracted list of excesses should always be checked “by eye” and cleaned out from such characteristic series of false detections around bright sources. It should be noted that such a cleaning introduces “dead zones” where a real source may be missed. We have verified that in the worst case, the total area of such zones does not exceed , which constitutes a neglible fraction of the total area of our all-sky survey.
On applying the procedures described above, each observation is represented by a sky image with a pixel size of 4′. The full analyzed data set contains 23,547 such images and comprises Ms (dead time-corrected) worth of observations. We applied an additional filtering to the resulting images using information about the residual (after subtraction of point sources) signal-to-noise variations in the images. Those images having were excluded from the analysis. This resulted in an additional rejection of of the pointings and finally left us with Ms worth of clean observations.
An analysis of mosaic images built from observations covering the whole sky is complicated by various effects of projections onto a 2D plane. The most significant one is distortions of the point spread function (PSF) at positions far from the center of the projection. This leads to uncertainties in estimating the source position and flux. To avoid this effect, we followed an approach that had been developed for analyzing data distributed on a sphere. Specifically, we used a number of subroutines from the HEALPIX package (Hierarchical Equal Area isoLatitude Pixelization of a sphere, Górski et al. 2005) to build a mosaiced sky. This technique provides an equal-area pixelization of the sphere and allows us to analyze all of the data uniformly. We produced a HEALPIX-based map of the whole sky with 12M pixels, which corresponds to a size of each sky pixel. The map was constructed by projecting individual IBIS/ISGRI images onto the HEALPIX all-sky frame.
3.1 Detection of sources
We searched for sources on three time scales – in individual SCWs (2 ks exposure time, typical sensitivity 20–30 mCrab), on images integrated over individual satellite orbits (200 ks, mCrab), and on the time-averaged all-sky map (33 Ms).

The detection of sources was performed using projections of the HEALPIX all-sky image. Since adjacent pixels in these images (pixel size ) are smaller that the instrumental PSF, we convolved the images with a Gaussian filter that mimics the effective instrumental PSF ().
The signal-to-noise ratio distribution of pixels is dominated by the statistical noise and can be described by a Gaussian. In those sky regions that contain very bright point sources, the scatter of signal-to-noise ratios increases. However, this mainly occurs due to the presence of unsubtracted ghosts, which can be found by eye and removed.
There are small misalignments between the mask grid and the detector pixels, which cause imperfect redistribution of counts over the mask-aligned detector grid. However, this effect is minor, because the correlation length of the noise in the projected images is smaller than the size of the applied Gaussian filter. As a result, the originally measured variance of the distribution of pixel significances is slightly less than unity. To correct for this, we implemented a uniform rescaling of the error map for each sky projection. The correction factor was determined from each HEALPIX projection image and found to vary between 0.9 and 1.0. For sky fields containing a large number of point sources or for images of poor quality, the mentioned effect becomes less important than systematic biases introduced by the image reconstruction algorithm (Sect. 3). In such cases, the correction factor cannot be properly estimated, and so we adopted it to be not greater than unity. In Fig. 3 we show the signal-to-noise ratio distribution of the pixels of a corrected sky map centered on some arbitrary position. This distribution (except for the positive bright tail produced by real sources) can be described by the normal distribution with unit variance and zero mean.
We next specified a detection threshold in units of this clean “sigma” to search for sources in images. The lists of source candidates were then cleaned by eye from excesses forming characteristic patterns around bright sources.
Taking into account the IBIS/ISGRI angular resolution, the all-sky map and maps accumulated during single revolutions contain and statistically independent pixels, respectively. We adopted the corresponding detection thresholds of and to ensure that the final catalog contains less than 1–2 spurious sources.
Apart from the main search described above, we detected several sources in special extended series of observations such as the deep surveys of the Sagittarius and Crux spiral arm tangent regions (Molkov et al. 2004; Revnivtsev et al. 2006). Some of these sources fall below our detection threshold () on the all time-averaged map, which probably indicates their strong variability or transient nature.
We emphasize that for statistical studies only those sources from the catalog that have time-averaged statistical significance higher than (see the flux column in Table 1 below) should be used.
3.2 Localization accuracy
We determined the positions of sources by fitting the centroid of a 2D gaussian () to the peak of the PSF-convolved source image. To estimate the accuracy of this method, we built the distribution of deviations of the measured positions of sources with known cataloged locations for a large number of INTEGRAL observations. The positional accuracy of sources detected by IBIS/ISGRI depends on the source significance (Gros et al. 2003; Bird et al. 2006a). The estimated confidence intervals for sources detected at 5–6, 10, and are ′, ′, and ′, respectively.
4 Catalog
We detected a total of 400 sources in the 17–60 keV energy band over the whole sky. The full list of sources is presented in Table 1, and its content is described below.
Column (1) – source number in the catalog.
Column (2) – source name. For sources whose nature was known before their detection by INTEGRAL, their common names are given. Sources discovered by INTEGRAL or those whose nature was established thanks to INTEGRAL are named “IGR”
Columns (3,4) – source Equatorial (J2000) coordinates.
Column (5) – time-averaged source flux in mCrab units. A flux of mCrab corresponds to erg s-1 cm-2 for a source with a Crab-like spectrum.
Column (6) – general astrophysical type of the object: LMXB (HMXB) – low- (high-) mass X-ray binary, AGN – active galactic nucleus, SNR/PWN – supernova remnant, CV – cataclysmic variable, PSR – isolated pulsar or pulsar wind nebula, SGR – soft gamma repeater, RS CVn – coronally active binary star, SymbStar – symbiotic star, Cluster – cluster of galaxies.
Column (7) – additional notes and/or alternative source names.
Column (8) – references. These are mainly provided for new sources and are related to their discovery and/or nature.
We note that Bird et al. (2006b) have recently performed a similar hard X-ray survey using INTEGRAL/IBIS/ISGRI data. The catalog of these authors contains 421 sources detected in five energy bands spanning 18–100 keV. Although a detailed comparison of this catalog with ours goes beyond the scope of the present paper, we may mention some important differences: (i) our dataset covers a number of extragalactic regions not covered by the survey of Bird et al. (2006b), on the other hand their dataset contains a considerable amount of data not available to us; (ii) Bird et al. (2006b) used the standard INTEGRAL OSA software, whereas we used a software developed at the Space Research Institute (Moscow, Russia); (iii) the detection criterion adopted in our work allows not more than 1–2 spurious sources to be present in the whole catalog, while the catalog of Bird et al. (2006b) may, by construction, contain considerably more spurious sources.
4.1 Some peculiar sources
Galactic Center source IGR J174562901
The sky density of hard X-ray sources is not very high – in general deg-2, therefore the angular resolution of the IBIS telescope () is usually sufficient to prevent source confusion. The only exceptional region is the Galactic center: in the close vicinity (within ) of Sgr A∗, IBIS sees 10 sources.
At the position of Sgr A∗ there is an additional hard X-ray excess, IGR J174562901. This source was originally reported by Revnivtsev et al. (2004c) and erroneously associated with the X-ray burster AX J174562901. Subsequent studies of this source demonstrated that it is extended (Neronov et al. 2005; Bélanger et al. 2006) and is probably the superposition of a large number of faint point sources located in the Galactic nuclear stellar cluster (Krivonos et al. 2005b). Note that, as is shown by Bélanger et al. (2006), at higher energies ( 70–100 keV), the position of the centroid of the excess is displaced with respect to Sgr A∗, indicating that the nature of the high-energy source may be different from that of the 17–60 keV emission.
RX J1713.73946
Since IBIS is a coded-mask telescope, it is not well suited for studying sources more extended than its angular resolution. However, if a source is only somewhat larger than the instrumental PSF, it is possible to obtain some limited information about the spatial structure of the source (see e.g. Renaud et al. 2006a, b).
In particular, in our catalog there are four extended sources that are not much larger than the IBIS PSF (): three clusters of galaxies (Oph, Perseus, and Coma) and the supernova remnant RX J1713.73946.
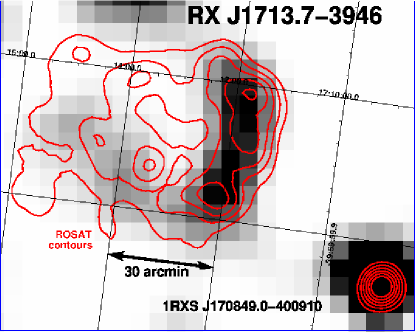
It is clearly seen (Fig. 4) that the supernova remnant RX J1713.73946 exhibits clear extended structure (visible size in hard X-rays ′). The significance of the hard X-ray detection varies along the extended structure between 4 and 5 (the statistical significance of the total extended emission is ). The total exposure for this region is 5.3 Ms (dead time-corrected). To test the stability of the apparent spatial feature, we split the entire period of observations into four intervals and examined them individually. The extended structure is clearly present in each image and looks stable against the background of variable noise.
The supernova remnant RX J1713.73946 was discovered in soft X-rays during the ROSAT all-sky survey (Pfeffermann & Aschenbach 1996). An extended elliptical structure was found with a maximum extent of 70′ (see the red contours in Fig. 4). The non-detection of emission lines in the X-ray spectrum of RX J1713.73946 (ASCA, Koyama et al. 1997; Slane et al. 1999) was regarded as an indication that the observed X-rays is non-thermal emission from an expanding shell.
Recently, very high-energy (VHE) gamma-ray emission was discovered from the remnant by the H.E.S.S. experiment (Aharonian et al. 2006). The spatial correlation of the VHE emission intensity with the X-ray morphology confirms that cosmic-ray particles are being accelerated in the shell.
Here we report a detection of RX J1713.73946 in hard X-rays. The hard X-ray emission is probably synchrotron emission of 100-TeV electrons accelerated in the shell (Koyama et al. 1995).
5 Extragalactic sources – AGNs
All sources in our catalog can be separated into two main classes – galactic and extragalactic (mainly AGNs). Under the assumption that AGNs are uniformly distributed over the sky (which is only a crude approximation of the real situation, see Sect. 6), we can construct the deepest ever number-flux function of hard X-ray emitting AGNs.
The catalog contains 131 objects111Three additional sources: IGR J024664222, IGR J025240829, and IGR J185783405 have a suspected AGN origin. identified as AGNs (see also Sazonov et al. 2007 222After publication of the INTEGRAL AGN catalog by Sazonov et al. (2007), four sources have been added to the AGN list: IGR J182493243 (Bassani et al. 2006), ESO 005-G004, IGR J145613738, and SWIFT 0920.80805). Of these, 94 have statistical significance higher than 5 on the time-averaged map, including 86 emission-line AGNs (non-blazars) and 8 blazars. There are also 40 unidentified sources detected on the average map. The relative fraction of unidentified sources is much smaller for the extragalactic sky () than for the whole sky: the corresponding numbers of non-blazar AGNs and unidentified sources are 69 and 6.

Since INTEGRAL observations cover the sky inhomogeneously, in constructing number-flux functions we should take the sensitivity map into account. In Fig. 5 we show the cumulative – distribution of non-blazar AGNs derived at (excluding the 7 unidentified sources). It can be well fit by a power law: . Using a maximum-likelihood estimator (see e.g. Crawford et al. 1970), we determined the best-fit values of the slope and normalization: and deg-2 at mCrab. This implies that AGNs with fluxes exceeding our effective threshold mCrab account for of the intensity of the cosmic X-ray background in the 17–60 keV band, which was recently re-measured by INTEGRAL (Churazov et al. 2007).
We previously (Krivonos et al. 2005a) constructed a number–flux relation of extragalactic sources in a relatively small region of the sky () around the Coma cluster of galaxies. The deep ( ks) observations of the Coma were used to study a sample of 12 serendepitously detected sources in that field. After correcting for the expected number of false detections and fitting the resulting – relation by a power law with the Euclidean-geometry slope of , the surface density of hard X-ray sources above a 20–50 keV flux threshold of erg s-1 cm-2 ( mCrab) was found to be deg-2. This value is significantly higher than the average surface number density of AGNs in the sky, determined above, which probably reflects the large-scale overdensity of galaxies in the general direction of the Coma cluster (see Sect. 6).
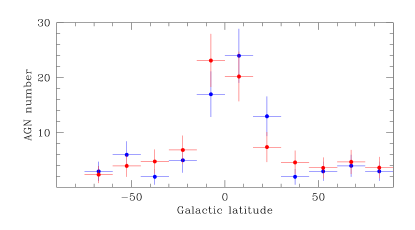
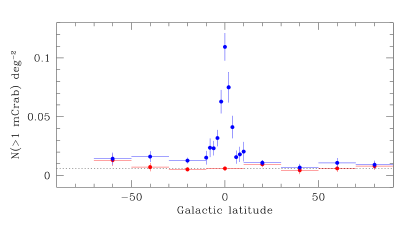
Using the derived – distribution, we can compare the numbers of AGNs detected during the survey in different parts of the sky with the numbers expected under the assumption of uniform spatial distribution of sources. We find good agreement between these numbers within the statistical errors for strips cut parallel to the Galactic plane (Fig. 6). Even in the Galactic plane region (), which was excluded from our calculation of the number-flux function, the expected number of AGNs exceeding the detection threshold (18.4) is compatible with the number of detected and identified AGNs (16). This suggests that most of the unidentified sources in the Galactic plane region are of Galactic, rather than extragalactic origin. This tentative conclusion of course rests on our assumption that AGNs are distributed uniformly on very large scales over the sky, which is in fact approximately true only for relatively distant objects ( Mpc, see the next Section) and much less so for more nearby AGNs, which constitute approximately half of our sample.
If we now include all the identified AGNs detected in the Galactic plane region into the calculation of the AGN number–flux function (thus increasing the total number of non-blazar AGNs to 86 and extending the calculation to the whole sky), we find and deg-2 at 1 mCrab, i.e. virtually the same values as for the sky.
6 Signatures of large-scale structure in the population of hard X-ray AGNs
It is now widely accepted that practically every galaxy in the local Universe has a supermassive black hole and some of these black holes are AGNs with widely ranging luminosities (see e.g., Richstone et al. 1998; Kormendy 2001, for a review). Therefore, it is reasonable to assume that the space density of X-ray emitting AGNs is proportional to that of normal galaxies.
The spatial distribution of galaxies in the local Universe is inhomogeneous. The gravitational attraction of matter in the Universe has formed different structures with sizes333Hereafter we adopt km s-1 Mpc-1. up to Mpc. On larger scales, matter is distributed more or less uniformly, whereas on smaller scales there is strong inhomogeneity. The contrast in matter density between galaxy concentrations and voids can reach an order of magnitude and more (see e.g. Rees 1980; Davis & Peebles 1983; Bahcall & Burgett 1986). As our sample of hard X-ray emitting AGNs mostly probes the nearby Universe out to distances Mpc, we have the possibility to see similarly strong inhomogeneities in the distribution of nearby AGNs.
To this end, we estimated the space densities of AGNs in different directions of the sky. Due to the relatively small size of our sample, we assumed that the AGN number density is constant along a given line of sight while the shape of the AGN luminosity function is invariant in the local Universe. We adopted this shape from Sazonov et al. (2007), who calculated the all-sky average hard X-ray luminosity function using the same sample of AGNs as in the present study.
Under these assumptions and using the sensitivity map of the survey, we determined the normalization of the luminosity function within spherical cones drawn around multiple directions in the sky through comparison of the expected and measured numbers of AGNs in these cones. We adopted the half-opening angle of the cones to be in order to achieve reasonably good angular resolution of the resulting map and still have a significant number of AGNs in each cone. To optimize our sensitivity to anisotropies in the spatial distribution of AGNs, we restricted ourselves to distances Mpc, at which maximal contrasts in galaxy numbers are expected (see e.g. Rowan-Robinson et al. 2000).
In Sect. 3 we demonstrated that most of the extragalactic objects detectable by INTEGRAL in the Galactic plane region are probably already identified, hence we can use for our analysis the all-sky sample of AGNs.
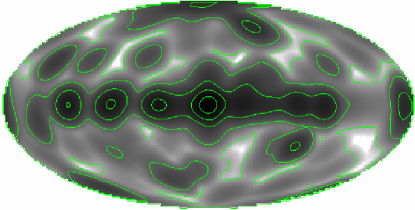
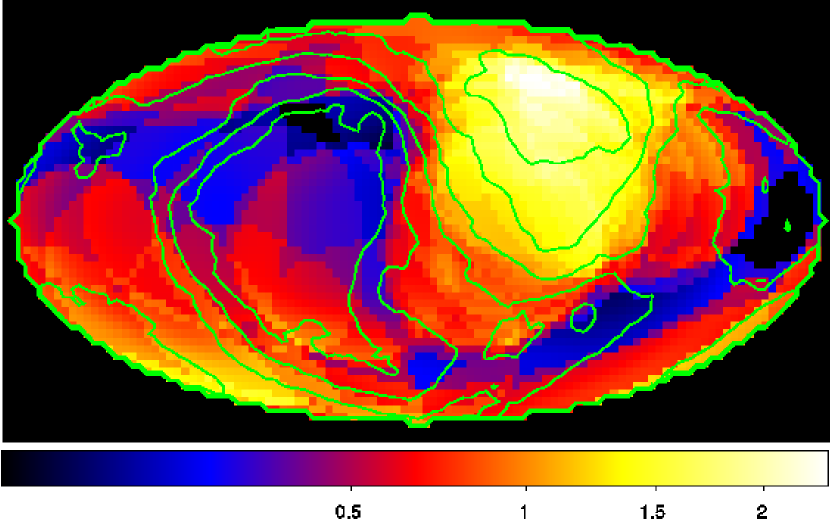
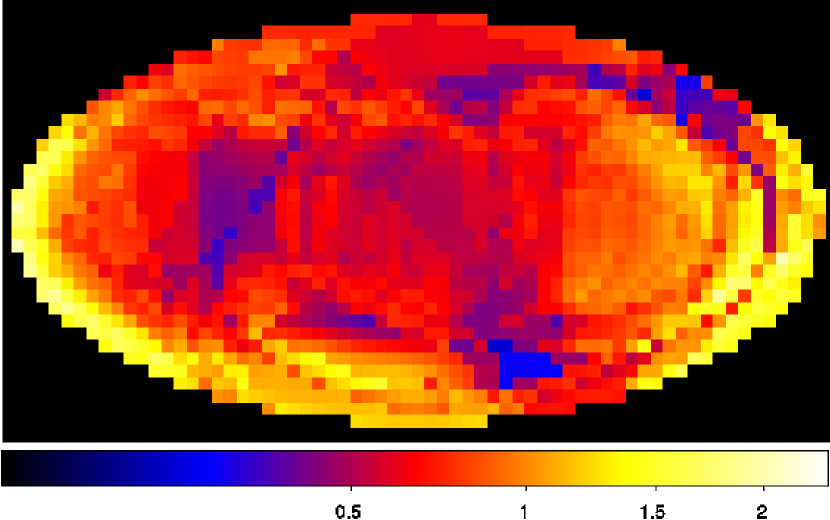
The resulting map of the number density of nearby AGNs over the sky is shown in Fig. 7. The density is given in units of Mpc-3 at luminosities higher than erg s-1 (17–60 keV), which is approximately the average local density of AGNs (Sazonov et al. 2007). Prominent large-scale concentrations of AGNs can be seen in the northern (to the right) and southern (to the left) Galactic hemispheres. We can assess the statistical significance of these anisotropies by considering the density measurements in statistically independent regions of the sky. Given the relatively large opening angle of our sampling cone, there are only 12 such independent directions on the whole sky. Since in our case the estimated density values are strongly affected by Poisson statistics, we constructed a maximum likelihood estimator in the form , where is the probability to detect sources in our detection cone if the expected number of sources is . The probability that the measured AGN number density distribution is a statistical realization of a homogeneous distribution is .
If we take into account that the high and low AGN number density regions well correlate with known (from surveys of infrared galaxies, e.g. Rowan-Robinson et al. 2000, and X-ray clusters of galaxies, e.g. Kocevski & Ebeling 2006) over- and under-dense regions in the local Universe, respectively, the statistical significance of the found spatial inhomogeneity will be much higher.
The discovered anisotropy of AGNs agrees well with the known distribution of matter in the local Universe. The large-scale feature in the northern Galactic hemisphere is consistent with the position of the highest mass concentrations in the local Universe: the nearby Virgo cluster ( Mpc, Fouqué et al. 2001; Tonry et al. 2000) and the more distant and massive Great Attractor ( Mpc, (1–5), Lynden-Bell et al. 1988; Tonry et al. 2000). The southern structure is consistent with the Perseus-Pisces supercluster ( Mpc, (7–9), Hanski et al. 2001).
To better demonstrate the similarity between the distributions of hard X-ray emitting AGNs and matter over the sky, we used the IRAS PSC redshift survey (Saunders et al. 2000). We selected galaxies located at distances Mpc and have far-infrared flux Jy. The IRAS PSCz survey covers approximately 83% of the sky due to presence of so-called Zone of avoidance, sky region to the north and to the south from the Galactic equator where Galaxy obcures the IR emission. In order to fill this gap during the construction of the map of densities of IR galaxies we assumed that the number density of galaxies hidden behind the Galactic plane (10 degrees to the north and to the south of the equator) is constant and equals to the all-sky average value. Contours of the number density map of IRAS galaxies are shown in Fig. 7. We emphasize that this comparison is rather approximate and only reflects the distribution of the projected mass. A detailed study of the correlation between the spatial distributions of hard X-ray emitting AGNs and matter in the local Universe will be presented elsewhere.
It is obvious from the above discussion that any estimate of the AGN surface number density based on a small area of the sky may be significantly biased. This was apparently the case for our survey in the region around the Coma cluster (Krivonos et al. 2005a), where a high surface number density of relatively nearby ( Mpc) AGNs was found (see Sect. 5). Indeed, the observed region is located approximately in the direction of the prominent large-scale structure in the northern Galactic hemisphere (see Fig. 7). To better demonstrate the strong contrast in the distribution of AGNs over the sky, we calculated the sensitivity-corrected – distributions of AGNs in the two hemispheres defined by the direction of motion of the Local Group: , as measured by IRAS (Lahav et al. 1988). These distributions are shown in Fig. 9. The counts of bright sources ( erg s-1 cm-2), for which our survey is almost 100% complete in both hemispheres, exhibit a contrast as high as .
In addition, we explicitly calculated the AGN luminosity functions in both hemispheres defined above and found their shapes to be consistent with that of the all-sky average luminosity function determined by Sazonov et al. (2007). This confirms that the found anisotropy mostly reflects the inhomogeneous distribution of matter in the local Universe rather than generic variations of the AGN luminosity function.
Figure 9 demonstrates that most of the observed anisotropy in the distribution of AGNs over the sky is due to closest (brightest) AGNs. Inclusion of sources located at progressively larger distances is expected to decrease the surface number density variations over the sky (Rowan-Robinson et al. 2000). To demonstrate this, we built a map of the number density of AGNs located at Mpc (Fig. 8), which should be compared with that for nearby AGNs ( Mpc, Fig. 7). It can be seen that the more distant AGNs are distributed more uniformly across the sky, although their distribution is still only marginally consistent with a homogeneous one: the corresponding probablity is .
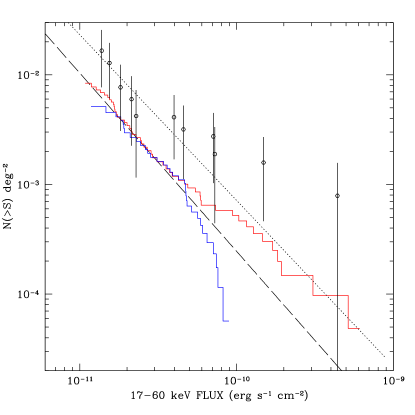
The open circles in Fig. 9 show the – distribution previously obtained in the Coma region. This number-flux relation lies higher than the all-sky average due to the overdensity of galaxies in this relatively small region of the sky (1,243 sq. deg), including two bright AGNs, NGC 4151 and NGC 4388. As a result, the resolved fraction of the CXB in this region is also high, %. As was already mentioned above, the resolved fraction of the CXB for the whole sky is only %. This last value is consistent with that reported by Beckmann et al. (2006) based on their analysis of INTEGRAL observations covering 25,000 sq. deg of the sky.
7 Galactic sources
The presence of a large number of Galactic sources in the INTEGRAL all-sky catalog is obvious from the large overdensity of sources near the Galactic plane. For demonstration we built sensitivity-corrected cumulative number-flux functions for all () sources in Galactic-latitude bins. The derived surface number density of sources as a function of Galactic latitude is shown in Fig. 10.
The vast majority of sources in the Galactic plane are low- and high-mass X-ray binaries ( in total, excluding unidentified sources). The number-flux function of all sources at (Fig. 11), is much flatter than that of extragalactic sources at (Forman et al. 1978) and reflects the luminosity functions of the dominant Galactic source populations (see e.g. Grimm et al. 2002). A detailed study of Galactic sources based on the INTEGRAL all-sky survey will be presented elsewhere.

8 Conclusion
We have presented the all-sky hard X-ray (17–60 keV) survey performed by the IBIS coded-mask telescope of the INTEGRAL observatory. The total dead-time corrected exposure of the survey is Ms. and of the whole sky have been covered down to limiting fluxes of and mCrab, respectively. The survey allowed us for the first time to study the population of hard X-ray sources in an unbiased manner, without strong influence of limited sky coverage.
Our catalog contains 400 detected sources. Of these, 213 are of Galactic origin (87 LMXBs, 74 HMXBs, 21 CVs, 6 active stars, and other types) and 136 are extragalactic, including 131 AGNs, 3 AGN candidates, and 3 clusters of galaxies. There remain 48 (including 40 detected with more than 5 significance on the time-averaged map) unidentified sources, only 6 of which are located in the extragalactic sky (). The catalog includes 137 sources discovered by INTEGRAL, 15 of which are reported here for the first time.
A number of sources detected by INTEGRAL/IBIS have counterparts in the TeV energy band. In this paper we for the first time presented the map of extended hard X-ray (17–60 keV) emission of the supernova remnant RX J1713.73946.
We explored the spatial distribution of AGNs in the local Universe. The cumulative – function of AGNs derived away from the Galactic plane (at ) can be well fit by a power law deg-2 (fluxes in mCrab units). This implies that % of the CXB at 17–60 keV is directly resolved by INTEGRAL.
We demonstrated that local ( Mpc) AGNs are inhomogeneously distributed in space, largely following the large-scale structure. In particular, significant concentrations of AGNs were found in the regions of the sky around the Virgo cluster, the Great Attractor, and the Perseus-Picses supercluster.
Acknowledgements.
The INTEGRAL data used here were obtained from the European and Russian INTEGRAL Science Data Centers. The work was supported by the President of the Russian Federation (through the program of support of leading scientific schools, project NSH-1100.2006.2), by the Presidium of the Russian Academy of Sciences/RAS (the program “Origin and evolution of stars and galaxies”), by the Division of Physical Sciences of the RAS (the program “Extended objects in the Universe”), and by the Russian Basic Research Foundation (projects 05-02-16540 and 04-02-17276). AL acknowledges the support from the Russian Science Support Foundation.9 References for the catalog
(1) Donato et al. (2005), (2) Sazonov et al. (2005), (3) Masetti et al. (2004), (4) Masetti et al. (2006c), (5) Brandt et al. (2005), (6) Sunyaev et al. (2003a), (7) Masetti et al. (2006e), (8) Masetti et al. (2006b), (9) Bassani et al. (2006), (10) Sguera et al. (2006), (11) Lutovinov et al. (2004a), (12) Lubinski et al. (2005), (13) den Hartog et al. (2004a), (14) Grebenev et al. (2004b), (15) Smith et al. (2006), (16) Kretschmar et al. (2004), (17) Chernyakova et al. (2005a), (18) in’t Zand & Heise (2004), (19) Rodriguez et al. (2004), (20) Morelli et al. (2006), (21) Revnivtsev et al. (2004b), (22) Kuulkers et al. (2006), (23) Revnivtsev et al. (2006), (24) Lutovinov & Revnivtsev (2003), (25) Lutovinov et al. (2005a), (26) Bykov et al. (2004), (27) Bassani et al. (2005), (29) Pavlinskii et al. (1992), (30) Lutovinov et al. (2003c), (31) in’t Zand (2005), (32) Bikmaev et al. (2006a), (33) Negueruela & Smith (2006), (34) Produit et al. (2003), (35) Barlow et al. (2005), (36) Barlow et al. (2006), (37) Walter et al. (2006), (38) Molkov et al. (2004), (39) Bykov et al. (2006), (40) Liu et al. (2000), (41) Liu et al. (2001), (42) Rodriguez et al. (2005), (43) den Hartog et al. (2005), (44) Bird et al. (2006a), (45) den Hartog et al. (2004b), (46) Ubertini et al. (2005), (47) Malizia et al. (2005), (48) Aleksandrovich et al. (1995), (49) Cornelisse et al. (2006), (50) Bikmaev et al. (2006b), (51) Chernyakova et al. (2005b), (52) Reig et al. (2005), (53) Hannikainen et al. (2003), (54) Sunyaev et al. (2003b), (55) Burenin et al. (2006b), (56) Negueruela et al. (2005), (57) Keek et al. (2006), (58) Krivonos et al. (2005b), (59) Grebenev et al. (2004a), (60) Burenin et al. (2006a), (61) Grebenev et al. (2005b), (62) Kuiper et al. (2006), (63) Masetti et al. (2006a), (64) Lutovinov et al. (2004b), (65) Tueller et al. (2005), (66) Halpern (2006), (67) Masetti et al. (2006), (68) Masetti et al. (2005), (69) Karasev et al. (2007), (70) Brandt et al. (2006), (71) Chernyakova et al. (2003), (72) Gaensicke et al. (2005), (73) Turler et al. (2005), (74) Grebenev et al. (2005a), (75) Gotz et al. (2006), (76) Krivonos et al. (2006), (77) Sazonov et al. (2007), (78) Rea et al. (2006), (79) Bélanger et al. (2006), (80) Palmer et al. (2005), (81) Torres et al. (2005), (82) Chelovekov et al. (2006), (83) Tomsick et al. (2006), (84) Revnivtsev et al. (2003a), (85) Courvoisier et al. (2003), (86) Walter et al. (2003), (87) Tomsick et al. (2003), (88) Revnivtsev et al. (2003b), (89) Patel et al. (2004), (90) Bodaghee et al. (2006), (91) Tomsick et al. (2004), (92) Molkov et al. (2003), (93) Lutovinov et al. (2005b), (94) Kuulkers et al. (2003), (95) Revnivtsev et al. (2003c), (96) Lutovinov et al. (2003a), (97) Lutovinov et al. (2005c), (98) Revnivtsev et al. (2004c), (99) Augello et al. (2003), (100) Lutovinov et al. (2003b) (101) Sazonov et al., in preparation.
References
- Aharonian et al. (2006) Aharonian, F., et al. 2006, A&A, 449, 223
- Aleksandrovich et al. (1995) Aleksandrovich, N. L., Aref’ev, V. A., Borozdin, K. N., Syunyaev, R. A., & Skinner, G. K. 1995, Astronomy Letters, 21, 431
- Augello et al. (2003) Augello, G., Iaria, R., Robba, N., et al. 2003, ApJ, 596, L63
- Bahcall & Burgett (1986) Bahcall N. A., Burgett W. S., 1986, ApJ, 300, L35
- Barlow et al. (2005) Barlow, E. J., Bird, A., Clark, D., et al. 2005, A&A, 437, L27
- Barlow et al. (2006) Barlow, E. J., Knigge, C., Bird, A. J., Dean, A. J., Clark, D. J., Hill, A. B., Molina, M., & Sguera, V. 2006, MNRAS, 372, 234
- Bassani et al. (2005) Bassani, L., De Rosa, A., Bazzano, A., Bird, A.J., Dean, A.J., Gehrels, N., et al., 2005, ApJ, 634, L21
- Bassani et al. (2006) Bassani, L., Molina, M., Malizia, A., et al., 2006, ApJ, 636, L65
- Beckmann et al. (2006) Beckmann V., Soldi S., Shrader C. R., Gehrels N., Produit N., 2006, ApJ, 652, 126
- Bélanger et al. (2006) Bélanger G., Goldwurm, A., Renaud, M., et al. 2006, ApJ, 636, 275
- Bikmaev et al. (2006a) Bikmaev, I.F., Sunyaev, R.A., Revnivtsev, M.G., & Burenin, R.A., 2006a, Astron. Lett., 32, 221
- Bikmaev et al. (2006b) Bikmaev, I.F., Sunyaev, R.A., Revnivtsev, M.G., & Burenin, R.A., 2006b, Astron. Lett., 32, 588
- Bird et al. (2006a) Bird, A. J., Barlow, E. J., Bassani, L., et al. 2006, ApJ, 636, 765
- Bird et al. (2006b) Bird A. J.,Malizia A., Bazzano A., Barlow E. J., Bassani L., Hill A. B., Belanger G., Capitanio F., et al. 2006, astro, arXiv:astro-ph/0611493
- Bodaghee et al. (2006) Bodaghee, A., Walter, R., Zurita Heras, J., et al. 2006, A&A, 447, 1027
- Brandt et al. (2005) Brandt, S., Kuulkers, E., Bazzano, A., et al. 2005, Astron. Telegram, 622, 1
- Brandt et al. (2006) Brandt, S., Budtz-Jørgensen, C., & Chenevez, J. 2006, Astron. Telegram, 778, 1
- Burenin et al. (2006a) Burenin, R., Mescheryakov, A., Revnivtsev, M., Bikmaev, I., & Sunyaev, R. 2006a, The Astronomer’s Telegram, 880, 1
- Burenin et al. (2006b) Burenin, R., Mescheryakov, A., Sazonov, S., Revnivtsev, M., Bikmaev, I., & Sunyaev, R. 2006b, Astron. Telegram, 883, 1
- Bykov et al. (2004) Bykov, A., Krassilshchikov, A., Uvarov, Yu., et al. 2004, A&A, 427, L21
- Bykov et al. (2006) Bykov, A., Krassilshchikov, A., Uvarov, Yu., et al. 2006, ApJ, 649, L21
- Chelovekov et al. (2006) Chelovekov, I., Grebenev, S., Sunyaev, R. 2006, Astronomy Letters, 32, 456
- Chernyakova et al. (2003) Chernyakova, M., Lutovinov, A., Capitanio, F., Lund, N., & Gehrels, N. 2003, Astron. Telegram, 157, 1
- Chernyakova et al. (2005a) Chernyakova, M., Courvoisier, T., Rodriguez, J., Lutovinov, A. 2005a, Astron. Telegram, 519, 1
- Chernyakova et al. (2005b) Chernyakova, M., Lutovinov, A., Rodríguez, J., & Revnivtsev, M. 2005b, MNRAS, 364, 455
- Cornelisse et al. (2006) Cornelisse, R., Charles, P. A., & Robertson, C. 2006, MNRAS, 366, 918
- Courvoisier et al. (2003) Courvoisier, T., Walter, R., Rodriguez, J., Bouchet, L., Lutovinov A. 2003, IAUC 8063, 1
- Crawford et al. (1970) Crawford, D. F., Jauncey, D. L., & Murdoch, H. S. 1970, ApJ, 162, 405
- Donato et al. (2005) Donato, D., Sambruna, R.M., & Gliozzi, M., 2005, A&A, 433, 1163
- Davis & Peebles (1983) Davis M., Peebles P. J. E., 1983, ARA&A, 21, 109
- den Hartog et al. (2004a) den Hartog, P., Hermsen, W., Kuiper, L., et al. 2004a, Astron. Telegram, 261, 1
- den Hartog et al. (2004b) den Hartog, P., Kuiper, L., Corbet, R., et al. 2004b, Astron. Telegram, 281, 1
- den Hartog et al. (2005) den Hartog, P., Kuiper, L., Hermsen, W., et al. 2005, Astron. Telegram, 394, 1
- Hopkins et al. (2006) Hopkins, P. F., Hernquist, L., Cox, T. J., Di Matteo, T., Robertson, B., & Springel, V. 2006, ApJS, 163, 1
- Fenimore et al. (1981) Fenimore, E. E., Cannon T. M., 1981 Applied Optics, 20, 1858.
- Forman et al. (1978) Forman, W., Jones, C., Cominsky, L., Julien, P., Murray, S., Peters, G., Tananbaum, H., & Giacconi, R. 1978, ApJS, 38, 357
- Fouqué et al. (2001) Fouqué, P., Solanes, J. M., Sanchis, T., & Balkowski, C. 2001, A&A, 375, 770
- Gaensicke et al. (2005) Gaensicke, B. T., Marsh, T. R, Edge, A., et al. 2005, Astron. Telegram, 463, 1
- Górski et al. (2005) Górski, K. M., Hivon, E., Banday, A. J., Wandelt, B. D., Hansen, F. K., Reinecke, M., & Bartelmann, M. 2005, ApJ, 622, 759
- Gotz et al. (2006) Gotz, D., Schanne, S., Rodriguez, J., Leyder, J.-C., von Kienlin, A., Mowlavi, N., & Mereghetti, S. 2006, Astron. Telegram, 813, 1
- Grebenev et al. (2004a) Grebenev, S. A., Ubertini, P., Chenevez, J., Orr, A., & Sunyaev, R. A. 2004a, Astron. Telegram, 275, 1
- Grebenev et al. (2004b) Grebenev, S., Ubertini, P., Chenevez, J., et al. 2004b, Astron. Telegram, 350, 1
- Grebenev et al. (2005a) Grebenev, S. A., Molkov, S. V., & Sunyaev, R. A. 2005a, Astron. Telegram, 467, 1
- Grebenev et al. (2005b) Grebenev, S. A., Molkov, S. V., & Sunyaev, R. A. 2005b, The Astronomer’s Telegram, 616, 1
- Grimm et al. (2002) Grimm, H.-J., Gilfanov, M., & Sunyaev, R. 2002, A&A, 391, 923
- Gros et al. (2003) Gros, A., Goldwurm, A., Cadolle-Bel, M., Goldoni, P., Rodriguez, J., Foschini, L., Del Santo, M., & Blay, P. 2003, A&A, 411, L179
- Halpern (2006) Halpern, J. P. 2006, Astron. Telegram, 847, 1
- Hannikainen et al. (2003) Hannikainen, D., Rodriguez, J., Pottschmidt, K. et al. 2003, IAUC 8088, 1
- Hanski et al. (2001) Hanski, M. O., Theureau, G., Ekholm, T., & Teerikorpi, P. 2001, A&A, 378, 345
- in’t Zand & Heise (2004) in’t Zand, J. J. M., & Heise, J. 2004, Astron. Telegram, 362, 1
- in’t Zand (2005) in’t Zand, J. J. M. 2005, A&A, 441, L1
- Karasev et al. (2007) Karasev, D., Lutovinov, A., Grebenev, S. 2007, Astronomy Letters, 33, 135
- Keek et al. (2006) Keek, S., Kuiper, L., & Hermsen, W. 2006, The Astronomer’s Telegram, 810, 1
- Kocevski & Ebeling (2006) Kocevski D. D., Ebeling H., 2006, ApJ, 645, 1043
- Kormendy (2001) Kormendy, J. 2001, Revista Mexicana de Astronomia y Astrofisica Conference Series, 10, 69
- Kormendy & Richstone (1995) Kormendy, J., & Richstone, D. 1995, ARA&A, 33, 581
- Koyama et al. (1995) Koyama, K., Petre, R., Gotthelf, E. V., Hwang, U., Matsuura, M., Ozaki, M., & Holt, S. S. 1995, Nature, 378, 255
- Koyama et al. (1997) Koyama, K., Kinugasa, K., Matsuzaki, K., Nishiuchi, M., Sugizaki, M., Torii, K., Yamauchi, S., & Aschenbach, B. 1997, PASJ, 49, L7
- Kretschmar et al. (2004) Kretschmar, P., Mereghetti, S., Hermsen, W., et al. 2004, Astron. Telegram, 345, 1
- Krivonos et al. (2005a) Krivonos, R., Vikhlinin, A., Churazov, E., Lutovinov, A., Molkov, S., & Sunyaev, R., 2005a, ApJ, 625, 89
- Krivonos et al. (2005b) Krivonos, R., Molkov, S., Revnivtsev, M., Grebenev, S., Sunyaev, R., & Paizis, A. 2005b, Astron. Telegram, 545, 1
- Krivonos et al. (2006) Krivonos, R., Revnivtsev, M., Sazonov, S., Churazov, E., & Sunyaev, R. 2006, IAU Symposium, 230, 455
- Krivonos et al. (2006) Krivonos, R., Revnivtsev, M., Churazov, E., et al. 2006, A&A, accepted (astro-ph/0605420)
- Kuiper et al. (2006) Kuiper, L., Keek, S., Hermsen, W., Jonker, P. G., & Steeghs, D. 2006, Astron. Telegram, 684, 1
- Kuulkers et al. (2003) Kuulkers, E., Lutovinov, A., Parmar, A., et al. 2003, Astron. Telegram, 149, 1
- Kuulkers et al. (2006) Kuulkers, E., Shaw, S., Paizis, A., et al. 2006, Astron. Telegram, 874, 1
- Lahav et al. (1988) Lahav, O., Lynden-Bell, D., & Rowan-Robinson, M. 1988, MNRAS, 234, 677
- Lahav et al. (1989) Lahav, O., Fabian, A. C., Edge, A. C., & Putney, A. 1989, MNRAS, 238, 881
- Levine et al. (1984) Levine, A. M., et al. 1984, ApJS, 54, 581
- Liu et al. (2000) Liu, Q. Z., van Paradijs, J., & van den Heuvel, E. P. J. 2000, A&AS, 147, 25
- Liu et al. (2001) Liu, Q. Z., van Paradijs, J., & van den Heuvel, E. P. J. 2001, A&A, 368, 1021
- Lubinski et al. (2005) Lubinski, P., Gadolle Bel, M., von Kienlin, A., et al. 2005, Astron. Telegram, 469, 1
- Lutovinov & Revnivtsev (2003) Lutovinov, A. A., & Revnivtsev, M. G. 2003, Astronomy Letters, 29, 719
- Lutovinov et al. (2003a) Lutovinov, A., Walter, R., Belanger, R., et al. 2003a, Astron. Telegram, 155, 1
- Lutovinov et al. (2003b) Lutovinov, A., Shaw, S., Foschini, L., Paul, J. 2003b, Astron. Telegram, 154, 1
- Lutovinov et al. (2003c) Lutovinov, A., Rodriguez, J., Produit, N., Paul, J. 2003c, Astron. Telegram, 151, 1
- Lutovinov et al. (2004a) Lutovinov, A., Rodriguez, J., Budtz-Jorgensen, C., et al. 2004a, Astron. Telegram, 329, 1
- Lutovinov et al. (2004b) Lutovinov, A., Bel, M. C., Belanger, G., Goldwurm, A., Budtz-Jorgensen, C., Mowlavi, N., Paul, J., & Orr, A. 2004, Astron. Telegram, 328, 1
- Lutovinov et al. (2005a) Lutovinov, A., Rodriguez, J., Revnivtsev, M., & Shtykovskiy, P. 2005a, A&A, 433, L41
- Lutovinov et al. (2005b) Lutovinov, A., Revnivtsev, M., Gilfanov, M., et al. 2005b, A&A, 444, 821
- Lutovinov et al. (2005c) Lutovinov, A., Revnivtsev, M., Molkov, S., Sunyaev, R. 2005c, A&A, 430,997
- Lynden-Bell et al. (1988) Lynden-Bell, D., Faber, S. M., Burstein, D., Davies, R. L., Dressler, A., Terlevich, R. J., & Wegner, G. 1988, ApJ, 326, 19
- Malizia et al. (2005) Malizia, A., Bassani, L., Stephen, J., et al. 2005, ApJ, 630, L157
- Masetti et al. (2004) Masetti, N., Palazzi, E., Bassani, L., Malizia, A., & Stephen, J.B., 2004, A&A, 426, L41
- Masetti et al. (2005) Masetti, N., Bassani, L., Bird, A., Bassano, A. 2005, Astron. Telegram, 528,1
- Masetti et al. (2006a) Masetti, N., Morelli, L., Palazzi, E., Stephen, J., Bazzano, A., Dean, A. J., Walter, R., & Minniti, D. 2006a, Astron. Telegram, 783, 1
- Masetti et al. (2006b) Masetti, N., Morelli, L., Palazzi, E., Galaz, G., Bassani, L., Bazzano, A., et al., 2006b, A&A, 459, 21
- Masetti et al. (2006c) Masetti, N., Pretorius, M.L., Palazzi, E., Bassani, L., Bazzano, A., & Bird, A.J, 2006c, A&A, 449, 1139
- Masetti et al. (2006) Masetti, N., Bassani, L., Dean, A. J., Ubertini, P., & Walter, R. 2006d, The Astronomer’s Telegram, 715, 1
- Masetti et al. (2006e) Masetti, N., Bassani, L., Bazzano, A., Bird, A.J., Dean, A.J., Malizia, A., et al., 2006e, A&A, 455, 11
- Miyaji & Boldt (1990) Miyaji, T., & Boldt, E. 1990, ApJ, 353, L3
- Molkov et al. (2003) Molkov, S., Mowlavi, N., Goldwurm, A., et al. 2003, Astron. Telegram, 176, 1
- Molkov et al. (2004) Molkov S. V., Cherepashchuk A. M., Lutovinov A. A., Revnivtsev M. G., Postnov K. A., Sunyaev R. A., 2004, AstL, 30, 534
- Morelli et al. (2006) Morelli, L., Masetti, N., Bassani, L., et al., 2006, Astron. Telegram, 785, 1
- Negueruela et al. (2005) Negueruela, I., Smith, D., Chaty, S. 2005, Astron. Telegram, 470, 1
- Negueruela & Smith (2006) Negueruela, I., & Smith, D. 2006, Astron. Telegram, 831, 1
- Neronov et al. (2005) Neronov A., Chernyakova M., Courvoisier T. J. -., Walter R., 2005, astro, arXiv:astro-ph/0506437
- Palmer et al. (2005) Palmer, D. M., Barthelmey, S. D., Cummings, J. R., Gehrels, N., Krimm, H. A., Markwardt, C. B., Sakamoto, T., & Tueller, J. 2005, The Astronomer’s Telegram, 546, 1
- Patel et al. (2004) Patel, S., Kouveliotou, C., Tennant, A., et al. 2004, ApJ, 602, L45
- Pavlinskii et al. (1992) Pavlinskii, M. N., Grebenev, S. A., & Syunyaev, R. A. 1992, Soviet Astronomy Letters, 18, 88
- Pfeffermann & Aschenbach (1996) Pfeffermann, E., & Aschenbach, B. 1996, Roentgenstrahlung from the Universe, 267
- Plionis & Kolokotronis (1998) Plionis, M., & Kolokotronis, V. 1998, ApJ, 500, 1
- Produit et al. (2003) Produit, N., Ballet, J., Mowlavi, N. 2003, Astron. Telegram., 278, 1
- Protheroe et al. (1980) Protheroe, R. J., Wolfendale, A. W., & Wdowczyk, J. 1980, MNRAS, 192, 445
- Rea et al. (2006) Rea, N., Testa, V., Israel, G., et al. 2006, Astron. Telegram, 713, 1
- Rees (1980) Rees M. J., 1980, IAUS, 92, 207
- Reig et al. (2005) Reig, P., Negueruela, I., Papamastorakis, G., Manousakis, A., & Kougentakis, T. 2005, A&A, 440, 637
- Renaud et al. (2006a) Renaud, M., Gros, A., Lebrun, F., Terrier, R., Goldwurm, A., Reynolds, S., & Kalemci, E. 2006a, A&A, 456, 389
- Renaud et al. (2006b) Renaud, M., Bélanger, G., Paul, J., Lebrun, F., & Terrier, R. 2006b, A&A, 453, L5
- Revnivtsev et al. (2003a) Revnivtsev, M. G., Sazonov, S. Y., Gilfanov M. R., Sunyaev, R. A. 2003a, Astronomy Letters, 29, 587
- Revnivtsev et al. (2003b) Revnivtsev, M., Tuerler, M., Del Santo, M., et al. 2003b, IAUC 8097, 1
- Revnivtsev et al. (2003c) Revnivtsev, M., Chernyakova, M., Capitanio, F., et al. 2003c, Astron. Telegram, 132, 1
- Revnivtsev et al. (2004a) Revnivtsev, M., Sazonov, S., Jahoda, K., & Gilfanov, M., 2004a, A&A, 418, 927
- Revnivtsev et al. (2004) Revnivtsev, M. G., Sunyaev, R. A., Gilfanov, M. R., Churazov, E. M., Goldwurm, A., Paul, J., Mandrou, P., & Roques, J. P. 2004, Astronomy Letters, 30, 527
- Revnivtsev et al. (2004b) Revnivtsev, M., Sazonov, S., Churazov, E., et al. 2004b, A&A, 425, L49
- Revnivtsev et al. (2004c) Revnivtsev, M., Sunyaev, R., Varshalovich, D., et al. 2004c, Astronomy Letters, 30, 382
- Revnivtsev et al. (2006) Revnivtsev, M. G., Sazonov, S. Y., Molkov, S. V., Lutovinov, A. A., Churazov, E. M., & Sunyaev, R. A. 2006, Astronomy Letters, 32, 145
- Richstone et al. (1998) Richstone, D., et al. 1998, Nature, 395, A14
- Rodriguez et al. (2004) Rodriguez, J., Domingo Garau, A., Grebenev, S., et al. 2004, Astron. telegram, 340, 1
- Rodriguez et al. (2005) Rodriguez, J., Cabanac, C., Hannikainen, D. C., Beckmann, V., Shaw, S. E., & Schultz, J. 2005, A&A, 432, 235
- Rowan-Robinson et al. (2000) Rowan-Robinson M., et al., 2000, MNRAS, 314, 375
- Saunders et al. (2000) Saunders, W., et al. 2000, MNRAS, 317, 55
- Sazonov et al. (2005) Sazonov, S., Churazov, E., Revnivtsev, M., Vikhlinin, A., & Sunyaev, R., 2005, A&A, 444, L37
- Sazonov et al. (2007) Sazonov, S., Revnivtsev, M., Krivonos, R., Churazov, & Sunyaev, R., 2006, A&A, 462, 57
- Sguera et al. (2006) Sguera, V., Bazzano, A., Bird, A., et al. 2006, ApJ, 646, 452
- Skinner et al. (1981) Skinner, G. K. et al. 1987, Astroph.Sp.Sci., 136, 337-349.
- Smith et al. (2006) Smith, D. M., Heindl, W. A., Markwardt, C. B., Swank, J. H., Negueruela, I., Harrison, T. E., & Huss, L. 2006, ApJ, 638, 974
- Slane et al. (1999) Slane, P., Gaensler, B. M., Dame, T. M., Hughes, J. P., Plucinsky, P. P., & Green, A. 1999, ApJ, 525, 357
- Sunyaev et al. (2003a) Sunyaev, R., Lutovinov, A., Molkov, S., Deluit, S. 2003a, Astron. Telegram, 181, 1
- Sunyaev et al. (2003b) Sunyaev, R., Grebenev, S., Lutovinov, A., et al. 2003b, Astron. Telegram, 192, 1
- Tonry et al. (2000) Tonry, J. L., Blakeslee, J. P., Ajhar, E. A., & Dressler, A. 2000, ApJ, 530, 625
- Tomsick et al. (2003) Tomsick, J., Lingenfelter, R., Walter, R., et al. 2003, IAUC 8076, 1
- Tomsick et al. (2004) Tomsick, J., Lingenfelter, R., Corbel, S., Goldwurm, A., Kaaret, P. 2004, Astron. Telegram, 224, 1
- Tomsick et al. (2006) Tomsick, J., Chaty, S., Rodriguez, J., et al. 2006, ApJ, 647, 1309
- Toor & Seward (1974) Toor, A., & Seward, F. D. 1974, AJ, 79, 995
- Torres et al. (2005) Torres, M. A. P., et al. 2005, Astron. Telegram, 551, 1
- Tueller et al. (2005) Tueller, J., Barthelmy, S., Burrows, D., et al. 2005, Astron. Telegram, 669, 1
- Turler et al. (2005) Turler, M., Bel, M. C., Diehl, R., Westergaard, N.-J., McBreen, B., Williams, O. R., Grebenev, S. A., & Lutovinov, A. 2005, The Astronomer’s Telegram, 624, 1
- Ubertini et al. (2003) Ubertini P., et al., 2003, A&A, 411, L131
- Ubertini et al. (2005) Ubertini, P., Bassani, L., Malizia, A., et al. 2005, ApJ, 629, L109
- Walter et al. (2003) Walter, R., Bodaghee, A., Barlow, E., et al. 2003, Astron. Telegram, 229, 1
- Walter et al. (2006) Walter, R., Zurita Heras, J., Bassani, L., et al. 2006, A&A, 453, 133
- Winkler et al. (2003) Winkler, C., Courvoisier, T., Di Cocco, G., et al. 2003, A&A, 411, L1
| Id | Name | RA | Dec | Type | Counterpart | Notes | |
|---|---|---|---|---|---|---|---|
| 1 | IGR J00234+6141 | 5.723 | 61.700 | CV | 43,50 | ||
| 2 | TYCHO SNR | 6.334 | 64.150 | SNR | |||
| 3 | V709 Cas | 7.205 | 59.300 | CV | 36 | ||
| 4 | IGR J00291+5934 | 7.254 | 59.563 | LMXB | |||
| 5 | 87GB003300.9+593328 | 8.977 | 59.827 | AGN | 1 | ||
| 6 | IGR J00370+6122 | 9.286 | 61.386 | HMXB | 45 | ||
| 7 | MRK 348 | 12.181 | 31.947 | AGN | NGC 262 | ||
| 8 | 1WGA J0053.8-722 | 13.526 | -72.468 | HMXB | |||
| 9 | Gamma Cas | 14.176 | 60.712 | Star | |||
| 10 | SMC X-1 | 19.299 | -73.449 | HMXB | |||
| 11 | 1A 0114+650 | 19.516 | 65.289 | HMXB | |||
| 12 | 4U 0115+63 | 19.625 | 63.746 | HMXB | |||
| 13 | NGC 0526A | 20.951 | -34.925 | AGN | |||
| 14 | IGR J01363+6610 | 24.060 | 66.188 | R185R185footnotemark: | HMXB | 59,52 | |
| 15 | RX J0137.7+5814 | 24.443 | 58.221 | ||||
| 16 | ESO 297- G 018 | 24.639 | -40.020 | R374R374footnotemark: | AGN | ||
| 17 | 4U 0142+61 | 26.630 | 61.738 | AXP | |||
| 18 | RJ 0146.9+6121 | 26.744 | 61.351 | HMXB | |||
| 19 | IGR J01528-0326 | 28.208 | -3.450 | AGN | MCG -01-05-047 | 55 | |
| 20 | NGC 788 | 30.277 | -6.819 | AGN | |||
| 21 | IGR J02095+5226 | 32.392 | 52.458 | AGN | LEDA 138501 | ||
| 1ES 0206+522 | |||||||
| 22 | MRK 1040 | 37.063 | 31.316 | AGN | NGC 931 | ||
| 23 | IGR J02343+3229 | 38.599 | 32.475 | AGN | NGC 973 | 55 | |
| IRAS 02313+3217 | |||||||
| 24 | NGC 1052 | 40.267 | -8.236 | AGN | |||
| 25 | NGC 1068 | 40.687 | -0.010 | AGN | |||
| 26 | 4U 0241+61 | 41.262 | 62.464 | AGN | |||
| 27 | IGR J02466-4222 | 41.644 | -42.360 | AGN? | MCG -07-06-018 | 77,101 | |
| 28 | IGR J02524-0829 | 43.115 | -8.486 | AGN? | MCG-02-08-014 | ||
| 29 | NGC 1142 | 43.804 | -0.186 | AGN | NGC 1144 | ||
| 30 | PERSEUS CLUSTERaaThermal emission dominates. | 49.973 | 41.509 | Cluster | |||
| 31 | 1H 0323+342 | 51.140 | 34.168 | AGN | |||
| 32 | GK Per | 52.777 | 43.880 | CV | |||
| 33 | IGR J03334+3718 | 53.362 | 37.313 | AGN | 60,77 | ||
| 34 | NGC 1365 | 53.428 | -36.170 | AGN | |||
| 35 | V 0332+53 | 53.751 | 53.172 | HMXB | |||
| 36 | 4U 0352+30 | 58.849 | 31.036 | HMXB | X Per | ||
| 37 | 3C111 | 64.581 | 38.013 | AGN | |||
| 38 | LEDA 168563 | 73.044 | 49.531 | AGN | 1RXS J045205.0+493248 | ||
| 39 | ESO 033-G002 | 74.001 | -75.538 | AGN | |||
| 40 | IGR J05007-7047 | 75.203 | -70.775 | HMXB | IGR J05009-7044 | 2 | |
| 41 | V1062 Tau | 75.617 | 24.732 | R102R102footnotemark: | CV | ||
| 42 | IRAS 05078+1626 | 77.705 | 16.513 | AGN | |||
| 43 | 4U 0513-40 | 78.534 | -40.069 | LMXB | |||
| 44 | AKN 120 | 79.026 | -0.140 | AGN | |||
| 45 | IGR J05305-6559bbSpatial confusion, source flux should be taken with the caution. | 82.636 | -65.984 | ||||
| 46 | LMC X-4 | 83.210 | -66.367 | HMXB | |||
| 47 | Crab | 83.632 | 22.016 | PSR | |||
| 48 | TW Pic | 83.689 | -57.988 | CV | |||
| 49 | A 0535+262 | 84.735 | 26.324 | HMXB | |||
| 50 | LMC X-1 | 84.912 | -69.748 | HMXB | |||
| 51 | PSR 0540-69 | 85.005 | -69.338 | PSR | |||
| 52 | BY Cam | 85.713 | 60.868 | CV | 36 | ||
| 53 | MCG 8-11-11 | 88.801 | 46.437 | AGN | |||
| 54 | IRAS 05589+2828 | 90.601 | 28.461 | AGN | |||
| 55 | ESO 005- G 004 | 92.575 | -86.554 | AGN | |||
| 56 | MRK 3 | 93.908 | 71.036 | AGN | |||
| 57 | 4U 0614+091 | 94.282 | 9.139 | LMXB | |||
| 58 | IGR J06239-6052bbSpatial confusion, source flux should be taken with the caution. | 95.936 | -60.974 | ||||
| 59 | MRK 6 | 103.048 | 74.423 | AGN | |||
| 60 | IGR J07264-3553 | 111.595 | -35.900 | AGN | LEDA 096373 | ||
| 61 | EXO 0748-676 | 117.146 | -67.754 | LMXB | |||
| 62 | IGR J07563-4137 | 119.055 | -41.638 | AGN | IGR J07565-4139 | 44,2 | |
| 2MASX J07561963-4137420 | |||||||
| 63 | IGR J07597-3842 | 119.934 | -38.727 | AGN | 13,8 | ||
| 64 | ESO 209-G012 | 120.496 | -49.734 | AGN | |||
| 65 | IGR J08023-6954 | 120.762 | -69.924 | 23 | |||
| 66 | PG 0804+761 | 122.952 | 76.102 | AGN | |||
| 67 | Vela pulsar | 128.835 | -45.182 | PSR | |||
| 68 | 4U 0836-429 | 129.354 | -42.894 | LMXB | |||
| 69 | FAIRALL 1146 | 129.621 | -35.983 | AGN | |||
| 70 | IGR J08408-4503 | 130.218 | -45.056 | HMXB | 75 | ||
| 71 | S5 0836+71 | 130.340 | 70.902 | AGN | 1 | ||
| 72 | Vela X-1 | 135.531 | -40.555 | HMXB | |||
| 73 | IGR J09026-4812 | 135.648 | -48.221 | 44 | |||
| 74 | IRAS 09149-6206 | 139.043 | -62.330 | AGN | |||
| 75 | X 0918-548 | 140.102 | -55.196 | LMXB | |||
| 76 | SWIFT J0920.8-0805 | 140.213 | -8.086 | AGN | MCG-01-24-012 | ||
| 77 | IGR J09251+5219 | 141.274 | 52.331 | AGN | Mrk 110 | ||
| 78 | IGR J09446-2636ccNewly discovered sources in this survey. | 146.124 | -26.628 | AGN | 1RXS J094436.5-263353 | ||
| 6dF J0944370-263356 | |||||||
| 79 | NGC 2992 | 146.431 | -14.335 | AGN | |||
| 80 | MCG-5-23-16 | 146.916 | -30.947 | AGN | ESO 434-G040 | ||
| 81 | IGR J09522-6231 | 148.025 | -62.523 | 77 | |||
| 82 | NGC 3081 | 149.859 | -22.816 | AGN | |||
| 83 | IGR J10095-4248 | 152.449 | -42.800 | AGN | ESO 263-G013 | ||
| 84 | GRO J1008-57 | 152.447 | -58.298 | HMXB | |||
| 85 | IGR J10100-5655 | 152.529 | -56.914 | HMXB | 62,8 | ||
| 86 | IGR J10109-5746 | 152.753 | -57.795 | SimbStar? | 2RXP J101103.0-574810 | 23,67 | |
| 87 | NGC 3227 | 155.876 | 19.867 | AGN | |||
| 88 | IGR J10252-6829 | 156.287 | -68.460 | 23 | |||
| 89 | NGC 3281 | 157.935 | -34.855 | AGN | |||
| 90 | 3U 1022-55 | 159.401 | -56.801 | R85R85footnotemark: | HMXB | ||
| 91 | IGR J10386-4947 | 159.676 | -49.789 | AGN | SWIFT J1038.8-4942 | 20 | |
| 92 | IGR J10404-4625 | 160.124 | -46.391 | AGN | LEDA 93974 | 44,4 | |
| 93 | Car | 161.189 | -59.719 | Star | |||
| 94 | IGR J11085-5100 | 167.144 | -51.014 | 23 | |||
| 95 | Cen X-3 | 170.306 | -60.628 | HMXB | |||
| 96 | IGR J11215-5952 | 170.429 | -59.869 | HMXB | 12,56 | ||
| 97 | IGR J11305-6256 | 172.779 | -62.945 | XRB | 34,4 | ||
| 98 | IGR J11321-5311 | 173.047 | -53.200 | 58 | |||
| 99 | NGC 3783 | 174.739 | -37.766 | AGN | |||
| 100 | IGR J11395-6520 | 174.858 | -65.406 | R88R88footnotemark: | RS CVn? | HD 101379 | |
| 101 | IGR J11435-6109 | 176.031 | -61.106 | HMXB | 14,18 | ||
| 102 | A 1145.1-6141 | 176.870 | -61.956 | HMXB | |||
| 103 | 4U 1145-619bbSpatial confusion, source flux should be taken with the caution. | 177.000 | -62.207 | HMXB | |||
| 104 | IGR J12026-5349 | 180.686 | -53.823 | AGN | WKK0560 | 23,2 | |
| 105 | NGC 4051 | 180.781 | 44.525 | AGN | |||
| 106 | NGC 4138 | 182.352 | 43.672 | AGN | |||
| 107 | NGC 4151 | 182.634 | 39.408 | AGN | |||
| 108 | 1ES 1210-646 | 183.269 | -64.917 | ||||
| 109 | IGR J12143+2933 | 183.597 | 29.561 | AGN | WAS 49B | ||
| 110 | NGC 4253 | 184.592 | 29.825 | AGN | |||
| 111 | NGC 4258 | 184.747 | 47.309 | AGN | |||
| 112 | PKS 1219+04 | 185.588 | 4.230 | AGN | |||
| 113 | MRK 50 | 185.860 | 2.676 | AGN | |||
| 114 | NGC 4388 | 186.444 | 12.664 | AGN | |||
| 115 | NGC 4395 | 186.462 | 33.565 | AGN | |||
| 116 | GX 301-2 | 186.651 | -62.772 | HMXB | |||
| 117 | XSS J12270-4859 | 186.978 | -48.907 | CV | 63 | ||
| 118 | 3C273 | 187.271 | 2.050 | AGN | |||
| 119 | IGR J12349-6434 | 188.724 | -64.565 | SimbStar? | RT Cru | 17,68 | |
| 120 | NGC 4507 | 188.908 | -39.905 | AGN | |||
| 121 | IGR J12391-1612 | 189.792 | -16.186 | AGN | LEDA 170194 | 23,2 | |
| XSS 12389-1614 | |||||||
| 122 | NGC 4593 | 189.910 | -5.347 | AGN | |||
| 123 | WKK 1263 | 190.356 | -57.841 | AGN | |||
| 124 | PKS 1241-399 | 191.057 | -40.115 | AGN | |||
| 125 | 4U 1246-588 | 192.386 | -59.090 | HMXB? | 40 | ||
| 126 | 3C279 | 194.030 | -5.779 | AGN | |||
| 127 | 2S 1254-690 | 194.392 | -69.296 | LMXB | 41 | ||
| 128 | Coma | 194.865 | 27.938 | Cluster | |||
| 129 | 1RXP J130159.6-635806bbSpatial confusion, source flux should be taken with the caution. | 195.495 | -63.969 | HMXB | 51 | ||
| 130 | PSR B1259-63bbSpatial confusion, source flux should be taken with the caution. | 195.699 | -63.836 | HMXB | |||
| 131 | MRK 783 | 195.741 | 16.361 | AGN | |||
| 132 | IGR J13038+5348 | 195.951 | 53.798 | AGN | MCG+09-21-096 | 60,77 | |
| 133 | NGC 4945 | 196.364 | -49.470 | AGN | |||
| 134 | ESO 323-G077 | 196.607 | -40.423 | AGN | |||
| 135 | IGR J13091+1137 | 197.270 | 11.619 | AGN | NGC 4992 | 23,2 | |
| 136 | IGR J13109-5552 | 197.689 | -55.865 | PMN J1310-5552 | 23 | ||
| 137 | NGC 5033 | 198.350 | 36.572 | AGN | |||
| 138 | IGR J13149+4422ccNewly discovered sources in this survey. | 198.743 | 44.389 | AGN | Mrk 248 | ||
| 139 | Cen A | 201.363 | -43.019 | AGN | |||
| 140 | 4U 1323-619 | 201.643 | -62.136 | LMXB | |||
| 141 | IGR J13290-6323ccNewly discovered sources in this survey. | 202.268 | -63.392 | R92R92footnotemark: | |||
| 142 | ESO 383-G018 | 203.332 | -34.030 | AGN | |||
| 143 | BH CVn | 203.699 | 37.182 | RS CVn | |||
| 144 | MCG-6-30-15 | 203.990 | -34.288 | AGN | ESO 383-G035 | ||
| 145 | NGC 5252 | 204.564 | 4.528 | AGN | |||
| 146 | MRK 268 | 205.420 | 30.395 | AGN | |||
| 147 | 4U 1344-60 | 206.894 | -60.615 | AGN | |||
| 148 | IC 4329A | 207.333 | -30.309 | AGN | |||
| 149 | IGR J14003-6326 | 210.204 | -63.414 | 57 | |||
| 150 | V834 Cen | 212.196 | -45.382 | CV | |||
| 151 | Circinus galaxy | 213.290 | -65.342 | AGN | |||
| 152 | NGC 5506 | 213.312 | -3.220 | AGN | |||
| 153 | IGR J14175-4641 | 214.296 | -46.671 | AGN | 23,8 | ||
| 154 | NGC 5548 | 214.541 | 25.155 | AGN | |||
| 155 | ESO 511-G030 | 214.885 | -26.633 | AGN | |||
| 156 | IGR J14298-6715 | 217.388 | -67.251 | 57 | |||
| 157 | IGR J14331-6112 | 218.273 | -61.221 | 57 | |||
| 158 | IGR J14471-6414 | 221.528 | -64.284 | 57 | |||
| 159 | IGR J14471-6319 | 221.834 | -63.289 | AGN | 23,8 | ||
| 160 | IGR J14493-5534 | 222.311 | -55.589 | AGN | 2MASX J14491283-5536194 | 22,9 | |
| 161 | IGR J14515-5542 | 222.887 | -55.691 | AGN | WKK 4374 | 62,8 | |
| 162 | IGR J14536-5522 | 223.421 | -55.363 | CV | 62,63 | ||
| 163 | IGR J14552-5133 | 223.846 | -51.571 | AGN | WKK 4438 | 23,8 | |
| 164 | IGR J14561-3738ccNewly discovered sources in this survey. | 224.055 | -37.632 | AGN | ESO 386- G 034 | 101 | |
| 165 | IC 4518A | 224.427 | -43.125 | AGN | |||
| 166 | IGR J15094-6649 | 227.382 | -66.816 | CV | 23,63 | ||
| 167 | PSR 1509-58 | 228.480 | -59.145 | PSR | |||
| 168 | 4U 1516-569 | 230.167 | -57.168 | LMXB | |||
| 169 | IGR J15360-5750 | 234.014 | -57.806 | 23 | |||
| 170 | 4U 1538-522 | 235.600 | -52.385 | HMXB | |||
| 171 | XTE J1543-568 | 236.011 | -56.748 | HMXB | |||
| 172 | 4U 1543-624 | 236.964 | -62.578 | LMXB | |||
| 173 | NY Lup | 237.052 | -45.472 | CV | 1RXS J154814.5-452845 | ||
| 174 | XTE J1550-564 | 237.751 | -56.474 | LMXB | |||
| 175 | IGR J15539-6142 | 238.468 | -61.676 | 57 | |||
| 176 | 4U 1556-605 | 240.363 | -60.716 | LMXB | |||
| 177 | WKK 6092 | 242.981 | -60.637 | AGN | |||
| 178 | 4U 1608-522 | 243.177 | -52.425 | LMXB | |||
| 179 | IGR J16167-4957 | 244.162 | -49.975 | CV | 1RXS J161637.2-495847 | 86,36 | |
| 180 | IGR J16175-5059 | 244.357 | -50.972 | PSR | PSR J1617-5055 | ||
| 181 | IGR J16185-5928 | 244.635 | -59.468 | AGN | WKK 6471 | 23,8 | |
| 182 | IGR J16195-4945 | 244.893 | -49.755 | HMXB | AX J161929-4945 | 86,83 | |
| 183 | IGR J16195-2807 | 244.871 | -28.151 | RS CVn? | 1RXS J161933.6-280736 | 44 | |
| 184 | Sco X-1 | 244.981 | -15.637 | LMXB | |||
| 185 | IGR J16207-5129 | 245.194 | -51.505 | HMXB | 86,83 | ||
| 186 | SWIFT J1626.6-5156 | 246.659 | -51.938 | R399R399footnotemark: | LMXB | 78 | |
| 187 | 4U 1624-49 | 247.002 | -49.209 | LMXB | |||
| 188 | IGR J16318-4848 | 247.953 | -48.819 | HMXB | 84,85 | ||
| 189 | IGR J16320-4751 | 248.013 | -47.876 | HMXB | AX J1631.9-4752 | 87,25 | |
| 190 | 4U 1626-67 | 248.076 | -67.466 | LMXB | |||
| 191 | 4U 1630-47 | 248.503 | -47.391 | LMXB | |||
| 192 | ESO 137-G34 | 248.790 | -58.088 | AGN | |||
| 193 | IGR J16358-4726bbSpatial confusion, source flux should be taken with the caution. | 248.992 | -47.407 | HMXB | 88,89 | ||
| 194 | AX J163904-4642 | 249.768 | -46.707 | HMXB | 90 | ||
| 195 | 4U 1636-536 | 250.230 | -53.751 | LMXB | |||
| 196 | IGR J16418-4532 | 250.465 | -45.534 | HMXB | 91,37 | ||
| 197 | GX 340+0 | 251.449 | -45.616 | LMXB | |||
| 198 | IGR J16465-4507bbSpatial confusion, source flux should be taken with the caution. | 251.648 | -45.118 | HMXB | 11,93 | ||
| 199 | IGR J16479-4514 | 252.015 | -45.207 | HMXB | 92,93 | ||
| 200 | IGR J16482-3036 | 252.058 | -30.591 | AGN | 2MASX J16481523-3035037 | 44,4 | |
| 201 | PSR J1649-4349 | 252.373 | -43.823 | PSR | |||
| 202 | IGR J16500-3307 | 252.493 | -33.113 | 1RXS J164955.1-330713 | 44 | ||
| 203 | NGC 6221 | 253.120 | -59.215 | eeMay contain flux from ESO 138-G1 (AGN, ′from NGC6221) | AGN | ||
| 204 | NGC 6240 | 253.305 | 2.429 | AGN | |||
| 205 | MKN 501 | 253.464 | 39.751 | AGN | |||
| 206 | GRO J1655-40 | 253.499 | -39.844 | LMXB | |||
| 207 | IGR J16558-5203 | 254.032 | -52.078 | AGN | 86,8 | ||
| 208 | IGR J16562-3301 | 254.073 | -33.045 | SWIFT J1656.3-3302 | |||
| 209 | Her X-1 | 254.455 | 35.343 | LMXB | |||
| 210 | AX J1700.2-4220 | 255.082 | -42.335 | HMXB | 63 | ||
| 211 | OAO 1657-415 | 255.199 | -41.656 | HMXB | |||
| 212 | XTE J1701-462 | 255.232 | -46.197 | R407R407footnotemark: | LMXB | ||
| 213 | GX 339-4 | 255.705 | -48.792 | LMXB | |||
| 214 | 4U 1700-377 | 255.984 | -37.842 | HMXB | |||
| 215 | GX 349+2 | 256.431 | -36.421 | LMXB | |||
| 216 | 4U 1702-429 | 256.566 | -43.037 | LMXB | |||
| 217 | 4U 1705-32 | 257.223 | -32.322 | LMXB | |||
| 218 | 4U 1705-440 | 257.234 | -44.102 | LMXB | |||
| 219 | 1RXS J170849.0-400910 | 257.214 | -40.142 | AXP | |||
| 220 | IGR J17091-3624 | 257.308 | -36.408 | LMXB | 94,24 | ||
| 221 | XTE J1709-267 | 257.386 | -26.658 | R171R171footnotemark: | LMXB | ||
| 222 | XTE J1710-281 | 257.549 | -28.128 | LMXB | |||
| 223 | RX J1713.7-3946 | 257.991 | -39.862 | SNR | G347.3-0.5 | ||
| 224 | Oph cluster | 258.114 | -23.347 | Cluster | |||
| 225 | SAX J1712.6-3739 | 258.153 | -37.645 | LMXB | |||
| 226 | 4U 1708-40 | 258.120 | -40.858 | LMXB | |||
| 227 | V2400 Oph | 258.149 | -24.244 | CV | |||
| 228 | KS 1716-389 | 259.003 | -38.879 | HMXB | XTE J1716-389 | 48,49 | |
| 229 | NGC 6300 | 259.244 | -62.830 | AGN | |||
| 230 | IGR J17195-4100 | 259.911 | -41.023 | CV | 1RXS J171935.6-410054 | 86,36 | |
| 231 | XTE J1720-318 | 259.993 | -31.753 | LMXB | |||
| 232 | IGR J17200-3116 | 260.022 | -31.294 | HMXB? | 1RXS J172006.1-311702 | 86,8 | |
| 233 | IGR J17204-3554 | 260.087 | -35.900 | AGN | 44,27 | ||
| 234 | EXO 1722-363 | 261.295 | -36.282 | HMXB | |||
| 235 | IGR J17254-3257 | 261.354 | -32.953 | LMXB | 1RXS J172525.5-325717 | 86,70 | |
| 236 | IGR J17269-4737 | 261.681 | -47.647 | R364R364footnotemark: | XRB | XTE J1726-476 | 73 |
| 237 | 4U 1724-30 | 261.888 | -30.804 | LMXB | Terzan 2 | ||
| 238 | IGR J17285-2922 | 262.163 | -29.370 | R120R120footnotemark: | LMXB? | XTE J1728-295 | 86,35 |
| 239 | IGR J17303-0601 | 262.579 | -5.971 | CV | 1RXS J173021.5-055933 | 86,72 | |
| 240 | GX 9+9 | 262.934 | -16.952 | LMXB | |||
| 241 | GX 354-0 | 262.988 | -33.833 | LMXB | |||
| 242 | GX 1+4 | 263.011 | -24.747 | LMXB | |||
| 243 | IGR J17320-1914 | 263.001 | -19.195 | Nova | V2487 Oph | 36 | |
| 244 | IGR J17331-2406 | 263.291 | -24.142 | 64 | |||
| 245 | RapidBurster | 263.349 | -33.387 | LMXB | |||
| 246 | IGR J17350-2045ccNewly discovered sources in this survey. | 263.740 | -20.754 | ||||
| 247 | IGR J17353-3539ccNewly discovered sources in this survey. | 263.830 | -35.663 | ||||
| 248 | IGR J17353-3257 | 263.848 | -32.934 | IGR J17354-3255 | 22 | ||
| 249 | IGR J17364-2711 | 264.117 | -27.199 | ddFlux measured in the energy range keV over 10 s during the burst (Chelovekov et al. 2006). | 82 | ||
| 250 | GRS 1734-292 | 264.371 | -29.139 | AGN | 29 | ||
| 251 | IGR J17379-3747ccNewly discovered sources in this survey. | 264.465 | -37.774 | R165R165footnotemark: | |||
| 252 | SLX 1735-269 | 264.571 | -26.991 | LMXB | |||
| 253 | 4U 1735-444 | 264.748 | -44.453 | LMXB | |||
| 254 | IGR J17391-3021 | 264.812 | -30.355 | HMXB | XTE J1739-302 | 6,15 | |
| 255 | GRS 1736-297 | 264.899 | -29.736 | R409R409footnotemark: | |||
| 256 | XTE J1739-285bbSpatial confusion, source flux should be taken with the caution. | 264.975 | -28.496 | LMXB | 5 | ||
| 257 | IGR J17402-3656 | 265.087 | -36.936 | Open star cluster | NGC 6400 | ||
| 258 | SLX 1737-282bbSpatial confusion, source flux should be taken with the caution. | 265.168 | -28.313 | LMXB | |||
| 259 | IGR J17407-2808bbSpatial confusion, source flux should be taken with the caution. | 265.175 | -28.133 | HMXB | 2RXP J174040.9-280852 | 16,10 | |
| 260 | IGR J17419-2802bbSpatial confusion, source flux should be taken with the caution. | 265.485 | -28.031 | R409R409footnotemark: | 61 | ||
| 261 | 2E 1739.1-1210 | 265.484 | -12.188 | AGN | IGR J17418-1212 | ||
| 262 | XTE J1743-363 | 265.753 | -36.377 | HMXB? | 10 | ||
| 263 | 1E 1740.7-294 | 265.976 | -29.748 | LMXB | |||
| 264 | IGR J17445-2747 | 266.082 | -27.772 | R165R165footnotemark: | 44 | ||
| 265 | IGR J17448-3231bbSpatial confusion, source flux should be taken with the caution. ccNewly discovered sources in this survey. | 266.190 | -32.528 | ||||
| 266 | KS 1741-293bbSpatial confusion, source flux should be taken with the caution. | 266.242 | -29.337 | LMXB | |||
| 267 | GRS 1741.9-2853bbSpatial confusion, source flux should be taken with the caution. | 266.250 | -28.917 | LMXB | |||
| 268 | IGR J17456-2901bbSpatial confusion, source flux should be taken with the caution. | 266.401 | -29.026 | Nuclear stellar cluster | 79,76 | ||
| 269 | 1E 1742.8-2853bbSpatial confusion, source flux should be taken with the caution. | 266.500 | -28.914 | LMXB? | |||
| 270 | A 1742-294 | 266.517 | -29.508 | LMXB | |||
| 271 | IGR J17464-3213 | 266.564 | -32.237 | LMXB | H1743-322/XTE J1746-322 | 95 | |
| 272 | 1E 1743.1-2843bbSpatial confusion, source flux should be taken with the caution. | 266.580 | -28.735 | LMXB | |||
| 273 | SAX J1747.0-2853bbSpatial confusion, source flux should be taken with the caution. | 266.761 | -28.883 | LMXB | |||
| 274 | SLX 1744-299/300bbSpatial confusion, source flux should be taken with the caution. | 266.834 | -30.010 | LMXB | |||
| 275 | IGR J17473-2721 | 266.841 | -27.352 | R304R304footnotemark: | 74 | ||
| 276 | IGR J17475-2253ccNewly discovered sources in this survey. | 266.901 | -22.862 | ||||
| 277 | IGR J17475-2822 | 266.864 | -28.364 | Molecular cloud | SgrB2 | 21 | |
| 278 | GX 3+1 | 266.983 | -26.563 | LMXB | |||
| 279 | A 1744-361 | 267.052 | -36.133 | R181R181footnotemark: | LMXB | ||
| 280 | 4U 1745-203 | 267.217 | -20.359 | R120R120footnotemark: | LMXB | ||
| 281 | AX J1749.1-2733bbSpatial confusion, source flux should be taken with the caution. | 267.275 | -27.550 | XRB? | 10 | ||
| 282 | IGR J17488-3253 | 267.223 | -32.907 | AGN | 86,8 | ||
| 283 | AX J1749.2-2725bbSpatial confusion, source flux should be taken with the caution. | 267.292 | -27.421 | HMXB | |||
| 284 | SLX 1746-331 | 267.477 | -33.201 | LMXB | |||
| 285 | 4U 1746-37 | 267.548 | -37.046 | LMXB | |||
| 286 | IGR J17505-2644ccNewly discovered sources in this survey. | 267.636 | -26.744 | ||||
| 287 | GRS 1747-313 | 267.689 | -31.284 | LMXB | Terzan 6 | ||
| 288 | XTE J1751-305 | 267.816 | -30.616 | R299R299footnotemark: | LMXB | ||
| 289 | IGR J17513-2011 | 267.820 | -20.184 | AGN | 44,8 | ||
| 290 | SWIFT J1753.5-0127 | 268.361 | -1.452 | LMXB? | 80,81 | ||
| 291 | AX J1754.2-2754 | 268.495 | -28.026 | LMXB | |||
| 292 | IGR J17544-2619 | 268.619 | -26.325 | HMXB | 54,31 | ||
| 293 | IGR J17585-3057ccNewly discovered sources in this survey. | 269.636 | -30.956 | ||||
| 294 | IGR J17597-2201 | 269.946 | -22.026 | LMXB? | XTE J1759-220 | 96,97 | |
| 295 | GX 5-1 | 270.283 | -25.075 | LMXB | |||
| 296 | GRS 1758-258 | 270.302 | -25.743 | LMXB | |||
| 297 | GX 9+1 | 270.385 | -20.527 | LMXB | |||
| 298 | IGR J18027-2016 | 270.666 | -20.283 | HMXB | IGR/SAX J18027-2017 | 98,99 | |
| 299 | IGR J18027-1455 | 270.692 | -14.910 | AGN | 1RXS J180245.2-145432(f) | 86,3 | |
| 300 | IGR J18048-1455 | 271.180 | -14.925 | HMXB | 44,60 | ||
| 301 | XTE J1807-294 | 271.770 | -29.430 | LMXB | |||
| 302 | SGR 1806-20 | 272.162 | -20.404 | SGR | |||
| 303 | PSR J1811-1925 | 272.862 | -19.423 | PSR/PWN | SNR G11.2-0.3 | ||
| 304 | IGR J18135-1751 | 273.397 | -17.858 | PWN/SNR? | HESS J1813-178 | 46 | |
| 305 | GX 13+1 | 273.629 | -17.155 | LMXB | |||
| 306 | M 1812-12 | 273.780 | -12.094 | LMXB | |||
| 307 | GX 17+2 | 274.006 | -14.035 | LMXB | |||
| 308 | IGR J18170-2511ccNewly discovered sources in this survey. | 274.295 | -25.142 | ||||
| 309 | XTE J1817-330 | 274.431 | -33.020 | LMXB | |||
| 310 | SAX J1818.6-1703 | 274.699 | -17.033 | HMXB | 33 | ||
| 311 | AX J1820.5-1434 | 275.112 | -14.564 | HMXB | |||
| 312 | IGR J18214-1318 | 275.340 | -13.299 | 44 | |||
| 313 | 4U 1820-303 | 275.921 | -30.362 | LMXB | |||
| 314 | IGR J18249-3243 | 276.206 | -32.738 | AGN | PKS 1821-327? | 9 | |
| 315 | 4U 1822-000 | 276.312 | 0.007 | LMXB | |||
| 316 | 4U 1822-371 | 276.447 | -37.106 | LMXB | |||
| 317 | IGR J18257-0707 | 276.480 | -7.145 | 44 | |||
| 318 | LS 5039 | 276.554 | -14.861 | HMXB | |||
| 319 | GS 1826-24 | 277.367 | -23.798 | LMXB | |||
| 320 | AX J183039-1002 | 277.660 | -10.049 | ||||
| 321 | IGR J18325-0756 | 278.112 | -7.938 | 100 | |||
| 322 | SNR 021.5-00.9 | 278.394 | -10.572 | SNR | |||
| 323 | PKS 1830-211 | 278.421 | -21.068 | AGN | |||
| 324 | 3C382 | 278.738 | 32.660 | AGN | |||
| 325 | RX J1832-33 | 278.933 | -32.990 | LMXB | |||
| 326 | AX J1838.0-0655 | 279.503 | -6.911 | SNR/PWN | HESS J1837-069 | 47 | |
| 327 | ESO 103-G035 | 279.632 | -65.422 | AGN | |||
| 328 | Ser X-1 | 279.991 | 5.041 | LMXB | |||
| 329 | IGR J18410-0535 | 280.262 | -5.577 | HMXB | AX J1841.0-0536 | 19 | |
| 330 | 1E 1841-045 | 280.329 | -4.938 | PSR/PWN | |||
| 331 | 3C390.3 | 280.578 | 79.763 | AGN | |||
| 332 | AX J1845.0-0433 | 281.253 | -4.574 | HMXB | 40 | ||
| 333 | GS 1843+00 | 281.404 | 0.868 | HMXB | |||
| 334 | PSR J1846-0258 | 281.613 | -2.983 | PSR/PWN | AXP? | ||
| 335 | A 1845-024 | 282.048 | -2.426 | HMXB | |||
| 336 | IGR J18483-0311 | 282.071 | -3.172 | 71 | |||
| 337 | IGR J18486-0047ccNewly discovered sources in this survey. | 282.104 | -0.787 | ||||
| 338 | IGR J18490-0000 | 282.258 | -0.013 | 38 | |||
| 339 | 4U 1850-087 | 283.265 | -8.702 | LMXB | |||
| 340 | IGR J18539+0727 | 283.500 | 7.488 | LMXB? | 30,24 | ||
| 341 | 4U 1849-31 | 283.761 | -31.155 | CV | V1223 Sgr | ||
| 342 | XTE J1855-026 | 283.870 | -2.601 | HMXB | |||
| 343 | IGR J18559+1535 | 283.987 | 15.629 | AGN | 2E 1853.7+1534 | 32,8 | |
| 344 | IGR J18578-3405 | 284.469 | -34.096 | R408R408footnotemark: | AGN? | ||
| 345 | XTE J1858+034 | 284.673 | 3.437 | HMXB | |||
| 346 | HETE J19001-2455 | 285.039 | -24.917 | LMXB | |||
| 347 | XTE J1901+014 | 285.415 | 1.447 | HMXB? | 69 | ||
| 348 | 4U 1901+03 | 285.917 | 3.207 | HMXB | |||
| 349 | SGR 1900+14 | 286.839 | 9.322 | SGR | |||
| 350 | XTE J1908+094 | 287.219 | 9.374 | LMXB | |||
| 351 | 4U 1907+097 | 287.406 | 9.833 | HMXB | |||
| 352 | IGR J19108+0917 | 287.641 | 9.312 | ||||
| 353 | X 1908+075 | 287.701 | 7.595 | HMXB | |||
| 354 | Aql X-1 | 287.814 | 0.584 | LMXB | |||
| 355 | SS 433 | 287.957 | 4.979 | HMXB | |||
| 356 | IGR J19140+098 | 288.526 | 9.885 | HMXB | IGR J19140+0951 | 53,42 | |
| 357 | GRS 1915+105 | 288.801 | 10.947 | LMXB | |||
| 358 | 4U 1916-053 | 289.686 | -5.247 | LMXB | |||
| 359 | SWIFT J1922.7-1716 | 290.615 | -17.300 | R309R309footnotemark: | 65 | ||
| 360 | 1H 1934-063 | 294.422 | -6.240 | AGN | |||
| 361 | RX J1940.2-1025 | 295.050 | -10.446 | CV | V1432 Aql | 36 | |
| 362 | NGC 6814 | 295.685 | -10.331 | AGN | |||
| 363 | XSS J19459+4508 | 296.887 | 44.883 | AGN | IGR J19473+4452 | 23,2 | |
| 2MASX J19471938+4449425 | |||||||
| 364 | KS 1947+300 | 297.397 | 30.211 | HMXB | |||
| 365 | 3C403 | 298.024 | 2.445 | AGN | |||
| 366 | 4U 1954+319 | 298.933 | 32.094 | HMXB | |||
| 367 | Cyg X-1 | 299.588 | 35.202 | HMXB | |||
| 368 | Cygnus A | 299.863 | 40.736 | AGN | |||
| 369 | SWIFT J2000.6+3210 | 300.101 | 32.166 | HMXB | IGR J20006+3210 | 65,66 | |
| 370 | IGR J20187+4041 | 304.647 | 40.706 | AGN | 2MASX J20183871+4041003 | 26,39 | |
| IGR J2018+4043 | |||||||
| 371 | IGR J20286+2544 | 307.140 | 25.746 | AGN | MCG +04-48-002 | 9,7 | |
| 372 | EXO 2030+375 | 308.062 | 37.638 | HMXB | |||
| 373 | Cyg X-3 | 308.108 | 40.959 | HMXB | |||
| 374 | 4C +74.26 | 310.576 | 75.141 | AGN | |||
| 375 | MRK 509 | 311.036 | -10.727 | AGN | |||
| 376 | IGR J20569-4940 | 314.215 | 49.679 | 3A 2056+493 | |||
| 377 | SAX J2103.5+4545 | 315.901 | 45.753 | HMXB | |||
| 378 | S5 2116+81 | 318.736 | 82.045 | AGN | |||
| 379 | IGR J21178+5139 | 319.441 | 51.650 | AGN | 2MASX J21175311+5139034 | 9 | |
| 380 | IGR J21237+4218 | 320.960 | 42.316 | CV | V2069 Cyg | ||
| 381 | IGR J21247+5058 | 321.161 | 50.973 | AGN | 86,3 | ||
| 382 | IGR J21277+5656 | 321.930 | 56.943 | AGN | 32 | ||
| 383 | 4U 2127+119 | 322.502 | 12.172 | LMXB | |||
| 384 | CV Cyg | 323.449 | 51.122 | CV | 36 | ||
| 385 | IGR J21343+4738 | 323.625 | 47.614 | 1RXS J213419.6+473810 | |||
| 386 | SS Cyg | 325.711 | 43.574 | CV | |||
| 387 | Cyg X-2 | 326.170 | 38.319 | LMXB | |||
| 388 | NGC 7172 | 330.490 | -31.864 | AGN | |||
| 389 | BL Lac | 330.645 | 42.267 | AGN | 1 | ||
| 390 | 4U 2206+543 | 331.992 | 54.513 | HMXB | |||
| 391 | FO Aqr | 334.402 | -8.301 | R25R25footnotemark: | CV | ||
| 392 | NGC 7314 | 338.890 | -26.021 | AGN | |||
| 393 | IGR J22367-1231 | 339.176 | -12.539 | AGN | MRK 915 | ||
| 394 | IGR J22517+2218ccNewly discovered sources in this survey. | 342.939 | 22.316 | R316R316footnotemark: | |||
| 395 | 3C 454.3 | 343.490 | 16.143 | AGN | 1 | ||
| 396 | MR 2251-178 | 343.465 | -17.616 | AGN | |||
| 397 | NGC 7469 | 345.825 | 8.879 | AGN | |||
| 398 | MRK 926 | 346.166 | -8.689 | AGN | |||
| 399 | Cas A | 350.846 | 58.813 | SNR | |||
| 400 | IGR J23523+5844ccNewly discovered sources in this survey. | 358.079 | 58.745 |