xxx–xxx
Central Stellar Populations of S0 Galaxies in the Fornax Cluster
Abstract
Based on FORS2-VLT long-slit spectroscopy, the analysis of the central absorption line indices of 9 S0 galaxies in the Fornax Cluster is presented. Central indices correlate with central velocity dispersions () as observed in ellipticals (E). However, the stellar population properties of these S0s indicates that the observed trends are produced by relative differences in age and -element abundances and not in metallicity ([Fe/H]) as previous studies have found in E galaxies. The observed scatter in the line indices versus relations can be partially explained by the rotationally-supported nature of many of these systems. The presence of tighter line indices vs. maximum (circular) rotational velocity () relations confirms this statement. It was also confirmed that the dynamical mass is the driving physical property of all these correlations and in our Fornax S0s it has to be estimated assuming rotational support.
keywords:
galaxies: elliptical and lenticular, stellar content, kinematics and dynamics1 The Index∗ vs. Relations
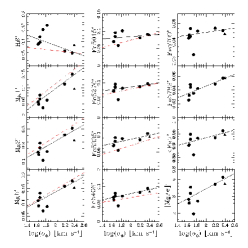
In Figure 1 (left), different central line indices are plotted against for our sample (Bedregal et al. 2006). Bright and faint S0s lay in two separate clumps, each one in opposite extremes of the range. When models from [Bruzual & Charlot (2003)] are used to estimate stellar population parameters, the observed trends seem to be driven by age and -element relative abundances. This is opposite to what is usually found in E, where [Fe/H] is an important driver of the correlations. By parametrising line indices using [Bruzual & Charlot (2003)] models we found that age can explain the observed slopes of H-log() and Fe-log() relations, while additional differences in -element relative abundances would be required to explain the Mg-log() trends. On the other hand, [Fe/H] by itself cannot explain any of the observed Index∗-log() relations.
2 The Index∗ vs. Relations:
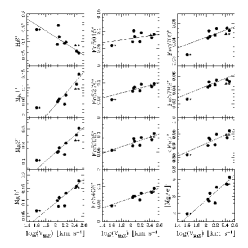
In Figure 1 (right) we present the Index∗ vs. log() relations for our sample of S0s. Clear trends appear in all the panels. It is interesting to notice that the standard deviation of the linear fits performed is smaller for almost all the indices in comparison to its counterpart from the Index∗-log() fits. Assuming that mass is the fundamental physical parameter governing the properties of these galaxies, the improvement in the fits may be interpreted in the sense that is a better estimator of the dynamical mass than . To test this hypothesis, the mass of these galaxies was parametrised as a function of and in order to compare how central indices correlate with both possible descriptions. and are the disk scale and effective radius of the bulge respectivelly and the mean was estimated within (see Figure 2).
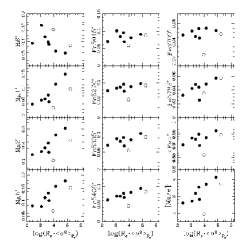
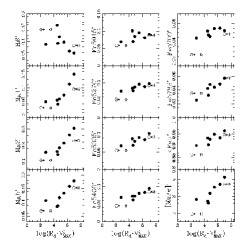
Clearly, both and are tracing the mass of these systems. However, when mass is estimated using (Figure 2, left panel), it is underestimated in rotationally supported systems with respect to pressure supported ones. On the other hand, the right panel of Figure 2 shows that galaxies follow a common sequence when is used. The tighter trends in this figure agree with the idea that is a better tracer of dynamical mass than for this sample of galaxies.
References
- [] Bedregal A.G, Aragón-Salamanca A, Merrifield M.R, Milvang-Jensen B, 2006, MNRAS,371,1912
- [Bruzual & Charlot (2003)] Bruzual G., Charlot S., 2003, MNRAS,244,1000
- [Kuntschner (2000)] Kuntschner H., 2000, MNRAS,315,184