HV 11423: The Coolest Supergiant in the SMC
Abstract
We call attention to the fact that one of the brightest red supergiants in the SMC has recently changed its spectral type from K0-1 I (December 2004) to M4 I (December 2005) and back to K0-1 I (September 2006). An archival spectrum from the Very Large Telescope reveals that the star was even cooler (M4.5-M5 I) in December 2001. By contrast, the star was observed to be an M0 I in both October 1978 and October 1979. The M4-5 I spectral types is by far the latest type seen for an SMC supergiant, and its temperature in that state places it well beyond the Hayashi limit into a region of the H-R diagram where the star should not be in hydrostatic equilibrium. The star is variable by nearly 2 mag in , but essentially constant in . Our modeling of its spectral energy distribution shows that the visual extinction has varied during this time, but that the star has remained essentially constant in bolometric luminosity. We suggest that the star is currently undergoing a period of intense instability, with its effective temperature changing from 4300 K to 3300 K on the time-scale of months. It has one of the highest 12m fluxes of any RSG in the SMC, and we suggest that the variability at is due primarily to changes in effective temperature, and secondly, due to changes in the local extinction due to creation and dissipation of circumstellar dust. We speculate that the star may be nearing the end of its life.
1 Introduction
Red supergiants (RSGs) are the He-burning descendants of 10-25 stars. They are not the most massive or luminous stars (those become luminous blue variables and/or Wolf-Rayet stars instead), but their cool effective temperatures and relatively high luminosities result in their being the physically largest stars. These stars are fully convective, with the lowest temperatures determined by the Hayashi limit; cooler than this, stars are not hydrostatically stable. The coolest temperature allowed at a given luminosity should be somewhat higher for stars with lower chemical abundances, as in the Magellanic Clouds. Indeed, this is consistent with the fact that the Milky Way contains supergiants as late as M5, while the latest-type supergiants known in the SMC (until now) were M2-3 (Humphreys 1979, Elias et al. 1985; Massey & Olsen 2003; Levesque et al. 2006, hereafter Paper II).
Because of their extreme properties, the class of red supergiants includes a number of oddballs. In some cases, the peculiarities are due to a star’s binary nature, as in the case of VV Cep, whose spectrum shows emission lines of H and [Fe] in addition to the TiO bands that characterize an M star. VV Cep is the archetype of eclipsing systems consisting of an M-type supergiant with a B-type companion. (For a nice review which has stood the test of time, see Cowley 1969). The star Aur presents a similar, but less extreme, example (Cowley 1969, Wright 1970). In other cases, the oddities (such as IR excess, photometric variability and/or low-excitation emission lines) are linked to extreme circumstellar environments, as is the case for VY CMa and NML Cyg (Hyland et al. 1969). The circumstellar material associated with these stars is indicative of extraordinary mass loss, due to some not yet understood instability.
These exceptional stars are important not only for their own interesting astrophysics, but for what they can tell us about red supergiants in general. For instance, in VV Cep and Aur, the B star can be used as a probe of the atmospheric and wind structure in RSGs (see, for example, Harper et al. 2005, Hack et al. 1992, and Schroeder 1985). Massey et al. (2006) argue that VY CMa and NML Cyg may be examples of normal RSGs caught during an unusually unstable period during which the stars are losing copious amounts of mass, and their study thus sheds light on an important, but short-lived, phase.
In this paper, we call attention to an equally unusual RSG in the SMC, HV 11423 (=01h00m55.16s, =-71∘37’53.0” from the UCAC2, Zacharias et al. 2004). We have found that this star has changed its spectral type from K0-1 I to M4 I and back again during the past two years, and that in late 2001 it was M4.5-5 I. The M4 and M4.5-5 I types are considerably later than the M2 I type cited as the latest spectral subtype found for SMC RSGs by Humphreys (1979) and Elias et al. (1985); Massey & Olsen (2003) found only one star that might be M3 I. We will discuss other late-type SMC and LMC RSGs elsewhere (Levesque et al. 2007). The temperature corresponding to an M4-5 I type is considerably cooler than what evolutionary theory predicts for this metallicity (see Paper II and discussion below), and places the star well beyond the Hayashi limit, where stars cannot be in hydrostatic equilibrium. Furthermore, although photometric variability at the mag level (in ) is fairly common for RSGs, spectral variability even by as much as a single spectral subtype (i.e., M1.5 I to M2 I) is not. For instance, although Betelgeuse is well-known to vary photometrically by as much as a magnitude, Goldberg (1984) failed to find any sign of spectral variability; the star has remained an M2 Iab throughout many decades of observations. Even the highly unusual star VY CMa, which shows 3.5 mag changes at , has remained constant in spectral type during 40 years of intensive spectroscopic monitoring (Wallerstein 1958, 1977; Wallerstein & Gonzalez 2001). A change from K0-1 I to M4-5 I is without precedent for a supergiant.
The star was listed as the brightest red star in the SMC by van den Bergh (1968) and by Sandage & Tammann (1974), although subsequent work has revealed a few more SMC RSGs that are equally bright, such as [M2002] SMC 06988 (see Massey & Olsen 2003). Sandage & Tammann (1974) suggested using such stars as distance indicators. The variability and “very red” color was first described by Nail (1942) and Shapley & Nail (1951). The star is cataloged as [M2002] SMC 050028 in Massey (2002).
2 Observations: Old and New
2.1 Spectral and Photometric Variability
In the course of an observational program to determine the physical properties of RSGs in the Milky Way (Levesque et al. 2005, hereafter Paper I) and Magellanic Clouds (Paper II) we chanced upon this remarkable star. It was originally included in our SMC observing list as it had been classified as an M0 supergiant by Humphreys (1979) and Elias et al. (1985) based upon (photographic) spectra taken in 1978 and 1979 using the RC Spectrograph on the CTIO 4-m. (A note in their table adds that there was a “warm continuum at the blue end of spectrum”.) They had observed the star either because it was a Harvard variable, or from a preliminary list of RSG candidates in the SMC that was eventually published as Sanduleak (1989), where the star is designated as “SkKM 205”. The photoelectric photometry reported by Humphreys (1979) and Elias et al. (1985) shows that the star varied from (Oct 1978) to (Oct 1979) while staying essentially constant in (1.82-1.84). Although it is not clear from these papers, examination of the CTIO observing schedules for the period in question suggest that the spectra were obtained within a few days of the reported photometry.
Our first spectra of this star were taken on 2004 December 2 (blue) and 2004 December 4 (red) with the CTIO 4-m and RC Spectrograph using the setups described in Table 1; further details are given in Paper II. We were quite surprised to find that the star was of early K-type. A comparison with spectral standards described in Paper I suggest a spectral type of K0-1 I. Upon noting this discrepancy with the Humphreys (1979) M0 I type, we were concerned that we might have observed the wrong star. However, we were forced to reject this possibility for the following reasons. First, the blue and red spectra are clearly of the same object despite having been observed on different nights; the features in the region of overlap are the same depths, and the flux levels of the calibrated spectra agree to better than 2%, so if the wrong object was observed, it was observed on both nights. That is unlikely, but would be possible if (for instance) there was a mistake in the coordinate file used for pointing the telescope. However, we can eliminate that possibility as the coordinates in image headers, which reflect where the telescope was actually pointed when the observations were made, agree with the correct coordinates to 3-5”, as they do for the objects observed directly before and afterwards. Furthermore, the fluxes we measure from our spectra correspond to a magnitude of 11.84, consistent with the star’s photometry. The color we derive from our spectrophotometry corresponds to , in agreement with the literature values for this object. Examination of the catalog of SMC stars by Massey (2002) shows that HV 11423 is the only object this bright within 8’. Taken together, there seems to be no question that the object we observed was the one we intended.
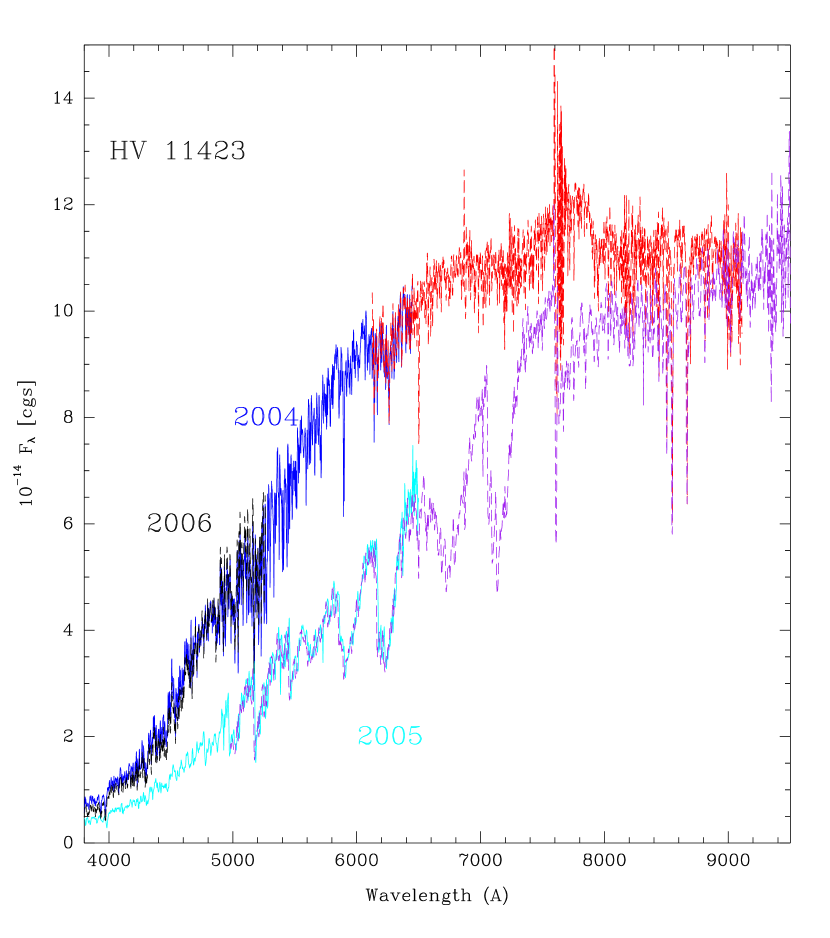
We decided to re-observe the object the following year, and obtained spectra of similar quality (cf., Table 1) on 2005 Dec 20 (red) and 2005 Dec 21 (blue). If we were surprised by the K0-1 I spectrum of 2004, imagine our reaction to the 2005 spectrum, where the two are compared in Fig. 1. The star is of spectral type M4 I, the latest spectral type seen for a supergiant in the SMC (Paper II; see also Elias et al. 1985). The spectrophotometry indicates the star was now fainter () but with a similar , about 1.93. This value is again similar to photometry carried out at the same time, as described below. Again the fluxes of the blue and red exposures agree extremely well (as is obvious from the figure), and the coordinates in the headers agree with each other and the target position to within 3-5”, as do those of the objects observed before and afterwards. We conclude that the spectral type changed from K0-1 I to M4 I between Dec 2004 and Dec 2005. We note that the star’s flux remained unchanged in the far red (i.e., 9000Å).
As another check, we obtained two spectra in late September 2006. The first of these was obtained on the CTIO 1.5-m telescope on 25 September 2006 through the courtesy of F. Walters and the SMARTS observing queue. The observation covered only the blue (details are given in Table 1), and was flux calibrated by the observation of a single spectrophotometric standard. Both the spectral features and absolute flux agree very well with our 2004 observation, as shown in Fig. 1. The second spectrum was obtained on 29 September 2006 during engineering time on the fiber positioner Hydra on the CTIO 4-m telescope (Table 1); we are grateful to A. Walker for his permission and encouragement to do so. Due to limited time we were unable to obtain a satisfactory observation of a flux standard, but the excellent agreement in the spectral features between the two late September observations is evident (Fig. 2) in the region of overlap. We identify some of the stronger features in this figure to emphasize the certainty of the early K-type classification (December 2004 and September 2006). The lack of TiO requires that the spectral type be much earlier than the 1978 and 1979 M0 I type, while the weakness of Ca II H and K absorption, the weakness of Ca I , and the overall appearance of the G band argues for a very early K type. The lack of Balmer absorption lines, though, argues against it being a late G-type star. See Morgan et al. (1943), and Jaschek & Jaschek (1990).
We were of course curious if we could find any additional spectral observations. The ESO archive contained an echelle spectrum obtained with the VLT and UVES on 5 December 2001, obtained under program ID 68.B-0530(B). The spectrum clearly shows that the star is even later than the M4 I December 2004 type, probably M4.5-5 I. We compare a small piece of the blue with our 2005 December observation in Fig. 3. As we shall shortly show, this spectrum happened to be obtained when the star was at its faintest known 111Unfortunately the VLT observers did not obtain any spectrophotometric standards during their run, and the setup was not one of the standard ones for which the relative flux response is known..
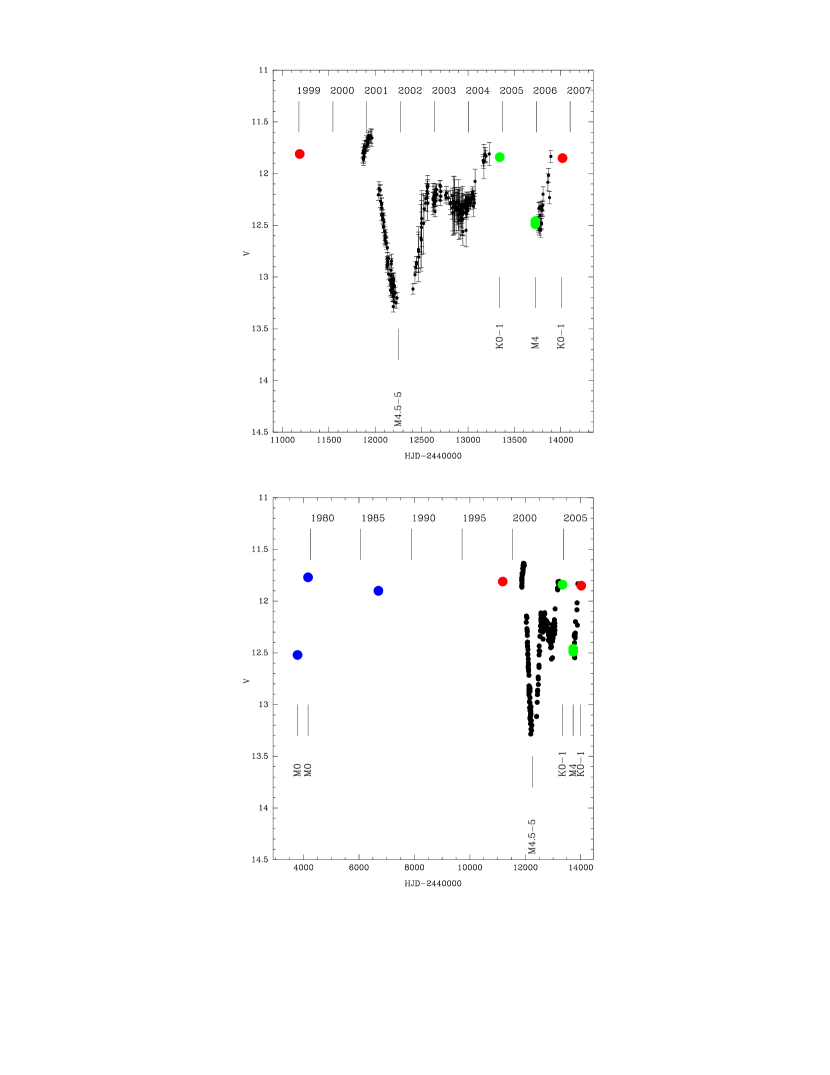
In Fig. 4 (top) we show the star’s band photometry (displayed as error bars), where the data come primarily from the All Sky Automated Survey (ASAS) of Pojmanski (2002). We also include the values derived from our spectrophotometry, which are shown by green colored dots; these are in good agreement with the ASAS values. The two red dots denote CCD observations: the value from Massey (2002), obtained on 1999 January 8, and a newly obtained observation on 2006 October 10 via the SMARTS 1.3-m queue, where we measure . (We are grateful to Charles Bailyn for arranging for this observation, and to Suzanne Tourtellotte for processing the images through the Yale pipeline.) In Fig. 4 (bottom) we include the photoelectric photometry from 1978 and 1979 values ( and 11.77 from Humphreys 1979 and Elias et al. 1985, respectively), as well as a 1986 photoelectric measurement () from Maurice et al. (1989), with all three shown in blue.
It is clear from this that the star varies nearly 2 mag in . The star had a deep minimum in December 2001 (), and a “mini-minimum” in October 2003. The star was observed coming out of a minimum in December 2005. If that was a deep minimum similar to that seen in December 2001, then folding the light curve based upon these two minima suggest a 1295 day (3.5 yrs) period. However, this is at variance with the 1999 CCD observation, which would be nearly 0.5 mag too bright for that period. Alternatively, if the minima were very unequal in depth, and the “mini-minimum” correspond to the same phase as the deep minimum, then there might be a 700 day period. The rising part of the light curve observed in September 2006 might also match this, but clearly several more years of photometric monitoring will be needed before we can determine if there is any periodicity or not. We can say with certainty that the two K0-1 I spectra were both at times when the star was at its brightest, but that the M4 I spectra were taken when the star was fainter: the 2001 spectrum was taken at nearly minimum light. The two M0 I spectra in 1978 and 1979 were both obtained when the star was bright (1979) and relatively faint (1978), if indeed the published photometric and spectra data were contemporary.
Various band measurements exist in the literature, dating back to mid 1977 (Glass 1979) and continuing to 1998 with the DENIS (Cioni et al. 2000) and 2MASS (Skrutskie et al. 2006) surveys. During that time the star stayed essentially constant at , with values spanning the range 7.86-8.08, when transformed to the standard system of Bessel & Brett (1988) using Carpenter (2001). This consistency is in accordance with what we see in our spectral energy distributions (Fig. 1), where the fluxes agree in the far red despite large differences at shorter wavelengths. It is also consistent with the general supposed trend that RSGs show considerably smaller variations at than at (Josselin et al. 2000), although there are clearly exceptions, such as VY CMa (Massey et al. 2006). We adopt the average, .
The star’s radial velocity was measured in August 1983 as 107.7 km s-1 by Maurice et al. (1987) using the CORAVEL photoelectric scanner. The radial velocity of this star was considered by them to be a “high residual”, and indeed the velocity is low compared to the 158 km s-1 of the center of the SMC, and the distribution of radial velocities of other SMCs (see Fig. 1 in Massey & Olsen 2003), although above the 100 km s-1 value used by Massey & Olsen (2003) to assign SMC membership. We have two measurements, based upon cross-correlating the region around the Ca II triplet with SMC/LMC RSGs from Massey & Olsen (2003). The 2004 December value is km s-1, in good agreement with the CORAVEL value. Our 2005 December value is km s-1, where the large error is a reflection of the lower spectral dispersion. We cannot rule out velocity variations of the star, but our data do not show any evidence of them.
Observationally, HV 11423 is remarkable in one other way: as noted by Loup et al. (1997), it is an IRAS source (F00592-7153), with an (uncorrected) flux at 12m of 0.114 Jy (Moshir et al. 1990). Of the 163 stars listed by Massey & Olsen (2003) as potential or confirmed RSGs in the SMC, only 3 others are IRAS sources. We list these in Table 4. Unfortunately, there is no information about the variability of the star in the mid-IR; the object was about half a degree outside of the Midcourse Space Experiment MSX survey region (Price et al. 2001, Egan et al. 2003), and is also outside of the SMC Spitzer survey. Nor are there any mid-IR imaging of the object in the Gemini Science Archive. Observations with Spitzer would be highly desirable, and we plan to propose these.
2.2 Summary of Observations
We briefly summarize the observational facts here. The star has been well observed photometrically in since late 2000, and is found to vary from 11.5 to 13.4. There was a deep minimum occurring in December 2001 (Fig. 4) and a spectrum taken at that time at the VLT shows a very late-type spectrum, M4.5-5 I. In November 2004 the star was at its brightest, and the spectrum was a K0-1 I. A year later, in December 2005, the star was faint but brightening and the spectrum was observed to be M4 I. In September 2006 the star was again bright, with a spectrum of K0-1 I. The simple picture that the star is an M4-5 I when faint, and a K0-1 I when bright, is at variance with the 1978 and 1979 observations by Humphreys (1979) and Elias et al. (1985). They identified the star as spectral type M0 I both times, despite the fact that the star had for the 1978 observation and for the 1979 observation.
In contrast with the several hundred band measurements, there are only a few measurements available, and these have remained relatively constant at , despite changes in the star’s photometry and spectral type. (We should note, however, that none of the measurements were at the deep -band minimum.) There are only a few band measurements of the star, but these have also stayed constant, to within uncertainties. The star has a radial velocity consistent with membership in the SMC, and is one of just four SMC RSGs that were detected at 12 by IRAS.
3 Physical Properties
Following Papers I and II, we can estimate the physical properties in two ways, using the spectrophotometry and the colors. For both we rely on the MARCS stellar atmosphere models (Gustafsson et al. 1975, 2003; Plez et al. 1992; Plez 2003), where a grid of models have been computed for =0.2 (appropriate to the SMC; see Westerlund [1997]) for 3000-4500 K and surface gravities from to +1 [cgs units]. We adopt a true distance modulus of 18.9, following Westerlund (1997) and van den Bergh (2000).
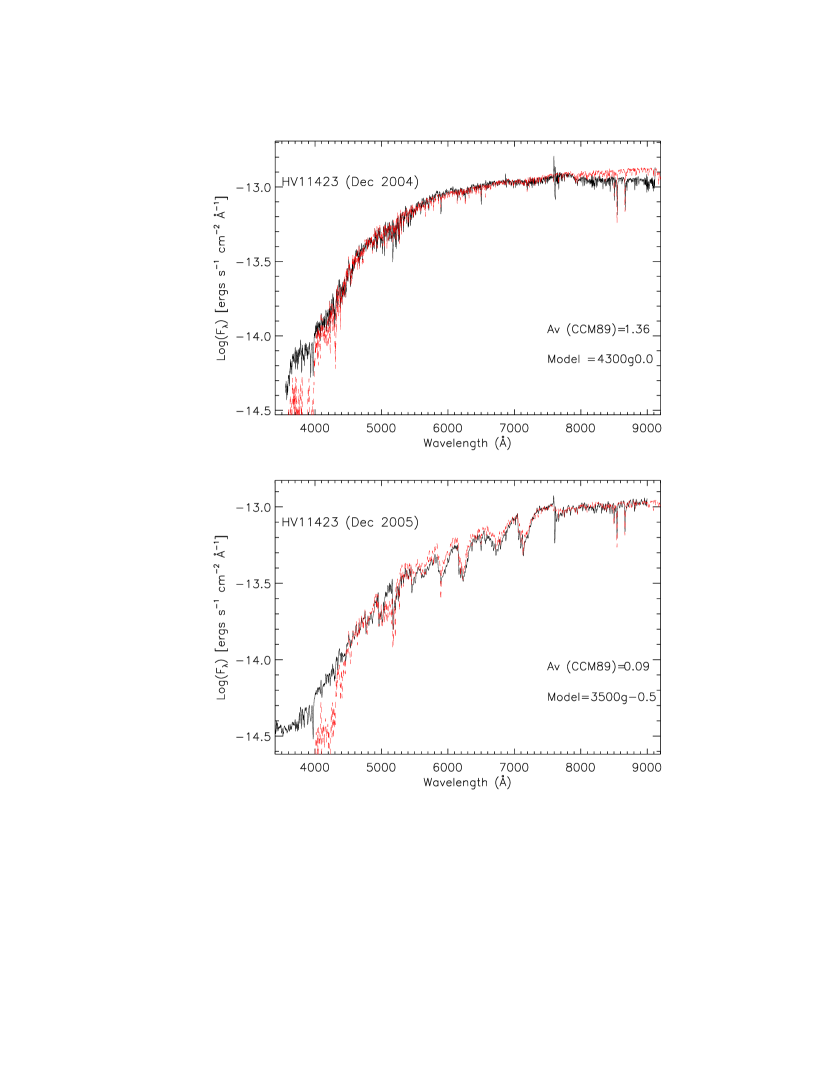
First, we fit the synthetic spectra to the observed spectral energy distribution, beginning with the models and allowing the effective temperature of the model and the amount of extinction, , to vary until we obtain a satisfactory fit. For this, we adopt the standard Cardelli et al. (1989) reddening law. For an early K-type star, the procedure is not very exact, with an uncertainty of 100 K in the derived effective temperature, owing to the lack of strong, temperature-dependent spectral features at this dispersion, and the overall degeneracy between reddening and effective temperature in terms of the continuum shape. For late-type M supergiants, the precision is considerably better, about 25 K, owing to the sensitivity of the strong TiO bands to effective temperature. Once a satisfactory fit is obtained, we compute the absolute visual luminosity , and then determine the bolometric luminosity using a relationship between the bolometric correction and effective temperature from the MARCS models (Paper II). We can then use an approximate relation between mass and luminosity (see Papers I and II), and the star’s location on the HRD, to estimate the expected value for . If the value is significantly different (0.3 dex) from 0.0, we repeat the fit using models with more appropriate surface gravities. In practice, changing has a minimal effect on the derived , and no effect on the deduced . The spectral fits are shown in Fig. 5, and the results given in Table 2.
We note that neither spectral fit is very satisfactory, and neither is as good as what we usually achieve (Papers I and II). The fit to the 2004 spectrum (K0-1 I)is shown in the upper panel. The extinction used is the best compromise. A lower value () would provide better agreement in the far red (8000Å), but would result in a much worse fit in the 6000-7000Å region. Changing the temperature to either higher or lower values results in a poorer fit, but a change by 100 K in either direction is only marginally worse. The fit to the 2005 spectrum (M4 I) shown in the lower panel does better in terms of fitting both the continuum and TiO line depths, and the latter constrain to 25 K of the 3500 K value. The slight mismatch at 5200Å is an artifact of the smoothing process of the synthetic spectra; see discussion in Section 3.2 of Paper II. In neither case is the extinction value characteristic of the massive stars in the SMC, where the distribution is tightly peaked at (Massey et al. 1995). In both fits, there is significantly more flux from the star in the near-UV than in the models. This problem, though, occurs for most of our RSGs fits, and Massey et al. (2005) argue that this is due to the scattering of light by circumstellar dust.
The second method uses the photometry to obtain an effective temperature. We adopt from the spectral fits, and determine , following Schlegel et al. (1998). We next determine using the calibration we determined in Paper II between the effective temperatures of the MARCS models and their colors. We then determine the star’s absolute K-band luminosity , and apply a K-band bolometric correction (which will be positive) to determine the bolometric luminosity.
We give the results of our fits in Table 2. For each year, the agreement between the spectral fit and the results from photometry is remarkably good. In Paper II we found that there tended to be a systematic difference between the values determined from spectral fitting and from the broad-band photometry, with the latter 105 K higher (on average) for SMC stars. This is similar to the 180 K (2004) and 135 K (2005) differences seen here. Despite this, the bolometric luminosity of the star are nearly identical for the two methods.
The good agreement in effective temperatures between spectral fittings and for the 2004 K0-1 I observation requires the unusually high reddening we find from the model fitting: if the reddening was more similar to that of the average SMC () rather than , the effective temperature from would be about 500 K cooler, and it would disagree considerably with the spectral fitting. So, we feel that the high reddening for the 2004 K0 I observation must be real. The reddening for the 2005 M0 I observation is slightly spuriously low: if we adopted a slightly higher surface gravity model () our best fit then requires . This would raise the temperature only slightly, by 80 K.
More remarkable is the fact that despite the tremendously large change in apparent spectral type (K0-1 I to M4 I) and the 1.9 mag change in , the derived bolometric luminosity is essentially the same for the 2004 and 2005 observations: the change in is largely compensated by the change in and the change in the bolometric correction.
Let us briefly consider the 1978-1979 observations. For (October 1978), the implied temperature from is 3680 K, where we have assumed that the star’s reddening is average for the SMC. Given that, we find it surprising that the 1978 spectrum was that of an M0 I star. That temperature would correspond to that of an M2 I, and if we correct by 105 K (as per above), more like an M3.5 I. The 1979 observation, however, in which , yields an effective temperature of 3995 K, assuming , more like an early K-type (see Paper II), rather than the observed M0 I type. We conclude that if the published spectra and photometry were obtained contemporaneously, as Elias et al. (1985) imply, then the visual extinction must have changed considerably between the 1978 and 1979 observations. Still, that appears to be at variance with the constant observations.
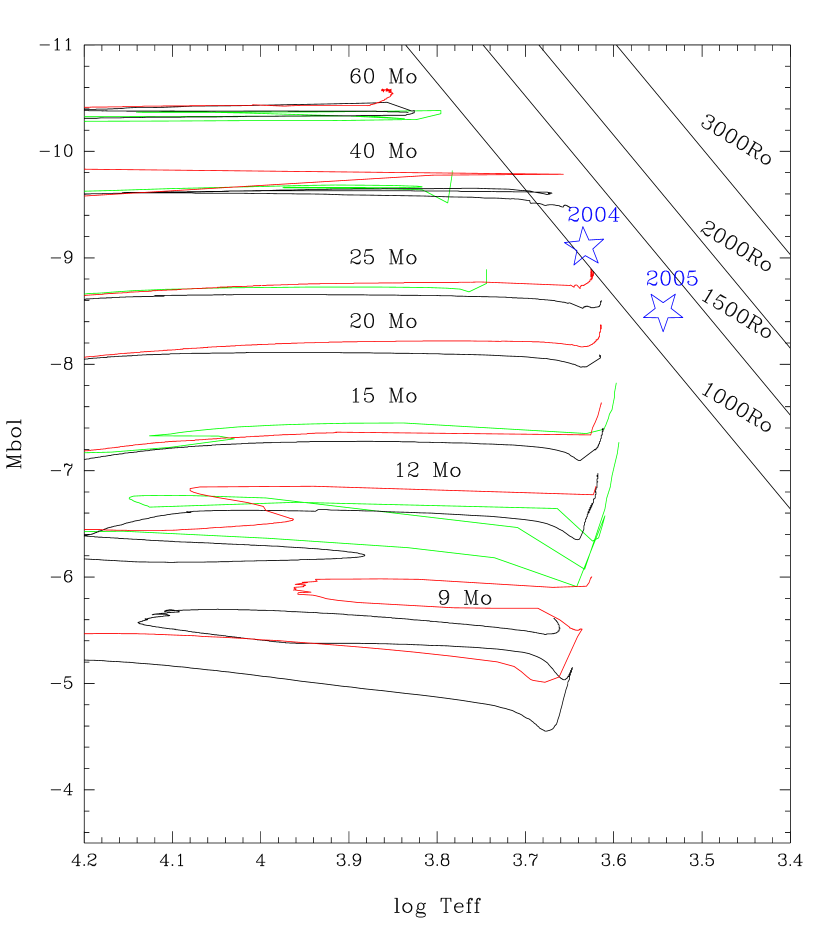
Finally, we note that at the time of the 2001 December M4.5-5 I observation of the star would have been made when (Fig. 4, implying . If we deredden this by as above, then the effective temperature would have been 3420 K. Corrected by 105 K, would lead to a temperature of 3315 K, making this one of the coolest RSGs known in any galaxy (see Table 4 of Paper II). Were the reddening higher than the we assumed, then the temperature would be warmer, but such a cool temperature is consistent with the very late (M4.5-5 I) spectral type.
4 So What’s Going On?
The 2001 and 2005 M4-5 I spectral types are the latest seen in the SMC, and the implied cool effective temperature places the star clearly in the Hayashi “forbidden zone”, as shown in Fig. 6: the star is well to the right of where the evolutionary tracks end. Such stars should not be in hydrostatic equilibrium, and in the case of HV 11423 we suspect that this is just what is happening: that the star is undergoing huge bursts of mass-loss combined with spectral (and photometric) variability. Dust condenses a few stellar radii away from the star, and as Massey et al. (2005) showed, this dust can substantially alter the circumstellar environment, creating extra extinction and reddening. Such dust would have little effect on the -band magnitude, but would be observable further in the infrared. Consistent with this is the fact that HV 11423 is an IRAS source.
We can estimate the dust mass-loss rate from the ratio of the flux at 12m (due to dust) to the flux in the K-band (due to the star), following Josselin et al. (2000). The 12m magnitude [12] is defined as , where is the IRAS flux at 12 (in Jy, and uncorrected for color), and the numerical factor has been chosen so that [12]=0 for a 10,000 K star. Stars with positive [12] will have some 12m excess, as the index has little sensitivity to effective temperature. Josselin et al. (2000) derive
where is the dust production rate in units of yr-1. For Jy, [12]=5.99. We assume , based upon dereddening by the average SMC (), and thus [12]=1.93. The implied dust production rate is yr-1.
This value is fairly high for a Galactic RSG, but not phenomenally so—there are RSGs with 4-5 times higher, and indeed we would expect a higher rate if this were a Galactic RSG with such a high bolometric luminosity. But, in the SMC, where the metallicity is low, this rate is apparently as high as seen in any RSG. In Table 4 we list all of the SMC RSGs and RSG candidates which are associated with IRAS sources at 12m. Given that is likely variable for all of these sources at the 0.2 mag level, and that the IRAS fluxes are uncertain at a similar level, we conclude that all four of these SMC RSGs had similar dust production rates at the time the IRAS data were taken.
Is this amount of mass-loss sufficient to account for the change in the observed extinction between our 2004 and 2005 observations? ( mag, according to Table 2). Massey et al. (2005) note many examples where RSGs in Galactic clusters and OB associations show extinction in excess of 1 mag compared to early-type stars in the same region, and show that this extra extinction is correlated with the bolometric luminosity and dust production rates. Massey et al. (2005) describe a very simple thin shell approximation that shows that the amount of extinction is of the right order of magnitude using very conservative assumption. We do not know the distance from the star that the dust will condense, nor do we know the thickness of the shell (corresponding to the duration of episodic mass-loss), but if we take reasonable values (10 yrs and 3 stellar radii, see Danchi et al. 1994), we expect about 1.5 mag of extinction at for a dust production rate of yr-1. Of course, this comes from a single observation, and without continued mid-IR observations, we do not know how representative this dust production rate is.
As described in some detail by Massey et al. (2005), for grain sizes that are typical of those found in the ISM, the primary effect of such a dust shell in the yellow-red will be to add extra reddening. If the particle sizes were larger, we would expect grey extinction, that would be harder to notice. The variability in might be due to the variability in the visual extinction caused by dust, as is the case with R Coronae Borealis type stars (Hecht et al. 1984), and some long period variables (i.e., L2 Pup, Bedding et al. 2002), as the extra we found (Table 2) is of the correct order of magnitude as the star’s observed variability in . However, if the star’s bolometric luminosity is essentially constant, as our findings seem to indicate, despite the large swings in effective temperature, then we would expect differences in the bolometric correction to account for much of the variability at .
The near constancy of despite the large changes in is consistent with the large changes in the effective temperature being the dominant source of -band variability. A change in effective temperature from 4300 K to 3300 K (such as we measure from the star’s spectra) would change the intrinsic by only 0.07 mag, according to the MARCS models. In contrast, a change in of 2 mag (needed if variability in the dust was the culprit) would change the star’s color by 0.65 mag, if the ratio of total to selective extinction were normal. However, this might be ameliorated by extra blue and near-UV light being scattered into the line of sight by dust close to the star, as described by Massey et al. (2005). Such UV excesses are known around R Coronae Borealis type stars, and may explain why the (limited) data remains relatively constant despite changes in the overall reddening in the yellow-red part of the spectrum.
We propose that HV 11423 is undergoing an unusual period of instability, during which its effective temperature changes from 4300 K to 3300 K on a time-scale of a year or less. During these swings the star stays at constant bolometric luminosity, or nearly so. What causes the large variations in ? Mostly this is due to the change in effective temperatures, as is apparent from comparing the physical properties associated with the 2004 December and 2005 December observations (Table 2). The star changed by only 0.6 mag in while staying at essentially the same radius. The absolute visual magnitude (i.e., corrected for extinction) changed by 1.9 mag, due to the change in effective temperature. The change in extinction by mag helped ameliorate the effect on in this particular instance, resulting in a of only 0.6 mag. But without the change in the variation in would have been nearly 2 mag. In general, when the star is very cool we expect the star to be out of hydrostatic equilibrium (as it is well into the Hayashi forbidden zone), and we can expect that copious mass-loss, with associated dust production, occurs. As Massey et al. (2005) showed, such dust loss can lead to a magnitude or more of visual extinction. Neither the changing temperature, nor the dust production, would have much affect at , as the bolometric correction changes by only 0.5 mag for this temperature range, and the extinction at is only 12% of what it is at . The idea that the changing is partially due to dust extinction may also help explain the complexity of the light curve. It may also explain how the star could be observed as M0 I both in 1978 and 1979 despite the large change in , although this seems to be in conflict with the published photometry.
We briefly considered an intriguing alternative, namely that the star is a spectral composite binary. If the system consisted of a late-type M star heated on one side by a hot companion, this would provide an explanation for the changing spectral type and brightness. The apparent change in reddening might also be explained by this, as it would simply be an artifact of fitting the spectral energy distribution with a model of a single temperature. However, the explanation might be hard to reconcile with the lack of periodicity in the light-curve, and the intermediate M0 I type that was observed both in 1978 and 1979. It would also not explain why the star is such a strong 12m source. Finally, it would mainly just add a complication (binarity) to the principle mystery, namely how such a late-type star could exist in the SMC. An M4-5 I star in the SMC should be unstable, and we consider it more likely that the variability is intrinsic to the cool temperature. Still, radial velocity monitoring would be useful.
Spectral variability, such as what we have found here for HV 11423, has never been associated with red supergiants, although it is reminiscent of the properties of variable stars found in other regions of the HRD. For instance, the RV Tau variables are (low luminosity) yellow supergiants which change their spectral types by about one class, being F to G at minimum light and G to K at maximum. These stars also show large IR excesses due to dust (see, for example, Jura 1986). Other variables at the tip of the asymptotic giant branch, such as the Mira variables also show spectral variability, as well as dust (see, for example, Whitelock et al. 2003). The physics of these variables are not particularly well understood, and their relevance to the spectral variability we see in this supergiant is not obvious. However, Levesque et al. (2007) have recently studied a sample of other late-type RSGs in the Magellanic Clouds. At least two of these stars also show evidence of spectral variability on the time-scale of a few years, [M2002] SMC 046662 and LMC 170452.
Stars that somehow find themselves in the Hayashi forbidden region of the H-R diagram should struggle to quickly regain hydrostatic equilibrium, and that is consistent with the fact that HV 11423 returns to an early K-type within months of being in its late-type state in December 2005. (We suspect that a similar thing happened in December 2001.) Why then was the star observed to be of intermediate type (M0 I) both in October 1978 and October 1979? Could this instability have just recently set in? If that is the case, then perhaps we are witnessing the early death throes of this RSG. Kiss et al. (2006) have recently analyzed the historical light curves of a large sample of Galactic RSGs, and they identify a small subset that have large -band variability, similar to what is seen here. They propose that this is an indicator of a “super-wind” phase that precedes the supernova stage. Clearly continued photometric and spectroscopic monitoring of HV 11423 is warranted.
References
- (1) Bedding, T. R., Zijlstra, A. A., Jones, A., Marang, F., Matsuura, M., Retter, A., Whitelock, P. A., & Yamamura, I. 2002, MNRAS, 337, 79
- (2) Bessell, M. S., & Brett, J. M. 1988, PASP, 100, 1134
- (3) Cardelli, J. A., Clayton, G. C., & Mathis, J. S. 1989, ApJ, 345, 245
- (4) Carpenter, J. M. 2001, AJ, 121, 2851
- (5) Charbonnel, C., Meynet, G., Maeder, A., Schaller, G., & Schaerer, D. 1993, A&AS, 101, 415
- (6) Cioni, M.-R. et al. 2000 A&ASS, 144, 235
- (7) Cowley, A. P. 1969, PASP, 81, 297
- (8) Danchi, W. C., Bester, M., Degiacomi, D. G., Greenhill, L. J., & Townes, C. H. 1994, AJ, 107, 1469
- (9) Egan, M. P. et al. 003, Air Force Research Laboratory Technical Report AFRL-VS-TR-2003-1589
- (10) Elias, J. H., Frogel, J. A., & Humphreys, R. M. 1985, ApJS, 57, 91
- (11) Glass, I. S. 1979, MNRAS 186, 317
- (12) Goldberg, L. 1984, PASP, 96, 366
- (13) Gustafsson, B., Bell, R. A., Eriksson, K., & Nordlund, Å. 1975, A&A, 42, 407
- (14) Gustafsson, B., Edvardsson, B., Eriksson, K., Mizumo-Wiedner, M., Jorgensen, U. G., & Plez, B. 2003, in ASP Conf. Ser. 288, Stellar Atmosphere Modeling, ed. I. Hubeny, D. Mihalas, & K. Werner (San Francisco: ASP), 331
- (15) Hack, M., Engin, S., Yilmaz, N., Sedmak, G., Rusconi, L, & Boehm, C. 1992, A&AS, 95, 589
- (16) Harper, G. M., Brown, Al., Bennett, P. D., Baade, R., Walder, R., & Hummel, C. A. 2005, AJ, 129, 1018
- (17) Hecht, J. H., Holm, A. V., Donn, B., & Wu, C.-C. 1984, ApJ, 280, 228
- (18) Humphreys, R. M 1978, ApJS, 38, 309
- (19) Humphreys, R. M. 1979, ApJ, 231, 384
- (20) Hyland, A. R., Becklin, E. E., Neugebauer, G., & Wallerstein, G. 1969, ApJ, 158, 619
- (21) Jascheck, C., & Jaschek, M. 1990, The Classification of Stars (Cambridge, Univ. of Cambridge Press)
- (22) Josselin, E., Blommaert, J. A. D. L., Groenewegen, M. A. T., Omont, A., & Li, F. L. 2000, A&A, 357, 225
- (23) Jura, M. 1986, ApJ, 309, 732
- (24) Kiss, L. L., Szabo, Gy. M., & Bedding, T. R. 2006, MNRAS, 372, 1721
- (25) Levesque, E. M., Massey, P., Olsen, K. A. G., & Plez, B. 2007, ApJ, to be submitted
- (26) Levesque, E. M., Massey, P., Olsen, K. A. G., Plez, B., Josselin, E., Maeder, A., & Meynet, G. 2005, ApJ, 628, 973 (Paper I)
- (27) Levesque, E. M., Massey, P., Olsen, K. A. G., Plez, B., Meynet, G., & Maeder, G. 2006, ApJ, 645, 1102 (Paper II)
- (28) Loup, C., Zijlstra, A. A., Waters, L. B. F. M., & Groenewegen, M. A. T. 1997, A&AS, 125, 419
- (29) Maeder, A., & Meynet, G. 2001, A&A, 373, 555
- (30) Massey, P. 2002, ApJS, 141, 81
- (31) Massey, P., Lang, C. C., DeGioia-Eastwood, K., & Garmany, C. D. 1995, ApJ, 438, 188
- (32) Massey, P., Levesque, E. M., & Plez, B. 2006, ApJ, 646, 1203
- (33) Massey, P., & Olsen, K. A. G. 2003, AJ, 126, 2867
- (34) Massey, P., Plez, B., Levesque, E. M., Olsen, K. A. G., Clayton, G. C., & Josselin, E. 2005, ApJ, 634, 1286
- (35) Maurice, E. et al. 1987, A&AS, 67, 423
- (36) Maurice, E., Bouchet, P., & Martin, N. 1989, A&AS, 78, 445
- (37) Morgan, W. W., & Keenan, P. C. 1973, ARA&A, 11, 29
- (38) Morgan, W. W., Keenan, P. C., & Kellman, E. 1943, An Atlas of Stellar Spectra (Chicago, Univ. of Chicago Press)
- (39) Moshier, M. et al. 1990, IRAS Faint Source Catalogue, version 2.0
- (40) Nail, V. M. 1942, Ann Harvard College Obs, 109, 27
- (41) Plez, B. 2003, in ASP Conf. Ser. 298, GAIA Spectroscopy: Science and Technology, ed. U. Munari (San Francisco: ASP), 189
- (42) Plez, B. Brett, J. M., & Nordlund, Å 1992, A&A, 256, 551
- (43) Pojmanski, G. 2002, Acta Astronomica, 52, 397
- (44) Sandage, A., & Tammann, G. A. 1974, ApJ 191, 603
- (45) Sanduleak, N. 1989, AJ, 98, 825
- (46) Schlegel, D. J., Finkbeiner, D. P., & Davis, M. 1998, ApJ, 500, 525
- (47) Schroeder, K.-P. 1985, A&A 147, 103
- (48) Shapley, H., & Nail, V. M. 1951, Proc. Nat. Acad. Sci. 37, 138
- (49) Skrutskie, M. F. et al. 2006, AJ, 131, 1163
- (50) van den Bergh, S. 1968, JRASC, 62, 145
- (51) van den Bergh, S. 2000, The Galaxies of the Local Group (Cambridge: Cambridge Univ. Press)
- (52) Wallerstein, G. 1958, PASP, 70, 479
- (53) Wallerstein, G. 1977, ApJ, 211, 170
- (54) Wallerstein, G., & Gonzalez, G. 2001, PASP, 113, 954
- (55) Westerlund, B. E. 1997, The Magellanic Clouds (Cambridge: Cambridge Univ. Press)
- (56) Whitelock, P. A., Feast, M. W., van Loon, J. Th., & Zijlstra, A. A. 2003, MNRAS, 342, 86
- (57) Wright, K. O. 1970, Vistas in Astronomy, 12, 147
- (58) Zacharias, N., Urban, S. E., Zacharias, I., Wycoff, G. L., Hall, D. M., Monet, D. G., & Rafferty, T. J. 2004, AJ, 3043
- (59)
| 4-m Dec 2004 | 4-m Dec 2005 | 1.5-m Sep 2006 | 4-m Sep 2006 | |||||
|---|---|---|---|---|---|---|---|---|
| Parameter | BLUE | RED | BLUE | RED | ||||
| Grating/l mm-1 | KPGL1(I)/632 | KPGLF(I)/632 | KPGL2(I)/316 | KPGL2(I)/316 | 26/600 | KPGL3/316 | ||
| Blocking Filter | GG345 | GG495 | BG39 | WG495 | None | None | ||
| Wavelength Coverage(Å ) | 3550-6420 | 6130-9100 | 3400-6200 | 5300-9000 | 3540-5300 | 4200-6700 | ||
| Slit Width (”/m) | 2.5/375 | 2.5/375 | 1.5/225 | 1.5/225 | 2.0 /110 | 2.0 /300bbFiber. | ||
| Dispersion(Å pixel-1) | 1.01 | 1.04 | 1.99 | 2.00 | 1.48 | 1.39ccDispersion is for 2-pixel binnning. | ||
| Resolution(Å) | 3.8 | 3.8 | 7.5 | 7.5 | 4.3 | 4.9 | ||
| HJD (2440000+) | 13343.68 | 13341.59 | 13725.64 | 13724.67 | 14003.62 | 14006.77 | ||
| exposure time (s) | 200 | 100 | 300 | 100 | 900 | 900 | ||
| S/NddS/N per spectral resolution element measured in mid spectral range. | 40 | 95 | 40 | 50 | 35 | 90 | ||
| parallactic angle? | yes | yes | yes | yes | no | nobbFiber. | ||
| Method | (K) | ||||||
|---|---|---|---|---|---|---|---|
| 2004 Dec (K0 I, V=11.84) | |||||||
| Spectral fit | 4300 | 1.35 | -0.2 | -8.4 | -9.1 | 1060 | |
| V-K | 4480 | 1.35aaThe spectral fit is adopted in determining the V-K physical properties. | -0.1 | -11.1 | -9.1 | 960 | |
| 2005 Dec (M4 I, V=12.46) | |||||||
| Spectral fit | 3500 | 0.10 | -0.4 | -6.5 | -8.5 | 1220 | |
| V-K | 3635 | 0.10aaThe spectral fit is adopted in determining the V-K physical properties. | -0.2 | -11.1 | -8.3 | 1000 | |
| Namebb“SMC” designations are from Massey 2002; i.e., [M2002] SMC005092, etc. | Type | Ref | IRAS Source | ccTypical uncertainty in is 20%[Jy] | [S12]dd is approximated from the 2MASS plus 0.044 (to convert to a “standard” Bessell & Brett (1988) following Carpenter 2002) minus 0.03 (to correct for average extinction in ). |
|---|---|---|---|---|---|
| SMC005092 | M1 I | 1 | F00432-7321 | 0.15 | 2.4 |
| SMC018592 | K5-M0 Ia,K0-2 I | 1,2 | F00493-7259 | 0.17 | 1.9 |
| HV11423 | K0-1 I/M4 I | 3 | F00592-7153 | 0.11 | 1.9 |
| SMC055188 | M3-4 I | 4 | F01014-7218eeComposite source? | 0.11 | 2.6 |
References. — For spectral types: (1) Elias et al. 1985; (2) Massey & Olsen 2003; (3) This paper (4) Levesque et al. 2007.