On the X-ray and optical properties of the Be star
HD 110432:
a very hard-thermal X-ray emitter††thanks: Based on the public data archive of the XMM-Newton, an ESA science mission with instruments and contributions directly funded by ESA Member
States and NASA.
HD 110432 is the first proposed, and best studied, member of a growing group of Be stars with X-ray properties similar to $γ$ Cas. These stars exhibit hard-thermal X-rays that are variable on all measurable timescales. This emission contrasts with the soft emission of “normal” massive stars and with the nonthermal emission of all well known Be/X-ray binaries – so far, all Be + neutron star systems. In this work we present X-ray spectral and timing properties of HD 110432 from three XMM-Newton observations in addition to new optical spectroscopic observations. Like $γ$ Cas, the X-rays of HD 110432 appear to have a thermal origin, as supported by strongly ionized Fe xxv and Fe xxvi lines detected in emission. A fluorescent iron feature at 6.4 keV is present in all observations, while the Fe xxvi Ly line is present in two of them. Its X-ray spectrum, complex and time variable, is well described in each observation by three thermal plasmas with temperatures ranging between 0.2–0.7, 3–6, and 16–37 keV. Thus, HD 110432 has the hottest thermal plasma of any known Be star. A sub-solar iron abundance ( 0.3–0.5) is derived for the hottest plasma, while lines of less excited ions at longer wavelengths are consistent with solar abundances. The star has a moderate 0.2–12 keV luminosity of 51032 erg s-1. The intensity of the X-ray emission is strongly variable. Recurrent flare-like events on time scales as short as 10 seconds are superimposed over a basal flux which varies on timescales of 5–10103 seconds, followed by similarly rapid hardness variabilities. There is no evidence for coherent oscillations, and an upper limit of 2.5% is derived on the pulsed fraction for short pulsations from 0.005 to 2.5 Hz. In the optical region the strong and quasi-symmetrical profile of the H line (EW -60 Å) as well as the detection of several metallic lines in emission strongly suggest a dense and/or large circumstellar disk. Also, the double-peaked profiles of metallic lines confirm the nearly edge-on projection of that disk noted recently by Smith & Balona. HD 110432 has several properties reminiscent of the cataclysmic variables such as a very hot X-ray temperature and some of its detailed spectral features. This suggests that it might be a Be star harbouring an accreting white dwarf. On the other hand, recent evidence of magnetic activity reported in the literature of HD 110432 suggests an interaction between the surface of the Be star and its disk can produce the X-rays.
Key Words.:
stars: emission-line, Be – stars: individual: HD 110432.1 Introduction
Although $γ$ Cas (B0.5 Ve) has long stood out as having unique X-ray properties among massive stars, accumulating evidence suggests that it is only the first of a growing subclass of X-ray active Be stars. HD 110432 (B0.5-1 III-IVe; Codina et al. 1984; Dachs et al. 1986; Smith & Balona 2006) was the first proposed $γ$ Cas analog on the basis of its mean 2–10 keV fluxes and energy distribution, and optical and X-ray variability properties (Robinson et al. 2002; Smith & Balona 2006). Other similar objects are HD 161103, SAO 49725, USNO 0750–13549725, SS 397 (Motch et al. 1997, 2006; Lopes de Oliveira et al. 2006), and HD 119682 (Rakowski et al. 2006; Safi-Harb et al. 2007). Altogether, these objects point to a new class of X-ray emitters (Motch et al. 2006; Lopes de Oliveira et al. 2006) composed of Be stars having an unusual hard-thermal X-ray emission (T 7 keV) of moderate luminosity (a few 1032 erg s-1, at 0.2–12 keV), which displays marked variability on long and short time scales. However, in contrast with the behaviour of many Be/X-ray systems, no outburst has yet been observed from any $γ$ Cas system. Curiously, all known members are B0.5e-B1e stars.
The nature of the X-ray emission of $γ$ Cas and its analogs is currently a matter of controversy. Two exciting interpretations have been proposed in the recent literature: [1] single-Be stars with unusually strong magnetic activity, and tentatively associated to progenitors of magnetars, [2] binary systems with an accreting degenerate companion – most likely Be + white dwarf (WD) systems, predicted by the evolutionary models of massive binary systems but still not identified, according to the thermal nature of their X-rays (see discussion in Lopes de Oliveira et al. 2006).
In order to understand the nature of these objects and eventually unveil the mechanism leading to their unusual X-ray emission, compared to that of “normal” B/Be stars and known Be/X-ray systems, we have started an extensive X-ray and optical program intended to search for, and study new $γ$ Cas analogs. Here we report on the X-ray properties of HD 110432 based on a campaign of three EPIC/XMM-Newton observations, along with optical observations. HD 110432’s properties are discussed in terms of single-star and accreting binary models.
| Obs. ID | EPIC | Date | Start time | Duration | Source countsa | GTIb |
|---|---|---|---|---|---|---|
| Cameras | (s) | (cts s-1) / (% of the events) | (% of the obs.) | |||
| 0109480101 | pn | 3 July 2002 | T15:51:56 | 49398 | 2.726 / 98.2% | 98.4% |
| (obs. 1) | MOS1 | T15:00:31 | 52778 | 0.740 / 97.3% | 100% | |
| MOS2 | T15:00:31 | 52778 | 0.994 / 97.2% | 100% | ||
| 0109480201 | pn | 26 August 2002 | T21:55:14 | 44823 | 2.269 / 95.0% | 52.6% |
| (obs. 2) | MOS1 | T21:03:49 | 47827 | 0.911 / 95.8% | 93.2% | |
| MOS2 | T21:03:50 | 47837 | 0.932 / 96.0% | 92.4% | ||
| 0109480401 | pn | 21 January 2003 | T01:07:38 | 44391 | 1.913/ 97.2% | 97.8% |
| (obs. 3) | MOS1 | T00:16:20 | 47764 | 0.663 / 96.5% | 99.2% | |
| MOS2 | T00:16:12 | 47772 | 0.644 / 96.9% | 99.8% |
-
a
data at 0.6–12 keV collected during all observation time, corrected on axis; b good time interval, after excluding times of enhanced soft-proton background: 1 (and 0.4) counts per second in the single-events pn (and MOS) light curve from whole camera, at E 10 keV.
2 Previous observations of the main properties of HD 110432
2.1 From the near-infrared to UV
HD 110432 is a bright B1IVe star ( = 5.2, = 5.5), located behind the Southern Coalsack, probable member of the open cluster NGC 4609 ( 60 Myr; Codina et al. 1984; Feinstein & Marraco 1971; Kilkenny et al. 1985; Kharchenko et al. 2005; Smith & Balona 2006). The UV-to near IR spectrum and the Balmer jump of HD 110432 imply a Teff of 25000 K and 22510 K, and of 3.5 and 3.9, respectively (Codina et al. 1984; Zorec et al. 2005). Zorec et al. (2005) estimated a mass of 9.6 for the star. HD 110432 is not known to be in a binary system. Rotational velocity measures derived using different optical and UV lines vary from 300 to 400 km s-1 (Slettebak 1982; Codina et al. 1984; Ballereau et al. 1995; Frémat et al. 2005; Smith & Balona 2006). For example, the He ii 1640 profile is similar in equivalent width and broadening to the feature in the $γ$ Cas spectrum. High resolution spectra obtained of HD 110432 by Smith & Balona (2006) in 2005 January–February show that the He i 4471, 5876, and 6678 lines include strong wings extending to at least 1000 km s-1. The cause of these wings is unknown. Although single previous observation of 4471 published by Ballereau et al. (1995) did not cover this full velocity range, their spectrum of this line in this object exhibited emission bumps to the blue and red of the line center that have not been reported in other spectra of the star. The He i and strong metallic lines in the yellow-red region shows symmetrical emission peaks spaced 100–115 km s-1 from line center. Similar features are observed in the near-infrared region, in the He i 10830 and HPaγ 10938 lines (peaks at 80 km s-1; Groh et al. 2007). Metallic emission features were also reported in photographic spectra of $γ$ Cas (Bohlin 1970). The kinematic separation and strengths of the peaks in HD 110432 indicate that the disk is viewed nearly edge on and that its mass and geometric extent are on the “high end” of what is typical for classical Be stars. The presence of a strong H line was reported by Dachs et al. (1986). The EW was -49Å in 1982 and -52.3Å in 1983.
Both optical spectroscopic and photometric variability is also prevalent in HD 110432. Smith & Balona (2006) found that the He i 5876 and 6678 lines often exhibit “migrating sub-features” (msf), which are narrow absorptions moving blue-to-red across the line profile. These appear in line profiles at irregular intervals and proceed across the profile with an acceleration near 100 km s-1 hr-1. Such features have been observed by several authors in the $γ$ Cas spectrum (Yang et al. 1988; Smith 1995; Smith & Robinson 1999).
A photometric period of either 1.77 or 1.42 days has been claimed for HD 110432 by Barrera et al. (1991) on the basis of 34 observations, but we cannot confirm this on the basis of photometric monitoring in 2002, as reported by Smith & Balona (2006). However, both the Cousins and -band light curves of this paper exhibited a clear 3–4% sinusoidal modulation with a timescale of 130 days in 2002.
2.2 X-ray properties
BeppoSAX follow-up observations (Torrejón & Orr 2001) of some hard X-ray sources discovered in the HEAO-1 all-sky survey (Tuohy et al. 1988) revealed the unusual X-ray emission of HD 110432. The X-ray energy distribution was well described by a hot-thermal plasma model with T 11 keV or by a power law model with photon index 1.63 and a cut-off energy Ec 19.9 keV. This last model required additional gaussian lines at 6.76 keV and 8.4 keV. The first line, with an EW of 600–700 eV, was interpreted as an unresolved blend of the Fe xxv(6.7 keV) and Fe xxvi (6.97 keV) lines. As this feature is naturally predicted by the hot plasma model, a thermal interpretation of the X-ray emission was logically preferred. The BeppoSAX data did not show evidence for the presence of a fluorescent emission iron line at 6.4 keV. In the 2–10 keV band, the X-ray flux corrected for absorption ( 3.210-11 erg cm-2 s-1) yields a luminosity of 3.41032 erg s-1 if the distance to the system is 300 pc (Hipparcos; Perryman 1997). The X-ray spectrum of HD 110432 was affected by a hydrogen column of 1.1–1.41022 cm-2, more than the 21021 cm-2 value due to the Galactic reddening toward the star as derived from the colour excess (E(-) = 0.4; Rachford et al. 2001). A single “oscillation” with a timescale of 14 ks was also suspected by Torrejón & Orr (2001). These authors concluded that if this variation could be confirmed as periodic, it would provide evidence for HD 110432 being a high mass X-ray binary with an accreting WD companion. In their picture the X-ray variations could be caused by rotational modulation of a hot spot on this companion. Smith & Balona (2006) noted that the fluctuations similar to this single modulation also occur in the light curve of $γ$ Cas but these do not repeat regularly.
3 Observations
3.1 Optical observations
We observed HD 110432 using the ESO Multi-Mode Instrument (EMMI) on the 3.5-m New Technology Telescope (NTT) at La Silla, Chile, on two occasions. On 5 June 2003, an H spectrum was taken with the red arm in intermediate-resolution mode (REMD) and grating #6. The red arm is equipped with a mosaic of two thin, back-illuminated MIT/LL CCDs and this configuration results in a nominal dispersion of 0.4Å/pixel over the range 6440–7150Å. The resolution, measured from the widths of arc lines, is Å. The blue spectrum was taken with the blue arm in intermediate-resolution mode (BLMD) and grating #12. The blue arm is equipped with a Textronik TK1034 thinned, back-illuminated CCD and this configuration results in a nominal dispersion of 0.9Å/pixel over the range 3820–4750Å. The resolution, measured on arc lines, is Å.
On 10 May 2004, we observed the H region with the same configuration, but a slightly different grating angle, resulting in coverage of the 6170–6880Å range. The blue spectrum was taken with the red arm in exactly the same configuration, but using grating #7 instead. (The red arm has lower efficiency in the blue, but grating #7 allows a much better compromise between resolution and range than any blue grating). The spectrum covers the range 3800–5200Å, with a nominal dispersion of 0.85 Å/pixel and a measured resolution of Å.
3.2 X-ray observations
HD 110432 was serendipitously observed in a campaign of three XMM-Newton exposures of the Wolf-Rayet star WR 47 (see Table 1 for details). Its extreme off-axis position (in the range of 13′) does not allow it to be in the field of view of the high-resolution RGS cameras. Only the medium-resolution (E/E 20–50) EPIC cameras (MOS1, MOS2, and ) were able to detect HD 110432 in its fields, which cover an area of 700 arcmin2 in the used observational modes (extended full window for , and full window for MOS1 and MOS2). The observations were taken on 3 July 2002 (hereafter obs. 1), 26 August 2002 (obs. 2), and 21 January 2003 (obs. 3).

We use the Science Analysis Software (SAS) v6.5 and the most recent calibration files for the data processing. The spectral analysis was performed with Xspec v11.3.1.
In the following only single and double event patterns ( 4), and single to quadruple event patterns ( 12) were used for pn and MOS cameras, respectively. The only exception is in evaluating the parameters of the iron lines (Table 4 and Fig. 4) in which only single-pn events collected during the integrated observation were used in order to obtain the best possible energy resolution ( 150 eV at 6.4 keV)111XMM-Newton User’s Handbook, issue 2.4.. According to the epatplot/SAS task, the data are not affected by photon pile up.
Only a few time intervals were affected by slightly enhanced background of solar particles (Table 1). We exclude photons collected during these intervals when investigating the spectral energy distribution, and we use the entire observation for the timing analysis and investigation of parameters of the Fe K complex.
There is a residual shoulder around 0.3 keV in the spectra which could be due to bad cancellation of a strong absorption feature present in the thick filter. For that reason, we preferred to discard the low energy part of the spectrum below 0.6 keV. The background fluxes were extracted in large regions located in the same CCD as the source. For spectral studies, the energy channels of each camera were grouped in bins containing at least 150 events, and the phabs model was applied to account for the photoelectric absorption.
Throughout this paper, we use data collected by all EPIC cameras (MOS1, MOS2, and pn) in timing analysis, but owing to possible uncertainties in the cross-calibration between the three cameras at large off-axis angle we opted to use only the data for our spectroscopic analysis. We checked that the lower S/N MOS data yielded spectral parameters consistent with those derived from the EPIC .
4 Optical properties
There are numerous metallic emission lines in the blue and red spectra of HD 110432 (Fig. 1), chiefly arising from Fe ii transitions, in addition to strong H-Balmer lines. As for a number of Be stars (Slettebak et al. 1992), the detection of these lines in HD 110432 suggests the presence of a dense and/or large circumstellar disk, and according to the double-peak feature of the metallic lines, in a nearly edge-on orientation. We derive an equivalent width (EW) of -601Å for the H line.
Interestingly, the double-lobe emissions of the metallic lines seem more equal in Fig. 1 than those obtained by Smith & Balona (2006), in which on average the blue component was slightly stronger. We speculate that some kind of instability in the HD 110432’s disk is excited – most likely an one-arm disk instability (e.g. Okazaki 1991).
The presence of the emission lines renders difficult the identification of weak absorption features, and therefore the determination of the spectral type and luminosity class. The spectral type can be estimated from the presence of a moderately strong Si iv 4089Å line and a weak He ii 4686Å line to be close to B0.5-1, while the relative strength of the complex around C iii 4650Å suggests that it is likely to be a moderately luminous star. Thus, we conclude that the luminosity class of HD 110432 is compatible with III or IV.
5 The spectral energy distribution in X-rays
5.1 The epochal spectra
The XMM-Newton observations of HD 110432 were investigated separately for each epoch (as Table 1), because its X-rays are clearly dependent on epoch. For example, we find that the local absorption(s) varies between different observations. The star exhibits a hard X-ray spectrum, in which an Fe K complex in emission – composed of a fluorescent feature at 6.4 keV, Fe xxv (He-like) at 6.7 keV, and Fe xxvi (H-like) at 6.97 keV lines – is clearly detected in all observations. In addition, a Fe xxvi Ly line seems to be present in two of the three observations. In this Section, the X-ray continuum and ionized iron lines are used to obtain a description of the energy distribution of HD 110432, and put constraints especially on the Fe abundance determination from these lines.
Models with one or two thermal components do not give acceptable results. Replacing one of the thermal components by a power law, even though including a high energy cut-off, does not improve the quality of the fits. These models do not account simultaneously for the observed excess in the hard X-ray continuum and intensities of the He and H like iron lines, or for the soft continuum, even if each component is affected by different absorption columns. Likewise, the fits are not much improved by the addition of a second absorption for the hard component.
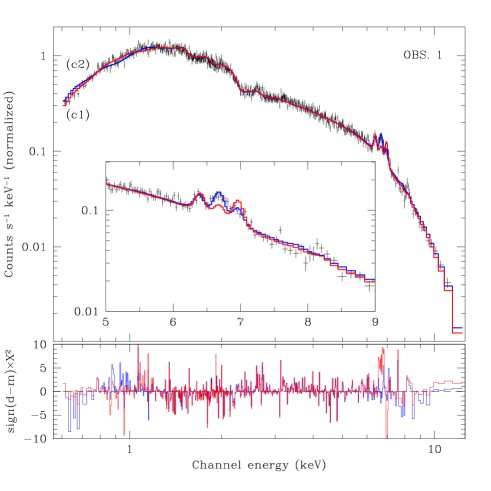
Thus, we note that the XMM-Newton spectrum strongly contrasts with the 1-T model derived by Torrejón & Orr (2001) from BeppoSAX observations. For example, we show in Fig. 2 the spectrum from obs. 1 and the 1-T and 2-T fits discussed above. A 1-T model results in NH 0.31022 cm-2, T 15.2 keV, 0.4 , and = 1.3. For the 2-T model, Fig. 2 shows the case in which both thermal components are affected by the same absorption column [N(T1+T2+GL)], and the case in which each plasma is affected by different absorptions [N(T1)+N(T2+GL)]. In the first case, we derive NH 0.331022 cm-2, T1 and T2 equal to 0.76 and 15.13 keV, respectively, 0.43 , and = 1.23. For the second case, N and T1 are equal to 0.341022 cm-2 and 5.89 keV, N and T2 of 0.281022 cm-2 and 28.94 keV, respectively, 0.26 , and = 1.15. (For the 2-T models the abundance values refer to the hottest component; solar values for the others).
| obs. 1 | obs. 2 | obs. 3 | |||||||
|---|---|---|---|---|---|---|---|---|---|
| M1 | M1d | M1 | [M1] | M1d | M1 | M1d | |||
| N (1022 cm-2) | 0.34 | 0.96 | 0.42 | [0.46] | 0.80 | 0.44 | 1.32 | ||
| T1 (keV) | 0.66 | 0.23 | 0.37 | [0.30] | 0.36 | 0.66 | 0.21 | ||
| (erg cm-2 s-1) | 7.810-13 | 4.610-11 | 1.110-12 | [2.710-12] | 6.310-12 | 5.210-13 | 7.110-11 | ||
| EM (1055 cm-3) | 0.03 | 2.1 | 0.04 | [0.1] | 0.3 | 0.02 | 3.4 | ||
| N (1022 cm-2) | … | 0.23 | … | […] | 0.17 | … | 0.97 | ||
| T2 (keV) | 5.40 | 5.90 | 3.49 | [1.55] | 4.69 | 5.68 | 4.45 | ||
| (erg cm-2 s-1) | 9.110-12 | 8.810-12 | 5.510-12 | [1.410-12] | 4.210-12 | 7.910-12 | 7.410-12 | ||
| EM (1055 cm-3) | 0.5 | 0.4 | 0.3 | [0.09] | 0.2 | 0.4 | 0.4 | ||
| N (1022 cm-2) | … | 0.47 | … | […] | 0.51 | … | 0.38 | ||
| T3 (keV) | 27.17 | 20.76 | 20.82 | [14.26] | 16.87 | 36.86 | 34.48 | ||
| (erg cm-2 s-1) | 3.710-11 | 3.810-11 | 3.210-11 | [3.710-11] | 3.410-11 | 3.110-11 | 3.410-11 | ||
| EM (1055 cm-3) | 1.9 | 2.0 | 1.7 | [1.9] | 1.7 | 1.7 | 1.7 | ||
| () | 0.31 | 0.24 | 0.45 | [0.44] | 0.37 | 0.52 | 0.89 | ||
| Line (keV) | 6.39 | 6.40 | 6.41 | [6.41] | 6.41 | 6.4b | 6.4b | ||
| (keV) | 0.05 | 0.01b | 0.01b | [0.01b] | 0.01b | 0.01b | 0.10 | ||
| Line (keV) | 8.2b | 8.2b | … | […] | … | 8.16 | 8.2b | ||
| (keV) | 0.11 | 0.001b | … | […] | … | 0.12 | 0.001b | ||
| (erg cm-2 s-1) | 4.810-11 | 9.310-11 | 3.910-11 | [4.110-11] | 4.410-11 | 4.210-11 | 1.110-10 | ||
| /d.o.f.a | 1.05/588 | 1.04/588 | 1.13/270 | [1.13/270] | 1.12/268 | 1.00/386 | 1.00/385 | ||
-
M1: N(T1+T2+T3+2 g. lines); M1d: NT1+NT2+N(T3+2 g. lines).
-
a degrees of freedom; b frozen parameter.
-
Notes: solar abundances for T1 and T2. Fluxes are given unabsorbed in the 0.2–12 keV energy band. Quoted errors are at the 90% confidence level.
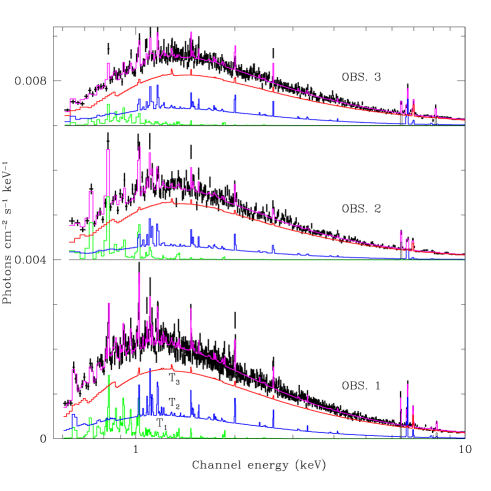
X-ray spectra are better described by the sum of three thermal components (3-T): a cool (T1 0.4–0.7 keV), a warm (T2 3–6 keV), and a hot plasma (T3 21–37 keV; see M1 in Table 2 and Fig. 3). About 80% of the 0.2–12 keV flux is due to the hot plasma, notably as for $γ$ Cas (Smith et al. 2004), while the warm and cool plasmas account for the other 18% and 2%, respectively. The same distribution is followed by the emission measure of each thermal component, with respect to the total value. The ionized iron lines are well described for this model, in which they arise from a combination of the hot (T 20 keV) and warm (T 4 keV) plasmas. The hot component accounts for a dominant contribution to the Fe xxv ( 58–72%) and Fe xxvi ( 82–95%) strength. Therefore, the high temperature of the hot component is required by the shape of the continuum and by the intensity of the ionized iron lines, being thus a reliable value even though derived from the limited 0.6–12 keV range. [In addition, it is worth noting that a significant fraction of the bolometric flux in X-rays ( 50%) of a plasma with T 30 keV is emitted in this energy range.] Finally, while a high temperature is otherwise uncertain for the EPIC instruments, at least the high temperature in the solution of obs. 1 and obs. 3 is correlated with the presence of the Ly line at 8.2 keV.
The Ly line, suspected in obs. 1 and obs. 3, cannot be reproduced by any thin thermal mekal222http://heasarc.nasa.gov/xanadu/xspec/manual/manual.html model we have tested, and a gaussian line was added. A second gaussian line accounts for the Fe fluorescence line at 6.4 keV, not included in the mekal code.
The column density derived from M1, 3–41021 cm-2, is larger than that due to the interstellar medium ( 21021 cm-2; Rachford et al. 2001). We note that these values are much lower than the values ( 2–51022 cm-2) derived by Smith & Balona (2006), but these latter were determined from emission V/R peaks of partially optically thick lines for formation regions coinciding with orbital disk segments aligned along the line of sight, thereby incurring absorption columns that are likely to be several times larger than the column to the Be star itself.333A NH 1022 cm-2 fails to produce satisfactory fits to the fluxes below 1.5 keV in M1. We hope to address the columns, and hence the geometry of the X-ray sites with a firmer column estimate from a planned high resolution Reflection Grating Spectrometer (RGS) observation along with medium resolution (EPIC) XMM-Newton spectra – scheduled for early September, 2007.
In obs. 1 and obs. 3 the fitting process following the model M1 converges toward a unique solution. In obs. 2, however, the fitting process finds two equally probable configurations with quite different temperatures for the three components, as well as different flux contributions and emission measures for the cool and warm components (Table 2). It seems, however, that the models with the highest temperatures provide a better description of the iron line complex. In the “cooler convergence” for obs. 2, the cool and warm plasma account for 4% each of the total value, and 6.5% and 3.5%, respectively, of the total 0.2–12 keV flux – in contrast with those contributions of the “hotter convergence” for obs. 2 and values derived from the other observations, summarized above.
Contrary to the warm and cool components, in which the fits result in abundances which are consistent with solar values for all elements, sub-solar abundances are clearly needed for the model parameters of the hot component. Using the vmekal model, we checked that setting a lower Fe abundance for the hot component while keeping the abundances of other metals to their solar values gives results consistent with those obtained by freeing the elemental abundances altogether (). Thus, this value is determined from the EW of the ionized iron lines.
So distinct temperatures strongly suggest complex X-ray environments. In this sense, we tried a number of 3-T models in which we:
-
(a) - determined two absorption columns, one for the hot component and another for the warm & cool components;
-
(b) - divided the hot plasma in (a) into two unequal subcomponents. The absorption of the first subcomponent is determined independently of the absorption of the other subcomponent, which is tied to the warm and cool components. The relative fractions of the two hot components is determined as a free parameter;
-
(c) - repeated the (b) model but forced the emission measures of the two hot subcomponents to be equal;
-
(d) - determined three absorption columns, one for each thermal component.
Models (a,b,c) do not improve the fits obtained from M1, and with two exceptions the derived parameters are consistent with those of M1 at the 90% confidence level. The two exceptions concern the hot component and its absorption following the model (b). According to this model, 15–50% of the hottest component is more strongly absorbed ( 10) than the other 50–85%. The latter hot subcomponent is tied to the absorption column of the warm and cool components, and the parameters for this column are consistent with those derived from M1 (see Table 2). Therefore, we can speculate that, similar to the X-ray spectrum of $γ$ Cas (Smith et al. 2004), the hottest component of HD 110432 is affected by multiple absorption columns. As a second exception, the hot temperatures in each observation are systematically cooler than those of M1 by about 30%. We also note that the (a,b,c) models result in two convergences for obs. 2. Both are consistent with those obtained from M1 in Table 2. The results of the models briefly discussed above corroborate the complex nature of the X-ray spectrum of HD 110432, already inferred from the simplified model M1.
Model (d) is somewhat different from those discussed above (see Table 2). First, the total unabsorbed flux is systematically higher in each observation, notably for obs. 1 and obs. 3. Second, the cool component, except for obs. 2, is now even cooler. This component is strongly absorbed and accounts for a major fraction of the total flux (ranging from 14% to 64% for different observations). Also, the cool plasma has a larger emission measure than the M1 model. No significant difference arises for fluxes and emission measures of the hot and warm components. We also note that this model results in a slightly lower temperature for the hot component.
As an alternative to the 3-T models discussed above, a good description of the observed X-ray energy distribution of HD 110432 is also obtained using a model composed of two thermal components (a cool, T 0.2–1.6 keV, and a hot, T 8–12 keV) added to a power law with a hard photon index (see Table 3). As in the 3-T models, the Fe xxv and Fe xxvi lines are well fitted by the thermal plasma model, and subsolar abundances, at least for Fe, are needed. In the 2-T + PL model, the power law accounts for part of the hard X-ray continuum ( 20% of the total 0.2–12 keV flux in all observations) and the iron lines can then be well represented by a single thermal component of temperature (T 10 keV) intermediate between those of the warm and hot plasmas in the 3-T model, and consistent with that obtained by Torrejón & Orr (2001). The flux contributions of the hot plasma is about 55 % of the total 0.2–12 keV flux in obs. 1, 70% in obs. 2, and 40% in obs. 3. However, as supported by the presence of the Ly line, we believe that the power law does not give a realistic description of the high energy tail in HD 110432.
| obs. 1 | obs. 2 | obs. 3 | |
| M2: NHaT1+N(T2+p. law+2 g. lines) | |||
| NHa (1022 cm-2) | 0.92 | 0.74 | 1.10 |
| T1 (keV) | 0.22 | 0.35 | 0.21 |
| (erg cm-2 s-1) | 3.910-11 | 4.110-12 | 2.710-11 |
| EM (1055 cm-3) | 1.8 | 0.2 | 1.3 |
| NHb (1022 cm-2) | 0.37 | 0.39 | 0.44 |
| T2 (keV) | 8.76 | 10.24 | 9.34 |
| (erg cm-2 s-1) | 3.210-11 | 3.010-11 | 2.610-11 |
| EM (1055 cm-3) | 1.7 | 1.6 | 1.4 |
| () | 0.43 | 0.42 | 0.50 |
| 1.09 | 1.04 | 1.02 | |
| (erg cm-2 s-1) | 1.510-11 | 8.010-12 | 1.510-11 |
| Line (keV) | 6.39 | 6.41 | 6.4b |
| (keV) | 0.06 | 0.07 | 0.01b |
| Line (keV) | 8.2b | … | 8.16 |
| (keV) | 0.001b | … | 0.11 |
| (erg cm-2 s-1) | 8.610-11 | 4.210-11 | 6.810-11 |
| /d.o.f.a | 1.07/588 | 1.17/268 | 1.01/385 |
| M3: NH(cemekl+p. law+2 g. lines) | |||
| NH (1022 cm-2) | 0.34 | 0.38 | 0.45 |
| Tmax (keV) | 27.90 | 35.20 | 29.51 |
| () | 0.53 | 0.55 | 0.58 |
| (erg cm-2 s-1) | 3.710-11 | 3.610-11 | 3.210-11 |
| 1.13 | 1.1b | 1.04 | |
| (erg cm-2 s-1) | 1.110-11 | 3.010-12 | 1.110-11 |
| Line (keV) | 6.4b | 6.41 | 6.4b |
| (keV) | 0.01b | 0.07 | 0.01b |
| Line (keV) | 8.20 | … | 8.16 |
| (keV) | 0.001b | … | 0.001b |
| (erg cm-2 s-1) | 4.810-11 | 3.910-11 | 4.310-11 |
| /d.o.f.a | 1.12/592 | 1.17/272 | 1.05/389 |
-
a degrees of freedom; b frozen parameter.
-
Notes: M2: solar abundances for T1. M3: = 1. Fluxes are given unabsorbed in the 0.2–12 keV energy band. Quoted errors are at the 90% confidence level.
We tried the cemekl444A multi-temperature emission model built from the mekal code – emission continuum/line spectrum from hot diffuse gas –, in which the emission measures of the plasmas follow a power law in temperature: EM (T/Tmax)α. model, largely used in cataclysmic variables systems (CVs) leaving the parameter free. The fit converges towards values of 1, in agreement with the adiabatic case. The resulting temperatures Tmax in the three observations range from 40 to 60 keV. However, this model gives slightly larger than those of models discussed above for two observations (=1.14, 1.15, and 1.06, for obs. 1, 2, and 3, respectively). It also predicts Fe xxvi and Fe xxv lines stronger and weaker than observed, respectively, and on this basis can probably be excluded. The bad fit quality achieved by the cemekl model to describe the ionized Fe xxv and Fe xxvi lines indicates that the 3-T description is most likely not the approximation of a spectrum emitted by a single region with a continuously variable temperature distribution, but rather reflects the existence of three physically separated sites of emission.
The addition of a power law component to the cemekl model improves the fits – due to the better description of the high energy part of the spectrum – but it does not provide mean values as low as those given by the 3-T model (see Table 3). We also tried a cemekl + soft thermal component to test the idea that part of the softest emission could arise in the shocked wind of the early type star. Again, the fit is improved but remains significantly worse than that of the 3-T model, primarily because of its inability to represent the details of the iron complex emission.
From the 3-T model shown in Table 2 the unabsorbed flux in the 2–10 keV energy band is 2.3–2.910-11 erg cm-2 s-1 in the XMM-Newton observations. This value is slightly lower than those obtained by BeppoSAX ( 3.210-11 erg cm-2 s-1; Torrejón & Orr 2001) and HEAO-1 ( 4.710-11 erg cm-2 s-1; Tuohy et al. 1988) satellites. Assuming a distance of = 300 pc to HD 110432 (Perryman 1997), implies a luminosity of 2.6–3.1 1032 erg s-1. In the 0.2–12 keV band, the unabsorbed XMM-Newton flux is about 3.9–4.8 10-11 erg cm-2 s-1, or 4.2–5.2 1032 erg s-1 for = 300 pc (Table 2).
In conclusion, our analysis strongly suggest that the X-ray emission of HD 110432 is a composition of three discrete plasmas with different volumes and temperatures. The highly ionized iron lines supports a thermal nature for the X-ray emission, and the presence of a very hot thermal component. However, we cannot conclusively argue if each component is affected by distinct absorptions or not. If not, then the hot plasma dominates the total X-ray emission ( 80%). If so, the coolest plasma is most likely strongly absorbed and responsible for a contribution in flux similar to the flux due to the hottest plasma.

| obs. 1 | obs. 2 | obs. 3 | |||||||||
| EC | EW | Fluxa | EC | EW | Fluxa | EC | EW | Fluxa | |||
| (keV) | (eV) | (10-5) | (keV) | (eV) | (10-5) | (keV) | (eV) | (10-5) | |||
| Fe K | 6.40 | 47.8 | 1.9 | 6.42 | 48.7 | 1.5 | 6.46 | 54.2 | 1.9 | ||
| Fe xxv | 6.70b | 159.0 | 5.8 | 6.68 | 126.0 | 3.7 | 6.67 | 86.9 | 3.0 | ||
| Fe xxvi Ly | 6.97b | 60.8 | 2.1 | 6.97 | 99.1 | 2.6 | 6.94 | 121.0 | 3.6 | ||
| Fe xxvi Ly | 8.18 | 109.0 | 2.2 | … | … | … | 8.14 | 152.0 | 2.9 | ||
-
a
total flux in line, in units of photons cm-2 s-1; b frozen parameter.
-
Notes: EWs estimated from a phabs(bremss+3 gaussian lines) model applied to spectra in the 5–10 keV energy range. EC are the centroids of the Gaussian lines. Quoted errors are at 1 .
5.2 The parameters of the iron lines in emission
The lines of the Fe K complex are the strongest resolved emission lines in the 0.2–12 keV spectrum of HD 110432, and all are clearly present in each XMM-Newton observation (Fig. 4). In evaluating the parameters of the iron lines, a thermal bremsstrahlung model was used to describe the 5–10 keV continuum, and four Gaussian lines were added to represent each of the fluorescence, Fe xxv, Fe xxvi, and the suspected Fe xxvi Ly lines.
Table 4 lists the equivalent width of each Fe component in each observation. The flux of the fluorescence line seems to be constant. On the other hand, the relative fluxes of each ionized component are slightly different in each epoch (Fig. 4 and Table 4), but their EWs are still mutually consistent at the 1 level. An apparent decrease is found for the He-like flux in each successive observation, while the contrary is the case for the H-like ion.
The suspected presence of the Fe xxvi Ly line at 8.2 keV is a novelty for spectra of any high-mass stellar X-ray source, whether emitted in the environs of the massive star or in a high-mass accretion binary system. Although the theory for the formation of this feature is not yet well developed in the literature, one can make a few simple statements from what is known about the recombination spectrum of lighter hydrogenic ions. First, the Ly to Ly strength ratio of such ions increases with temperature, but rather only slowly so. For example, we have found that the Ly/Ly line intensity ratio cannot be reproduced by any thin thermal mekal model. We believe that the clear differences in the Ly strength noted in Fig. 4 between obs. 2 and obs. 1 cannot be explained through the Boltzmann effect for the change in temperature, 21 keV to 27 keV, respectively (see e.g. Smith et al. 2001). Changes in this ratio are more likely caused by a transition to a mildly optically thick regime, wherein the Ly strength would be depressed through saturation. Alternatively, a suppressed emission of Ly could be caused by the superposition of some absorption due to resonance scattering – this would hint at a change in geometry of the plasma components. In either of the latter two alternatives, we might expect to see a difference in the derived iron abundance in obs. 2 relative to the other two observations. However, as shown in Table 5, any such effect must be small because the Fe abundances found for the three observations are internally consistent. While we still believe either of the latter two options offers a viable resolution of the problem, we must leave this as an unresolved issue.
5.3 The iron lines in emission and the hard continuum
We applied the cevmkl555A cemekl-like model, in which the abundance of each element is allowed to vary. model in the 6–8 keV energy range, in each observation, in order to estimate the ionization temperature (Tion) and iron abundance () required by the Fe xxv and Fe xxvi lines. Using the same model in the 4–6 + 8.4–12 keV energy range, we also estimate the temperature (Th,cont) needed to describe only the hard continuum.
| Tiona | a | T | |
|---|---|---|---|
| (keV) | ( solar) | (keV) | |
| obs. 1 | 8.74 | 0.23 | 17.76 |
| obs. 2 | 10.68 | 0.27 | 15.29 |
| obs. 3 | 9.87 | 0.26 | 24.62 |
-
a
based in the Fe xxv and Fe xxvi lines, using the 6–8 keV energy range; b from the 4–6 keV + 8.4–12 keV continuum.
-
Notes: Quoted errors are at the 90% confidence level.
The results are shown in Table 5. This analysis strongly suggests that Th,cont Tion, even though for obs. 2 at the 90% confidence level, in agreement with the presence of the excess in the hard X-ray continuum. The iron abundance, in all observations, is consistent with 0.25 .
6 Timing behavior of the X-ray emission
Figure 5 shows background- and barycentric-corrected light curves of HD 110432 in each XMM-Newton observation. We plot the light curves in the 0.6–2 keV and 2–12 keV energy bands, chosen to give comparable count rates, and the corresponding hardness ratio.
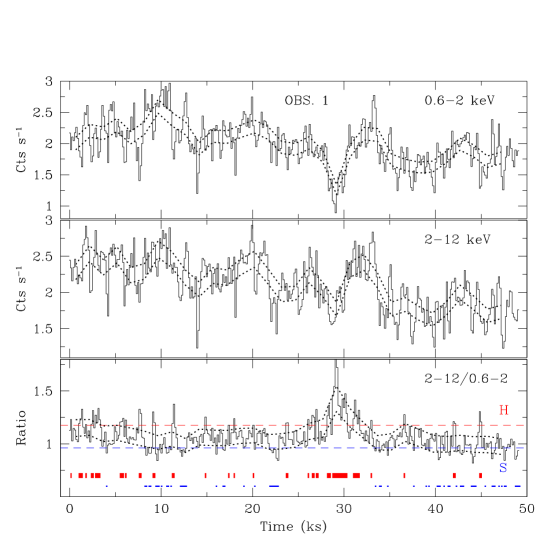
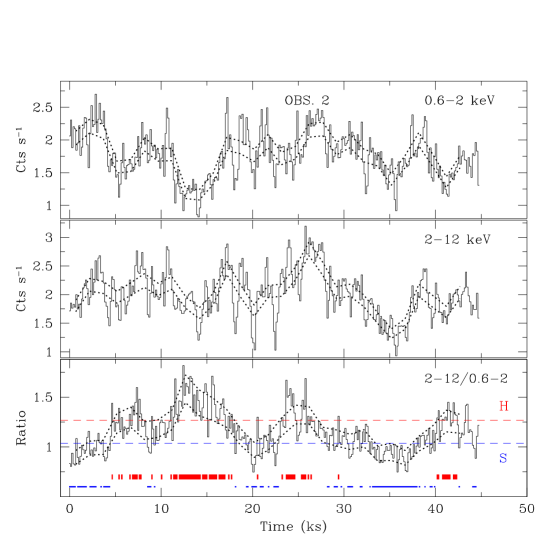
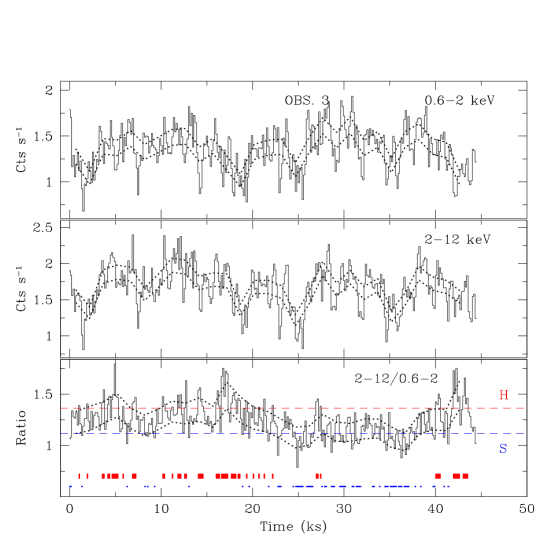
At all epochs the source shows strong intensity and hardness variations, in which ubiquitous flare are observed. The dotted lines in Figure 5 represents the 1 confidence belts derived from the photon statistic of 10 consecutive time bins of 150 s each. Interestingly, as for $γ$ Cas (Smith et al. 1998a), the shots in HD 110432 are clearly superimposed over a slowly varying basal flux, and they are detected in time scales as short as 10 s, a limit determined by photon statistics.
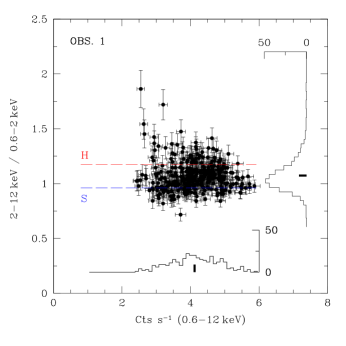
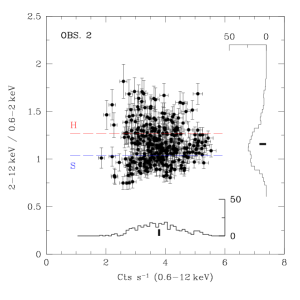
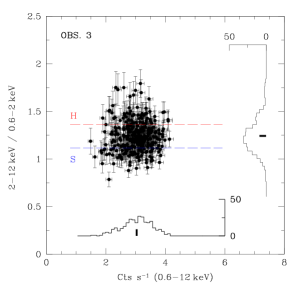
There is no evidence for a hardness-intensity correlation in HD 110432. Even so, there are some interesting features. First, the average (absorbed) intensity seems to decrease over the subsequent observations (see Table 1). (We note the divergent value for MOS2 on obs. 2, most likely due to an inadequate for the off-axis position). Second, the dispersion of the hardness ratio distribution is more accentuated in the second and third observations (Fig. 6). Finally, rapid hardness variability reveals that the X-ray energy distribution varies on short time scales.
6.1 Investigating the soft and hard states
The strong and rapid variations, clearly observed in the light curves of HD 110432, are accompanied by a similar behaviour of the hardness ratios (hereafter HR; Figure 5). The changes are apparently random and occur on time scales as short as tens of seconds.
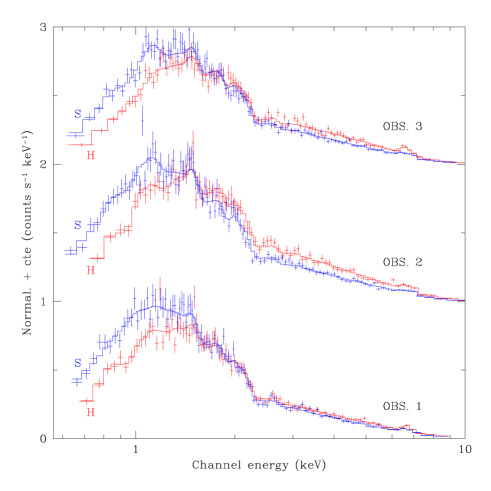
In order to try to investigate the detailed nature of the spectral variability of HD 110432, we went on to study spectra accumulated during times of soft (S) and hard (H) dominated emission. The corresponding HR limits were adopted as being smaller than 0.9 and larger than 1.1 times the mean HR for the “soft” and “hard” spectra, respectively. These limits are shown by dashed lines in Figures 5 and 6. The times associated with the soft and hard states can be seen in the bottom of each lower panel of Figure 5. Times associated with enhanced solar-proton background were excluded from these categories.
Figure 7 shows the counts spectra accumulated in the soft and hard states, and the resulting fits. The best-fit parameters are shown in Table 6. A soft photon deficit is clearly seen in the hard state and in observations 2 and 3 it is accompanied by an increase of the flux of hard photons above 2 keV. In the framework of the 3-T model, it seems that most of the differences between the hard and the soft states are due to a change in the column density and/or to the luminosities of the cool and warm components. However, the temperatures of the cool and warm components are not statistically different in the hard and soft states and the direction of their evolution with state varies with the observation considered. The mean unabsorbed flux of the hottest temperature component is slightly ( 10–40 %) stronger in the hard states.
6.2 Search for coherent pulsations
We searched for coherent pulsations using the PowSpec/Xronos666http://heasarc.nasa.gov/docs/xanadu/xronos/xronos.html v5.21, Scargle/Midas (Scargle 1982), and Z (Buccheri et al. 1983) periodograms. The PowSpec and Scargle tools were applied on background-subtracted light curves. The Z and also PowSpec were applied directly on the pn event lists. In all cases, we adopt the 0.6–2 keV, 2–12 keV, and 0.6–12 keV energy bands, and times corrected to the solar barycentric system. The timing resolution of 200 ms is set by the pn extended full window mode, corresponding to a Nyquist frequency of 2.5 Hz.
| obs. 1 | obs. 2 | obs. 3 | ||||||
|---|---|---|---|---|---|---|---|---|
| S | H | S | H | S | H | |||
| NH (1022 cm-2) | 0.28 | 0.48 | 0.30 | 0.73 | 0.40 | 0.60 | ||
| T1 (keV) | 0.79 | 0.54 | 0.65 | 0.30 | 0.59 | 0.62 | ||
| (erg cm-2 s-1) | 7.310-13 | 2.210-12 | 7.110-13 | 1.110-11 | 9.810-13 | 1.610-12 | ||
| T2 (keV) | 4.39 | 5.34 | 2.97 | 2.52 | 3.59 | 5.96 | ||
| (erg cm-2 s-1) | 9.510-12 | 1.210-11 | 3.610-12 | 5.810-12 | 6.910-12 | 8.810-12 | ||
| (erg cm-2 s-1) | 3.410-11 | 3.710-11 | 2.810-11 | 3.910-11 | 3.010-11 | 3.610-11 | ||
| /d.o.f. | 1.07/88 | 0.98/78 | 1.05/98 | 0.92/72 | 0.99/96 | 1.15/91 | ||
-
Notes: is the unabsorbed 0.2–12 keV flux of the Ti component. The T3, abundances, and the central energy and dispersion of the Gaussian lines are those of M1 in Table 2. Quoted errors are at the 90% confidence level.
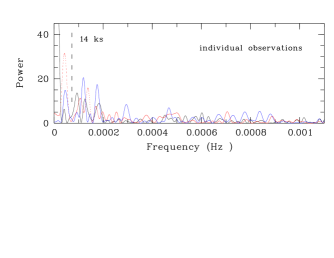
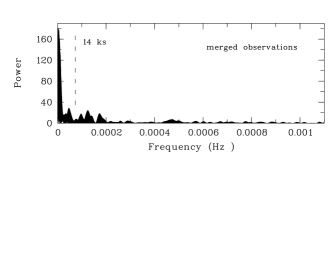
The Z tool fails to detect any significant coherent signal in the frequency range 0.005–2.5 Hz. The upper limit on the pulsed fraction is 2.5% (at 0.6–12 keV). Although quasi-periodic variability exists during each epoch on time scales of 300 s up to several ks, Figure 8 (top) shows that no peak is common to all XMM-Newton observations. Figure 8 (bottom) also shows the Scargle power spectrum of the three observations merged in a single time series. There is no strong coherent low frequency signal. In particular, we do not find any power at the 14 ks period found by Torrejón & Orr (2001) in the BeppoSAX data.
As visible on Figure 5, the hardness ratio exhibits long period oscillations with a pattern of variability apparently uncorrelated with that of the total flux. It is worth noting that the Scargle hardness ratio power spectra of obs. 1 and obs. 3 both show peak at 14 ks, not detected in obs. 2. But the reality of this 14 ks peak is doubtful given the absence of a similar feature in the power spectra of soft and hard light curves.
To check for recurrences in the emission of HD 110432, we have also calculated the autocorrelation function from light curves and their inversed fluxes – in order to emphasize the times of low flux (see Fig. 9), using the Autocor/Xronos v5.21. No pattern is evident.
6.3 Power density spectrum
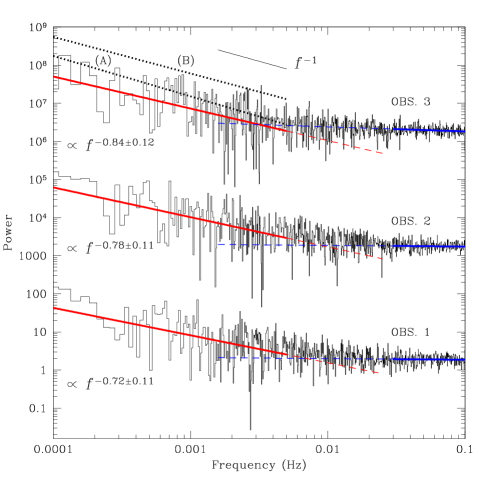
We plot in Fig. 10 the power spectra computed by PowSpec/Xronos v5.21 on the 0.6–12 keV events, accumulated in time bins of 5 s. The power steadily rises at low frequencies, similar to what is observed in $γ$ Cas (Smith et al. 1998a; Robinson & Smith 2000). At frequencies below 0.003 Hz, the spectra have the usual power law shape with an index of 0.72–0.84 up to a break at 0.01 Hz, where the white noise dominates. The power law index is significantly smaller than one – and mutually consistent for all observations at 1 (see values in Fig. 10, computed from 10-4 to 510-3 Hz). This indicates that the low frequency behaviour of HD 110432 might be somewhat different from that of $γ$ Cas. The difference could lie either in the frequency of intermediate-timescale ( few hours) flux “undulations” or in the relative numbers of strong and weak flares.
7 Discussion
7.1 HD 110432: a $γ$ Cas analog system
HD 110432 has X-ray and optical properties that are similar to those observed in $γ$ Cas. Contrary to “normal” O-B stars which are usually soft (T 0.5 keV; Berghöfer et al. 1996) and modest ( erg s-1; Berghöfer et al. 1997) X-ray sources, HD 110432 and $γ$ Cas emit preferentially hard X-rays at moderate luminosities. In addition to the classical soft emission normally observed in B stars, a warm ( 1–5 keV) component is needed to fit an otherwise dominant hard continuum in $γ$ Cas (T 12 keV; White et al. 1982; Murakami et al. 1986; Parmar et al. 1993; Horaguchi et al. 1994; Smith et al. 1998a; Kubo et al. 1998; Owens et al. 1999; Smith et al. 2004). Iron K lines (Fe xxv and Fe xxvi) as well as a fluorescent component at 6.4 keV are seen in emission. As for HD 110432, the light curve of $γ$ Cas displays strong variability on time scales ranging from the photon limit of the instrument to several minutes. These have the form of flare-like events (Murakami et al. 1986; Smith et al. 1998a; Robinson & Smith 2000). The intrinsic luminosity of the cool component of HD 110432 [ (5–10)1030 erg s-1, in 0.1–2.4 keV] is comparable to the shocked-wind emission displayed by “normal” B stars. On the other hand, the suspected variability by a factor of 5 in the unabsorbed soft-energy flux is in contrast with the X-ray variability in this energy regime in “normal” B stars.
The intensity and hardness variabilities, and the multi-temperature model needed to describe the X-ray emission of HD 110432, and $γ$ Cas (Smith et al. 2004), strongly suggest a complex X-ray environment. We did not find any evidence for coherent “pulsations” in HD 110432.
We have noted that HD 110432 and $γ$ Cas also display striking similarities in their optical spectra. The emission features in the yellow-red spectra confirm the information from the Balmer line emissions that the Be disks are extensive and probably dense. They also provide information on the thermodynamic description and the viewing aspect of the disk. The appearance of migrating subfeatures in the line profiles is similar to their appearance in the UV and optical spectrum of $γ$ Cas. In the latter case one can also state that this is consistent with the brief appearances of UV continuum absorptions that seem to be formed by transiting clouds forced into corotation around the Be star (Smith et al. 1998b) by a putative magnetic field and which are arguably anticorrelated with X-ray variations having several hour timescales (Smith et al. 1998a). As noted above, the 130 day modulation of the 2002 optical light may well be an analog of the now well-documented optical cycles of $γ$ Cas. These in turn correlate well with 3-amplitude X-ray cycles in $γ$ Cas (Robinson et al. 2002; Smith & Balona 2006).

For both HD 110432, and $γ$ Cas, the ISM column density is much less than columns derived from modeling the soft X-ray spectra, and therefore the most of the column density to the X-ray source is due to local absorptions.
7.2 Spectral changes
Our spectral and timing analysis reveal the complex behaviour of the X-ray emission of HD 110432 on short ( tens to thousand of seconds) as well as on long time scales ( months–year).
Strong and rapid variabilities are clearly observed in soft and hard light curves, even though apparently noncoherent, on time scales as short as 10 s. Such shots, exhibiting increases up to 100% in flux, are superimposed over a long-term ( 5–10 ks) trend of the X-ray emission, but their occurence and intensity do not depend upon whether the source is in a “low” or “high” state. This chaotic behaviour strongly suggests the existence of numerous non-cospatial X-ray active regions, resulting in shots through flare-like events. In this picture, the basal component would be due to an averaged emission of a collection of a large number of such active regions. Actually, the best fitting 3-T models show that several distinct emitting regions of different temperatures, emission measures and fluxes, and probably column densities contribute to the overall X-ray energy distribution on large time scales. The variability of these parameters in different putative sites seems so far uncorrelated.
According to M1, the X-ray emission of HD 110432 is dominated by a hot-thermal component, which accounts for 80% of the unabsorbed 0.2–12 keV flux. Its warm and cool components represent the other 18% and 2%. The unabsorbed X-ray flux of HD 110432 has steadily decreased over the two first XMM-Newton observations, increasing during the last observation. This trend was apparently accompanied by a slight hardening of the X-ray spectrum.
The EM of the hot component seems to decrease by 10% over the subsequent observations, while the EM of the cool and warm components follow a more complicated pattern, which is anti-correlated one with another. If the different plasmas have similar densities, our results show that the total emitting volume in all observations is dominated by the hot component ( 70–80%), with a small contribution of the warm ( 15–25%) and cool (few percent) components.
The EPIC energy band (0.2–12 keV) does not extend enough in the hard X-rays to really constrain the high temperatures ( 20 keV) derived for the hot emission of HD 110432. The fits yield large errors, and the temperatures in each epoch are the same within the 90% confidence limit. However, the varying relative intensity of the ionized iron lines (Fig. 4) suggest that the physical parameters of the X-ray environment has changed in the different epochs.
7.3 Origin of the X-ray emission
In spite of several X-ray campaigns on $γ$ Cas, the true nature of its X-ray emission remains an open question: accretion onto a degenerate companion or magnetic active Be star? This controversy itself extends to HD 110432 and all $γ$ Cas-analog systems.
7.3.1 Be/X-ray binary?
Accretion onto a degenerate companion star has been invoked to explain the anomalous, variable X-ray flux of $γ$ Cas, mainly due its hard emission and moderate luminosity – of about 1032-33 erg s-1 in 0.2–12 keV. This could be easily obtained if matter is falling directly onto a NS either from the Be star’s wind or its decretion disk ( 310-13 yr-1), or conceivably (though not easily) a WD ( 310-10 yr-1). Following the hard-thermal nature of its X-rays, typical of CVs and in contrast with the non-thermal emission detected in all well-known classic Be + NS systems, and despite the lower yield in luminosity, a WD is preferred instead of a NS.
Be + WD systems are predicted by several massive binary evolution models to be the outcomes describing the evolution of massive binary systems. This configuration is expected for all B types, with a distribution peaking around the B2–3 types (Pols et al. 1991). Typical models predict that these systems should comprise about 70% of the total evolved Be binary outcomes (van den Heuvel & Rappaport 1987; Waters et al. 1989; Pols et al. 1991; van Bever & Vanbeveren 1997; Raguzova 2001). However, we note that this fraction depends sensitively on the final mass of the B primary such that it is low for evolved systems with early B primaries. Thus, in these computations all known Be/X-ray binaries have a companion NS (see Raguzova & Popov 2005, for a recent compilation of Be/X-ray properties). So far no Be + WD system has been identified. On the basis of their X-ray properties, notably their (i) hard-thermal spectra, (ii) iron lines, and (iii) luminosities, that are reminiscent of similar properties in some CVs, the $γ$ Cas analogs are tenable Be + WD candidates. However, one difference we can point out is that the absence of a continuous differential emission measure and the variable energy distribution of HD 110432 discourage the expectation of a cooling flow model often associated with the boundary layer in CVs and therefore it is an argument against the presence of an accreting white dwarf. However, this argument may be made on a dearth of examples of high quality spectra for which a DEM can be absolutely ruled out instead of a multi-temperature component model. [But this by itself does not necessarily rule out a WD-accretion model.] Another possible example of a Be + WD system might be the super-soft X-ray source XMMU J052016.0–692505, associated to a B0-3e star in the LMC, as proposed by Kahabka et al. (2006). Its blackbody emission, with bolometric luminosity 1034 erg s-1, was interpreted as being due to a WD, accreting from a decretion disk of a Be star in a putative binary system.
In CV systems a WD, strongly magnetized or not, accretes from a Roche lobe-filling, late-type evolved companion star. An accretion disk is commonly formed in non-magnetic systems. However, it tends to be inhibited by the magnetic field lines in strongly magnetized ( 1010 G) stars. In both types of systems accretion shocks onto the WD or the boundary layer between the WD’s surface and a putative disk will result in a X-ray spectrum characterized by plasma temperatures ranging from a few keV to tens of keV. Their luminosities are moderately high ( 1032-33 erg s-1). Interestingly, their X-rays are typically modeled as emissions of plasmas having at least a few components and indeed perhaps a broad continuous temperature distribution. The latter possibility is typical of a cooling process, e.g. in which the emission measure of each temperature component scales with the temperature as EM/T Tα.
The prominent ionized iron lines, Fe xxv and Fe xxvi, and the fluorescent 6.4 keV iron feature, present in HD 110432 and in all $γ$ Cas analogs so far are also reminiscent of those detected in several CV systems, with similar EWs and intensities (Hellier et al. 1998; Ezuka & Ishida 1999). Curiously, Ezuka & Ishida (1999) noted that the ionization temperature derived from Fe K lines in CVs are systematically lower than that derived from continuum, as we found for HD 110432 (Section 5.3).
In fact, $γ$ Cas, the prototype of this class, itself is a component of a binary system (Harmanec et al. 2000; Miroshnichenko et al. 2002). The companion star has roughly 1 , but its nature, degenerate or otherwise, is unknown. In the case of of $γ$ Cas itself, its high mass of about 15 M⊙ (e.g. Stee et al. 1995; Harmanec et al. 2000) places constraints on binary evolution scenarios ending up with a massive Be star with a WD companion. However, these constraints are less important if the mass of HD 110432 is only 9.6 M⊙ (Zorec et al. 2005).
The binary status of HD 110432 and all other $γ$ Cas-analog candidates is unknown. If HD 110432 actually belongs to the 60 Myr old open cluster NGC 4609 (Feinstein & Marraco 1971), then the largest age for a 9.6 B1IVe star of 20 Myr would suggest that HD 110432 is a blue straggler. Interestingly, two other $γ$ Cas candidates, the star in NGC 6649 (Marco et al. 2006) and HD 119682 (Safi-Harb et al. 2007) also appear to be blue stragglers. Therefore, an evolved status may be a prerequisite to the source being a peculiar X-ray emitter. An advanced age could hint at a few scenarios for the X-ray production, such as an accreting binary companion, or a Be star with a strong surface field resulting from the buoyant rise of flux through the star’s radiative interior (e.g. MacGregor & Cassinelli 2003).
It is also not yet clear that a WD in a Be binary system as widely spaced as $γ$ Cas could accrete enough material from the wind to account for the observed X-ray luminosity. In particular, the tidal torquing of the Be disk by the secondary star may effectively truncate the disk inside the secondary’s orbital radius (Okazaki & Negueruela 2001), which would result in too little mass accretion to be important. Interestingly, there is no detected correlation between X-ray flux and the orbital phase of $γ$ Cas (RXTE observations; Robinson et al. 2002), or outburst. This could be explained if the accreting star were in a nearly circular orbit close to the plane of the Be decretion disk.
For completeness, we point out that the $γ$ Cas-like systems HD 161103 and HD 119682 exhibit 3.2 ks (XMM-Newton; Lopes de Oliveira et al. 2006) and 1.5 ks (XMM-Newton and Chandra; Safi-Harb et al. 2007) oscillations, respectively. If these should turn out to be stable, they could be the signature of a spinning compact object.
7.3.2 Magnetic active Be star?
Evidence is accumulating in favor of magnetic activities in $γ$ Cas and HD 110432, that could produce the X-ray emission in these objects. The fundamental question of whether these stars are magnetic with a complex but stable field topology seems less hypothetical with the discovery of a coherent variation over 9 years with a photometric period of 1.21 days in the optical passbands (Smith & Balona 2006). This periodicity appears to be best explained by a feature on the star’s surface, since 1.2 days is consistent with the star’s expected radius, rotational velocity, and obliquity. Perhaps also relevant are the recurrent blue-to-red “migrating sub-structures” (msf) seen in the line optical profiles of both stars often (Yang et al. 1988; Smith & Robinson 1999; Smith & Balona 2006). These features are reminiscent of the active and rapidly rotating pre-main sequence K star AB Dor (Collier Cameron & Robinson 1989). The msf are most easily interpreted as being due to corotating clouds anchored onto the stellar surface by magnetic confinement (Smith et al. 1998b). In addition, the 3–4% sinusoidal modulations in the and photometric bands with a timescale of 130 days detected in HD 110432 (Smith & Balona 2006) are reminiscent of the optical cycles reported in $γ$ Cas, which are best explained by variations in the integrated flux of the Be disk (Smith et al. 1998b, 2006).
The key assumption of the scenario in which X-rays are due to magnetic activity is that the Be star has a surface magnetic field some fraction of which threads into the inner regions of its ionized circumstellar disk (Robinson et al. 2002, and references therein). According to the hypothesis of Robinson et al. (2002), field entrainment produces turbulence within the disk and the difference in angular velocities between the disk and the star stresses and shears magnetic lines. Magnetic reconnection leads to the ejection of high energy particles which impact the Be star and generate hard X-ray emission. This scenario is supported by UV observation of highly redshifted line absorptions in HD 110432 that could be manifestations of accelerated material (Smith & Robinson 1999). In this context, Cas analogs may be related to magnetic Op and Bp stars like Ori C (Donati et al. 2002). [However, we note that the hottest X-ray plasma of Ori C has a temperature T of only 2.5 keV (Gagné et al. 2005) or 4.5 keV (Schulz et al. 2000)]. As part of a star-disc interaction, X-rays could be modulated by a dynamo-like process within the Be’s circumstellar disk (Robinson et al. 2002). A dense circumstellar disk in $γ$ Cas analogs seems to be a necessary ingredient for the magnetic picture.
It is not yet clear how observations might eventually provide quantitative constraints on the star-disc magnetic picture. Similarly, the theory is not yet developed enough to predict a characteristic temperature or to explain the presence of plasma with more than one temperature. According to the X-ray variabilities detected in $γ$ Cas analogs, the surface of these stars would have to have a complicated magnetic topology. In any case, the 1/ tendency roughly observed in the periodogram at low frequencies is in agreement with stochastically appearing blobs. Indeed, at this point dynamo models also cannot make sensible predictions for any astrophysical environment (including the solar interior).
8 Conclusions
HD 110432 is a member of the recently discovered class of $γ$ Cas-analogs (Motch et al. 2006; Lopes de Oliveira et al. 2006), according to its X-ray and optical properties, summarized as follows. This class is composed of Be stars having X-ray properties described by moderately luminous and variable light curves ( 1032-33 erg s-1; 0.2–12 keV) and spectra indicative of multiple thermal components dominated by a hard component (T 7 keV; current limit determined by HD 161103; Lopes de Oliveira et al. 2006). No X-ray outbursts have been observed. The thermal origin of their X-ray emissions is strongly supported by the presence of an Fe K complex. The presence of a fluorescent iron line at 6,4 keV suggests a dense-cold medium close and in the line-of-sight of the X-ray source, or fluorescence over the surface of a accreting WD companion. Curiously, all identified members are B0.5-B1 stars with very large and nearly symmetrical H profile, and Fe ii emission lines, supporting dense and/or large and likely stable circumstellar disks. In toto, these features are not exhibited in optical and X-ray spectra and light curves of “normal” Be stars or known Be/X-ray binaries.
The X-ray spectrum of HD 110432 is very complex and variable. It probably results from a composition of three thermal plasmas (T 0.2–0.7 + 3–6 + 16–37 keV), and thus HD 110432’s X-ray temperature is the hottest known for any Be star. A mixed model of thermal and non-thermal components, resulting in a dominant plasma of T 8–11 keV and a power law description for the high energy tail in HD 110432 is statistically acceptable. However, it appears a less realistic interpretation because of the presence of the Fe xxvi Ly line. Future X-ray observations carried out by Suzaku observatory, covering simultaneously from 0.2 to 70 keV with the moderate resolution available by the XIS and HXD cameras, would be useful to put additional constraints on the nature of the hard energy tail in HD 110432. We would emphasize that the increase of the sample size makes it more likely that one of these stars will be able to undergo an optical Be outburst cycle. A monitoring of X-ray characteristics during these cycles would greatly clarify the role of the Be disk in the production of these unique (for Be stars) hard X-rays.
In addition to the iron lines detected in $γ$ Cas-analogs, a variable Fe xxvi Ly emission line at 8.2 keV is detected for HD 110432, in agreement with its hot and variable X-ray component. Notably, its light curve exhibits rapid and strong variations, in soft and hard X-ray bands throughout the 0.2–12 keV range. These variations are followed by long term variations and (as for $γ$ Cas) ubiquitous flare-like events in the source’s hardness which recur on timescales as short as detectable with current X-ray instrumentation. There is no evidence for high-frequency pulsations, but our low-frequency analysis reveals unstable long-term variations on timescales of a few hours.
Our X-ray spectral analysis is consistent with the presence of an accreting white dwarf for HD 110432, on the basis of certain spectral similarities with CVs. Similarly, the X-ray and optical characteristics of HD 110432 are consistent with the magnetic star-disk interaction scenario, proposed for $γ$ Cas by Robinson et al. (2002) and references. The presence or absence of a companion star to HD 110432 and if appropriate the description of its orbit, or additional indications of magnetic fields will provide the means to make substantial progress in elucidating the processes behind its X-ray emission.
Acknowledgements.
We are grateful to the anonymous referee for his/her valuable comments. R.L.O. acknowledges financial support from Brazilian agencies FAPESP (grant 03/06861-6) and CAPES (grant BEX0784/04-4), and the Observatoire de Strasbourg (CNRS). I.N. is a researcher of the programme Ramón y Cajal, funded by the Spanish Ministerio de Ciencia y Tecnología (currently Ministerio de Educación y Ciencia) and the University of Alicante, with partial support from the Generalitat Valenciana and the European Regional Development Fund (ERDF/FEDER). This research is partially supported by the MCyT (currently MEC) under grant AYA2005-00095.References
- Ballereau et al. (1995) Ballereau, D., Chauville, J., & Zorec, J. 1995, A&AS, 111, 423
- Barrera et al. (1991) Barrera, L.H., Mennickent, R.E., & Vogt, N. 1991, AAS, 185, 79
- Berghöfer et al. (1996) Berghöfer, T.W., Schmitt, J.H.M.M., & Cassinelli, J.P. 1996, A&AS, 118, 481
- Berghöfer et al. (1997) Berghöfer, T.W., Schmitt, J.H.M.M., Danner, R., & Cassinelli, J.P. 1997, A&A, 322, 167
- Bohlin (1970) Bohlin, R.C. 1970, ApJ, 162, 571
- Buccheri et al. (1983) Buccheri, R., Bennett, K., Bignami, G.F., et al. 1983, A&A, 128, 245
- Codina et al. (1984) Codina, S.J., de Freitas Pacheco, J.A., Lopes, D.F., & Gilra, D. 1984, A&AS, 57, 239
- Collier Cameron & Robinson (1989) Collier Cameron, A., & Robinson, R.D. 1989, MNRAS, 236, 57
- Cranmer et al. (2001) Cranmer, S.R., Smith, M.A., & Robinson, R.D. 2000, ApJ, 533, 433
- Dachs et al. (1986) Dachs, J., Hanuschik, R., Kaiser, D., et al. 1986, A&AS, 63, 87
- Donati et al. (2002) Donati, J.-F., Babel, J., Harries, T.J., Howarth, I.D., Petit, P., & Semel, M. 2002, MNRAS, 333, 55
- Draper et al. (2000) Draper P.W., Taylor, M., & Allan 2000, Starlink Users Note 139.12, R.A.L.
- Ezuka & Ishida (1999) Ezuka, H., & Ishida, M. 1999, ApJSS, 120, 277
- Feinstein & Marraco (1971) Feinstein, A., & Marraco, H.G. 1971, PASP, 83, 218
- Frémat et al. (2005) Frémat, Y., Zorec, J., Hubert, A.-M., & Floquet, M. 2005, A&A, 440, 305
- Frontera et al. (1987) Frontera, F., Dal Fiumi D., Robba, N.R., et al. 1987, ApJ, 320, L127
- Gagné et al. (2005) Gagné, M., Oksala, M.E., Cohen, D.H., et al. 2005, ApJ, 628, 986
- Groh et al. (2007) Groh, J.H., Damineli, A., & Jablonski, F. 2007, A&A, 465, 993
- Haberl (1995) Haberl, F. 1995, A&A, 296, 685
- Harmanec et al. (2000) Harmanec, P., Habuda, P., Stefl, S., et al. 2000, A&A, 364, L85
- Hellier et al. (1998) Hellier, C., Mukai, K., & Osborne, J.P. 1998, MNRAS, 297, 526
- Horaguchi et al. (1994) Horaguchi, T., Kogure, T., Hirata, R., et al. 1994, PASJ, 46, 9
- Kahabka et al. (2006) Kahabka, P., Haberl, F., Payne, J.L., & Filipović, M.D. 2006, A&A, 458, 285
- Kharchenko et al. (2005) Kharchenko, N.V., Piskunov, A.E., Röser, S., Schilbach, E., & Scholz, R.-D. 2005, A&A, 438, 1163
- Kilkenny et al. (1985) Kilkenny, D., Whittet, D.C.B., Davies, J.K., et al. 1985, SAAOC, 9, 55
- Kubo et al. (1998) Kubo, S., Murakami, T., Ishida, M., & Corbet, R.H.D. 1998, PASJ, 50, 417
- Lopes de Oliveira et al. (2006) Lopes de Oliveira, R., Motch, C., Haberl, F., Negueruela, I., & Janot-Pacheco, E. 2006, A&A, 454, 265
- MacGregor & Cassinelli (2003) MacGregor, K.B., & Cassinelli, J.P. 2003, ApJ, 586, 480
- Marco et al. (2006) Marco, A., Negueruela, I., & Motch, C. 2006, in Moffat, A.F.J., & St.-Louis, N. (eds.), Proceedings of Massive Stars in Interacting Binaries, Hotel Sacacomie, Montreal, Quebec, Canada, August 2004, ASP Conference Series, in press
- Miroshnichenko et al. (2002) Miroshnichenko, A.S., Bjorkman, K.S., & Krugov, V.D. 2002, PASP, 114, 1226
- Motch et al. (1997) Motch, C., Haberl, F., Dennerl, K., Pakull, M., & Janot-Pacheco, E. 1997, A&A, 323, 853
- Motch et al. (2006) Motch, C., Lopes de Oliveira, R., Negueruela, I., Haberl, I., & Janot-Pacheco 2006, in Active OB Stars: Laboratories for Stellar & Circumstellar Physics”, ed. S. Stefl, S. P. Owocki, & A. Okazaki, ASP Conf. Ser., in press [astro-ph 0512556]
- Murakami et al. (1986) Murakami, T., Koyama, K., Inoue, H., & Agrawal, P.C. 1986, ApJ, 310, 31
- Okazaki (1991) Okazaki, A.T. 1991, PASJ, 43, 75
- Okazaki & Negueruela (2001) Okazaki, A.T., & Negueruela, I. 2001, A&A, 377, 161
- Owens et al. (1999) Owens, A., Oosterbrock, T., Parmar, A.N., et al. 1999, A&A, 348, 170
- Perryman (1997) Perryman, M.A.C. 1997, The Hipparcos and Tycho Catalogues, ESA SP-1200 (Noordwijk: ESA)
- Parmar et al. (1993) Parmar, A.N., Israel, G.I., Stella, L., & White, N.E. 1993, A&A, 275, 227
- Pols et al. (1991) Pols, O.R., Coté, J., Waters, L.B.F.M., & Heise, J. 1991, A&A, 241, 419
- Rachford et al. (2001) Rachford, B.L., Snow, T.P., Tumlinson, J., et al. 2001, ApJ, 555, 839
- Raguzova (2001) Raguzova, N.V. 2001, A&A, 367, 848
- Raguzova & Popov (2005) Raguzova, N.V., & Popov, S.B. 2005, A&AT, 24, 151 [astro-ph 0505275]
- Rakowski et al. (2006) Rakowski, C.E., Schulz, N.S., Wolk, S.J., & Testa, P. 2006, ApJ, 649, L111
- Robinson & Smith (2000) Robinson, R.D., & Smith, M.A. 2000, ApJ, 540, 474
- Robinson et al. (2002) Robinson, R.D., Smith, M.A., & Henry, G.W. 2002, ApJ, 575, 435
- Safi-Harb et al. (2007) Safi-Harb, S., Ribo, M., Butt, Y., et al. 2007, ApJ, 659, 407
- Scargle (1982) Scargle, J.D. 1982, ApJ, 263, 835
- Shortridge et al. (1997) Shortridge K., Meyerdicks, H., Currie, M., et al. 1997, Starlink User Note 86, 15, R.A.L.
- Schulz et al. (2000) Schulz, N.S., Canizares, C.R., Huenemoerder, D., & Lee, J.C. 2000, ApJ, 545, 135
- Slettebak (1982) Slettebak, A. 1982, ApJS, 50, 55
- Slettebak et al. (1992) Slettebak, A., Collins, G.W., & Truax, R. 1992, ApJS, 81, 335
- Smith (1995) Smith, M.A. 1995, ApJ, 442, 812
- Smith et al. (1998a) Smith, M.A., Robinson, R.D., & Corbet, R.H.D. 1998a, ApJ, 503, 877
- Smith et al. (1998b) Smith, M.A., Robinson, R.D., & Hatzes, A.P. 1998b, ApJ, 507, 945
- Smith & Robinson (1999) Smith, M.A., & Robinson, R.D. 1999, ApJ, 517, 866
- Smith et al. (2001) Smith, R.K., Brickhouse, N.S., Liedahl, D.A., & Raymond, J.C. 2001, ApJ, 556, L91
- Smith et al. (2004) Smith, M.A., Cohen, D.H., Gu, M.F., et al. 2004, ApJ, 600, 972
- Smith & Balona (2006) Smith, M.A., & Balona, L. 2006, ApJ, 640, 491
- Smith et al. (2006) Smith, M.A., Henry, G.W., & Vishniac, E. 2006, ApJ, 647, 1375
- Stee et al. (1995) Stee, P., de Araújo, F.X., Vakili, F., et al. 1995, A&A, 300, 219
- Torrejón & Orr (2001) Torrejón, J.M., & Orr, A. 2001, A&A, 377, 148
- Tuohy et al. (1988) Tuohy, I.R., Buckley, D.A.H., Remillard, R.A., et al. 1988, in Physics of Neutron Stars & Black Holes (Universal Academy Press, Tokyo), 93
- van Bever & Vanbeveren (1997) van Bever, J., & Vanbeveren, D. 1997, A&A, 322, 116
- van den Heuvel & Rappaport (1987) van den Heuvel, E.P.J., & Rappaport, S.A. 1987, in Physics of Be Stars, IAU Coll. 92, Ed. A. Slettebak & T. P. Snow (Cambridge University Press), 291
- Waters et al. (1989) Waters, L.B.F.M., Pols, O.R., Hogeveen, S.J., Coté, J., & van den Heuvel, E.P.J. 1989, A&A, 220, L1
- White et al. (1982) White, N.E., Swank, J.H., Holt, S.S., & Parmar, A.N. 1982, ApJ, 263, 277
- Yang et al. (1988) Yang, S., Ninkov, Z., & Walker, G.A. 1988, PASP, 100, 233
- Zorec et al. (2005) Zorec, J., Frémat, Y., & Cidale, L. 2005, A&A, 441, 235