Lyman-break galaxies at z5 - I. First significant stellar mass assembly in galaxies that are not simply z3 LBGs at higher redshift
Abstract
We determine the ensemble properties of z5 Lyman break galaxies (LBGs) selected as V-band dropouts to 26.3 in the Chandra Deep Field South using their rest-frame UV-to-visible spectral energy distributions. By matching the selection and performing the same analysis that has been used for z3 samples, we show clear differences in the ensemble properties of two samples of LBGs which are separated by 1 in lookback time. We find that z5 LBGs are typically much younger (100) and have lower stellar masses (109) than their z3 counterparts (which are typically few1010 and 320 old). The difference in mass is significant even when considering the presence of an older, underlying population in both samples. Such young and moderately massive systems dominate the luminous z5 LBG population ( 70 per cent), whereas they comprise 30 per cent of LBG samples at z3. This result, which we demonstrate is robust under all reasonable modelling assumptions, shows a clear change in the properties of the luminous LBGs between z5 and z3. These young and moderately massive z5 LBGs appear to be experiencing their first (few) generations of large-scale star formation and are accumulating their first significant stellar mass. Their dominance in luminous LBG samples suggests that z5 witnesses a period of wide-spread, recent galaxy formation. As such, z5 LBGs are the likely progenitors of the spheroidal components of present-day massive galaxies. This is supported by their high stellar mass surface densities, and is consistent with their core phase-space densities, as well as the ages of stars in the bulge of our Galaxy and other massive systems. With implied formation redshifts of z6 - 7, these luminous z5 LBGs could have only contributed to the UV photon budget at the end of reionisation. However, their high star formation rates per unit area suggest these systems host outflows or winds that enrich the intra- and inter-galactic media with metals, as has been established for z3 LBGs. Their estimated young ages are consistent with inefficient metal-mixing on galaxy-wide scales. Therefore these galaxies may contain a significant fraction of metal-free stars as has been previously proposed for z3 LBGs (Jimenez & Haiman 2006).
keywords:
galaxies: formation - galaxies: evolution - galaxies: high-redshift - galaxies: starburst1 Introduction
One of the fundamental open questions in cosmology is when did galaxies form their first generations of stars? Identifying and studying such galaxies are key steps towards understanding the physical processes that drive galaxy formation. Probing the formation and early growth of systems similar to the Milky Way requires observations of galaxies when the Universe is still young. Specifically, theoretical calculations (Mo & White 2002) predict that the most rapid growth of galaxies with masses comparable to that of the Milky Way occurs at redshifts of approximately z5. This is not long after the end of the (complex) reionisation process, which recent three-year WMAP results indicate was underway at z11 (Alvarez et al. 2006) and was largely complete by redshifts z6-6.5 (Fan et al. 2001; Becker et al. 2001; Malhotra & Rhoads 2004; Fan et al. 2005). Estimates of the ionising photon density in the early Universe suggests that the UV emission from currently known high redshift galaxies, whether star-formation or AGN dominated, is insufficient to have caused reionisation. However, these galaxies must have had an impact on the intergalactic medium at high redshift. Only through comprehensive studies of the physical properties (including masses, star formation rates and histories, and clustering strength) of galaxies that were in place at this epoch, can we accurately assess their contribution to the mass growth of galaxies like our own, and their effect on the gaseous intergalactic medium (IGM) at the end of reionisation.
As part of an ongoing study of high redshift galaxies, we have investigated the rest-frame UV-optical properties of candidate LBGs at 4.6 z 6 selected as V-dropouts using the now standard Lyman-break technique (Steidel & Hamilton 1993; Steidel et al. 1995, 1999). Through spectroscopic confirmation, we have successfully demonstrated the efficacy of this technique for unambiguously identifying z5 galaxies from deep imaging surveys in the rest-frame UV using 8m-class telescopes (Lehnert & Bremer 2003). From these data it has been possible to determine the comoving density (Bunker et al. 2004), the likely contribution to the end of reionisation (Lehnert & Bremer 2003), and the fraction of sources which host super-massive black holes (Bremer et al. 2004) of z5 LBGs. However, the rest-frame UV data alone are thus far insufficient to accurately constrain the ages, dust content, star formation rates and masses of the LBG population at high redshift.
Rather, accurately constraining these parameters relies on well measured rest-frame UV-to-optical SEDs. At z5, the rest-frame UV emission from ongoing star-formation is redshifted into the observed visible, while emission in the rest-frame visible to near-infrared from older stars, diagnostic of longer or earlier periods of star formation, shifts into the mid-infrared. Several fields now have excellent multi-wavelength data sets from both the Hubble and Spitzer Space Telescopes (HST and Spitzer, respectively), supplemented by ground-based data sets, forming an ideal basis for selecting and studying samples of distant galaxies across the full rest-frame UV to visible wavelength range.
The most detailed multiwavelength studies to date of 5 z 7 LBGs have been centered upon a small fraction of dropouts that benefit from amplification due to lensing and/or those detected with Spitzer-IRAC (Egami et al. 2005; Schaerer & Pelló 2005; Yan et al. 2005; Mobasher et al. 2005; Chary et al. 2005; Eyles et al. 2005; Dow-Hygelund et al. 2005; Yan et al. 2006a). Since, at z 5, the Balmer-break lies between the and the IRAC pass-bands, the IRAC data are highly effective in constraining the ages of these systems. A strong detection with IRAC normally confirms the presence of a Balmer break or an intrinsically more UV luminous system. The derived properties of these high redshift LBGs are fascinating; massive (few-several 1010) and strongly star forming systems with ages comparable to the age of the Universe at that epoch. The presence of such massive and evolved systems at high redshift, in place less than a billion years after the Big Bang, challenges the expectations from bottom-up hierarchical structure formation scenarios (however, also see McLure et al. 2006).
These derived masses and ages of z 5 LBGs are similar to the average properties of LBGs at redshift 3. Following the pioneering work of Steidel et al., the last decade has seen intensive observational and theoretical studies on the properties of LBGs at z3, providing a wealth of information about this abundant population of UV-bright galaxies at this epoch. These star-formation dominated systems are seen to host strong outflows (Pettini et al. 2001; Adelberger et al. 2003; Shapley et al. 2003), typically have sub-solar-to-solar metallicities (0.3 - 1 Z⊙; Pettini et al. 2001; Shapley et al. 2003) and possibly contain a significant component of metal-free (population III) stars (Jimenez & Haiman 2006). LBGs are shown to be highly clustered on both large and small scales, the latter being indicative of common halo objects (Giavalisco et al. 1998; Adelberger et al. 1998; Ouchi et al. 2004b, 2005; Lee et al. 2006). Recent follow-up of z3 LBGs with Spitzer has revealed a division in the population between LBGs with significant dust-attenuated star-forming regions as well as the UV-emitting ones (Huang et al. 2005). This division is also seen for LBGs at z1 (Burgarella et al. 2006) with 40 per cent being infrared bright. Recently Reddy et al. (2005) have reported on the potential relation between UV- and IR selected populations. Huang et al. (2005) suggest IR-luminous LBGs are the missing link between LBGs and sub-mm galaxies and are the progenitors of present-day giant ellipticals (see also Adelberger & Steidel 2000; Shu et al. 2001; Ouchi et al. 2004b; Rigopoulou et al. 2006).
But how do these properties compare to those samples of LBGs at higher redshifts? Do we see an evolution in the properties of similar LBGs at these two epochs? Because of the small number of sources investigated, and the inhomogeneity of the selection criteria used, it has not yet been possible to consistently compare the derived properties of z 5 LBGs directly with those of Lyman-break galaxies at z3. In a preliminary study, Ando et al. (2004) find that unlike z3 LBGs (Shapley et al. 2003) the majority of luminous z5 - 6 LBGs have weak or absent Lyman alpha (Ly) emission and strong low-ionisation absorption lines, already indicating key differences between the populations at redshift 5 and redshift 3. We complement this comparison by analysing the properties of a large and reliable sample of the most luminous LBGs (LL*) at z5 which match the luminosity to which LBGs at redshift 3 have been spectroscopically confirmed. This matched selection permits a direct comparison between the properties of similarly luminous LBGs in place in a 1.2 old Universe and those at redshift 3, 1 later. This difference is longer than the typical duration of the UV luminous phase of a z3 LBG, thus we are not comparing the same galaxies, but galaxies at two epochs with similar UV-emission characteristics.
To address these issues, we present the results from an analysis of the properties of a sample of luminous V-band dropouts selected from the multiwavelength datasets of the Chandra Deep Field South (CDFS, Giacconi et al. 2001). This field was chosen as the southern field of the Great Observatories Origins Deep Survey (GOODS, Dickinson et al. 2003a), for which public imaging data are available over ten bands covering the optical (HST-ACS), near-infrared (VLT-ISAAC) and mid-infrared (Spitzer-IRAC) wavelength ranges. In section 2 we describe our methodology and selection criteria that define this robust sample of z5 LBGs. The stellar evolutionary modelling is discussed in section 3. The resultant physical properties of mass, ages, star formation rate and extinction of the galaxies in this sample are detailed in Section 4111We explore how different assumptions in the modelling process affects the results of our analysis in Appendix A and the potential contribution from an underlying old population in Appendix B. and the comparison to the properties of z3 galaxies is presented in Section 5. Unlike similarly luminous z3 LBGs, and other z5 LBG samples, we find our sample to be dominated by young (100) and moderately massive () galaxies. We discuss the implications of our findings in Section 6.
We adopt the following flat cosmology throughout this paper: =70kms-1Mpc-1, =0.3, =0.7. All magnitudes are based on the AB magnitude system (Oke & Gunn 1983).
2 Data and Sample Selection
2.1 Selection Criteria
We applied a Lyman-break colour selection to the publicly available HST/Advanced Camera for Surveys (ACS) imaging datasets of the CDFS obtained through the filters F435W (B), F606W (V), F775W (i) and F850LP (z) (Giavalisco et al. 2004b). Specifically, we selected objects with - mag which were not detected (signal-to-noise ratio 3) in the F435W (-band) image (i.e. short-ward of the 912Å Lyman-break at z5) ensuring that we only selected sources with a clear Lyman discontinuity in their emission. We then required that the objects were reliably detected (signal-to-noise ratio 5 in the -band) in order to accurately measure the sizes of the UV emitting regions. Furthermore, as mentioned above, we matched our sample to the magnitude limit to which LBGs at z3 have been spectroscopically confirmed. This limit of 25.5 probes z3 LBGs brighter than L*z=3 (Steidel et al. 2003). At redshift z5 25.5 corresponds to 26.3 mag, the magnitude to which we select our sample of z5 LBGs. This colour selection is similar to those previously used to select -band dropouts (or the analogous -band dropouts in Lehnert & Bremer 2003, but see also Vanzella et al. 2006; Stark et al. 2006 for a discussion of alternative colour cuts), which have been successfully spectroscopically confirmed to lie at z5 (Giavalisco et al. 2004a; Yan et al. 2005; Vanzella et al. 2006).
2.2 Input data
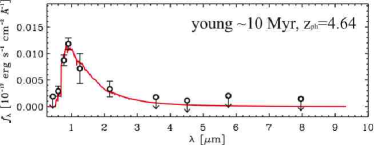
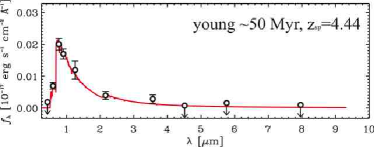
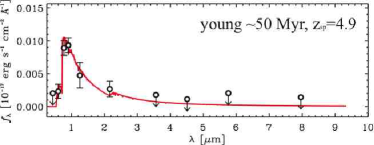
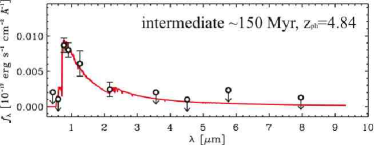
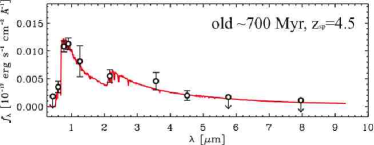
For each object we combined the ACS data with publicly available near- and mid-infrared datasets to construct multi-wavelength SEDs covering 0.45 to 8m (Figure 1). The ground-based - and -band data were taken with ISAAC at the Very Large Telescope (VLT) (Olsen et al. 2006, and http://www.eso.org/science/goods/imaging/products.html), and the mid-infrared data with Spitzer/IRAC at 3.6, 4.5, 5.6 and 8.0m (Dickinson et al., in prep. and http://data.spitzer.caltech.edu/popular/goods/, see also brief descriptions in Yan et al. 2004 and Stark et al. 2006).
While we used the publicly-available reduced images for the ACS and ISAAC data, we performed post-pipeline processing on the GOODS-S/Spitzer data (from epochs 1 and 2) creating deep 1′ 1′ mosaics centered on each high redshift candidate using the Spitzer/MOPEX package. The resultant drizzled mosaics have had instrumental effects and cosmic ray events removed. The mosaics were registered to the ACS astrometric reference frame using common detections to an accuracy of 0.1”. We verified our IRAC mosaic generation and photometric calibration by performing the same procedure to extract photometry for A and F stars identified in the field (Groenewegen et al. 2002). Such stars rarely show an infrared excess or have strong absorption features in the mid-infrared, thereby enabling accurate predictions of their mid-infrared emission. The fluxes predicted by black-body fits to the templates of their spectral types were reproduced to within 0.1, 0.1, 0.2 and 0.3 mag of our aperture photometry at 3.6, 4.5, 5.8 and 8m, respectively, consistent with our adopted accuracies (see later for a description of our adopted photometric uncertainties). Additionally, we confirmed that our measured fluxes were consistent with those measured for our LBG candidates and the stars from the epoch 1 and 2 GOODS Enhanced Legacy products (Dickinson et al., in prep. and http://data.spitzer.caltech.edu/popular/goods/).
The deep GOODS/IRAC data have the largest spatial pixels and PSFs amongst our datasets and, as a result, in crowded regions the emission profile from a given source can overlap with those of adjacent sources. For those sources selected according to the above criteria, but blended with neighbours in the Spitzer data, we treated the mid-infrared IRAC fluxes as upper limits in the subsequent SED analysis.
 |
 |
 |
 |
 |
 |
For each source that satisfied our Lyman break criteria, we built a 10-band SED with fixed diameter aperture photometry performed on each image (see Figure 1). Apertures, appropriate for the characteristics of each image, were determined based on enclosing as large a fraction of the source flux as possible while minimising the impact of the sky background noise and flux contributions from neighbouring sources. We used apertures with diameters of , , and for the measurements on the ACS, ISAAC, and IRAC images, respectively. Small aperture correction factors were applied to account for the fraction of the total flux not enclosed by our fixed-diameter apertures: 1.07 for the four ACS bands, 1.10 for the two ISAAC bands, 1.18 for the IRAC 3.6 and bands, and 1.35 and 1.47 for the 5.8 and bands. We determined the aperture corrections based on the point spread function (PSF) of each mosaic, constructed from isolated, bright but unsaturated stars throughout the CDF-S and taking reference total apertures of diameters for the optical and near-infrared data, and for the mid-infrared data.
The formal uncertainty assigned to each photometric data point was derived from measuring the background fluctuations in the parent image using 103-104 synthetic apertures with fixed diameters laid down at random on regions that are empty of flux from discrete sources (e.g. Förster Schreiber et al. 2006a), thereby accurately characterising the photometric uncertainty directly from the data, rather than calculating it from the pixel-to-pixel rms assuming uncorrelated Gaussian noise statistics. The simulations were performed for a range of aperture diameters. As a function of linear aperture size , the empirically derived relationship shows that the photometric uncertainties lie above and grow faster with size than the dependence for pure Gaussian noise. However, for a given aperture size, the histogram of background fluxes is very well described by a Gaussian distribution (of which the dispersion is taken as the uncertainty for photometric measurements in the given aperture size). A conservative absolute calibration uncertainty of ten per cent was additionally included in the final adopted uncertainty to comfortably account for the relative uncertainties in photometric calibration across the ten bands. In our SED modelling, this additional uncertainty prevents the fits being driven by a few photometric points with very small errors. We note that adopting a less conservative value for this uncertainty would mainly act to reduce the range of acceptable older ages, which is most influenced by the IRAC photometry, and therefore would not alter our findings of young ages for the majority of our sources.
2.3 Defining a robust sample of z5 Lyman-break galaxies
Our initial rest-frame UV selection yielded a sample of 109 z5 LBG candidates. This sample will include a fraction of spurious sources that are not LBGs (low redshift galaxies, quasars and stars) and also some sources with insufficient photometric constraints (regardless of their nature) to reliably determine their properties. We have therefore culled the inital sample as follows.
Assisted by SEDs extending to the observed-frame mid-infrared, we have reliably excluded 22 candidates from our sample which are low redshift galaxies (or interlopers). Synthesis modelling of the colour evolution of stellar populations predicts that galaxies with z4 can also satisfy our UV selection criteria. These galaxies have intrinsically redder near and mid-infrared SEDs than true high redshift Lyman break galaxies. The SED of an example interloper is shown in panel (vii) of Fig. 1 and is easily distinguished from the SEDs of high redshift LBGs (panel ii-vi). Furthermore, Figure 1 demonstrates how the addition of the IRAC data has greatly enhanced our ability to screen for such low redshift galaxies which are generally the brightest sources in the IRAC wavelengths that satisfy our optical selection criteria. These interlopers mostly satisfy the criterion for being extremely red objects (ERO, 2.48, Roche et al. 2003) and IRAC-selected EROs (iERO, 20, Yan et al. 2004), consistent with being galaxies at z1-2. The importance of this screening is clear when one considers that most samples of systems satisfying the high-redshift LBG selection criteria distinctly lack confirmatory spectroscopy and several of the recently reported IRAC-detected modelled z5 LBGs do not have confirmed spectroscopic redshifts (Egami et al. 2005; Mobasher et al. 2005; Yan et al. 2005). In the case of the z6 LBG in Mobasher et al. (2005), an interloper solution is more plausible Dunlop et al. (2006).
Our initial optical selection potentially includes low mass stars within the Galaxy and QSOs. These are spatially unresolved in the ACS data are therefore straightforwardly excluded. We identified 19 such objects. These objects generally have the brightest visible emission amongst the systems that satisfy our selection criteria (23). Vanzella et al. (2006) obtained spectra of four of these objects with sufficient quality for them to be classified as stars, supporting the exclusion of unresolved objects from our robust sample. Had we included them and subjected them to synthesis modelling, their best-fit models would imply implausibly high star formation rates and young ages. Thus, without screening for these objects, our derived ensemble properties would be heavily biased towards young ages and high star formation rates.
Finally, as accurate estimates of the ages, masses and star-formation histories of our galaxies are dependent upon well-sampled SEDs, it is imperative to analyse the objects with the most robust photometry. Therefore, we additionally excluded the results from 47 sources with secure detections in only two or three bands (including and ), with the remaining constraints being upper limits. There are insufficient data to constrain the models to accurately constrain their physical properties, and these systems are flagged as having ’insufficient photometry’. A significant fraction of these systems are blended with a nearby source in the IRAC bands. Because blending is purely a random alignment of foreground sources with our high redshift candidates, there is no reason these should be different to the isolated candidates. Accordingly, we do not find any evidence for a systematic difference in the derived properties of the blended and isolated sub-samples. We note that this step may preferentially exclude LBGs with high star formation rates, low masses and young ages as these are less likely to be detected in the IRAC bands. Massive, old LBGs selected at the same band magnitude as younger, lower mass systems are intrinsically brighter in the observed IR and so require more of the photometric bands to be compromised in order to exclude them in this way.
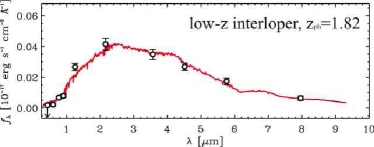
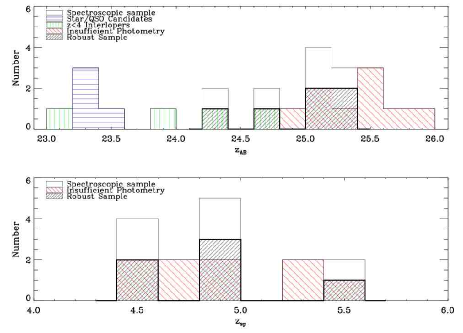
This culling process renders a final robust sample of 21 galaxies which is the focus of our study. Since each step in the culling process (apart from the last) is unbiased with respect to the physical properties of our high redshift galaxies, the final robust sample is expected to be representative of the bright, z5 galaxy population selected by the Lyman-break technique, with the possibility that the lower mass and younger systems may be underrepresented. The use of the longer wavelength near- and mid-infrared data have enabled us to construct a uniformly selected rest-frame UV sample that is reliable. Figure 2 shows the magnitude distribution of the robust sample in comparison to all objects satisfying our selection criteria and the culled members. As expected, we find that the Star/QSO candidates and low-redshift galaxies are in the most part the brightest sources that satisfy our initial selection criteria. The histograms of the robust sample and the LBG candidates flagged as having insufficient-photometry suggest that the former comprises the brighter members of the z5 population and the latter the fainter members. Indeed 6 LBGs from the robust sample, and 9 candidates with insufficient photometry, have been spectroscopically confirmed to be z5 LBGs (see Section 4.1, Vanzella et al. 2005).
3 Evolutionary Stellar Synthesis Modelling
Using a library of synthetic spectra (Bruzual & Charlot 2003), we modelled the SED of each LBG candidate simultaneously deriving photometric redshifts and the key properties of age, extinction, star formation rate and stellar mass. We explored a range of star formation histories (constant star formation rate, instantaneous burst, and exponentially decaying star formation rates with -folding timescales ranging from 10 to 1). The UV emission from galaxies is dominated by the population of short-lived massive OB and A stars. Models of continuous star formation enable the production of these massive stars even at old ages. In contrast, massive stars die away rapidly in an instantaneous burst model and conspicuous UV emission is only produced at very young ages. For a given initial mass function (IMF), model fits with these two star formation histories will bracket the possible age range of the galaxies. Our emphasis on the constant star formation model therefore provides upper limits to the best-fit stellar ages. For this reason we concentrate our analysis on the results obtained for a constant star formation rate. The effects of adopting alternative star formation histories on our results are discussed in Appendix A.
For all of our models, we used a Salpeter stellar IMF between 0.1 and 100. The actual IMF is unconstrained for our objects. A steep rise down to the lower mass cutoff likely is unrealistic in view of the turnover below 1 inferred for the local IMF (e.g. Kroupa 2001; Chabrier 2003), and recent comparisons of dynamical masses and photometric stellar masses suggest that Kroupa/Chabrier-type IMFs would be more appropriate at higher redshift as well (e.g. Förster Schreiber et al. 2006b). The main impact of changing the IMF on our SED modelling is on the derived masses and star formation rates which, for a given rest-frame V-band luminosity, would be about a factor of 1.4-2 lower with the Kroupa (2001) or Chabrier (2003) IMFs (Bruzual & Charlot 2003, see; see also the discussion by Papovich et al. 2001, in the context of SED modelling of z3 LBGs). At z 2, and more so at z5, top-heavy IMFs with a larger proportion of massive () stars, or even extremely massive () metal-free stars formed from primordial gas (“population III” stars) may be an issue (e.g. Schneider et al. 2006; Yoshida et al. 2004; Baugh et al. 2005). If so, using such an IMF in the modelling would lead to a reduction of the derived stellar masses and SFRs.
We adopted Bruzual & Charlot (2003) models with a metallicity of one-fifth solar and, for consistency, a Small Magellanic Cloud-type (SMC-type) dust extinction law (Prévot et al. 1984; Bouchet et al. 1985). Observational constraints on the metallicity of z5 galaxies are scarce; however, the metallicities derived from absorption lines in the spectra of eigth z5 LBGs in the Subaru Deep Field are (Ando et al. 2004), suggesting that our choice of is reasonably representative. For each individual galaxy, best-fit parameters were derived from minimisation of the reduced statistic. All model fitting followed standard procedures applied in similar studies of high redshift galaxies (e.g., Papovich et al. 2001, 2006; Shapley et al. 2001, 2005; Förster Schreiber et al. 2004; Yan et al. 2006a). We assumed a constant marginalisation for each of the models. While our results are marginalised over the extinction law, metallicity, star formation history and IMF, we have actually explored a range of all of these parameters (see Appendix A) but the results presented correspond to our preferred single values of these properties as described above. Detailed aspects of the modelling procedure will be described in a forthcoming paper (N.M. Förster Schreiber et al., in preparation, Paper II).
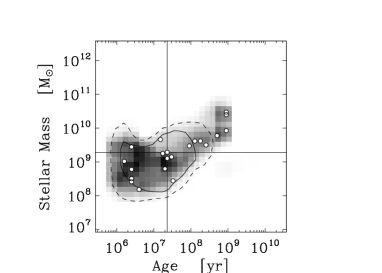
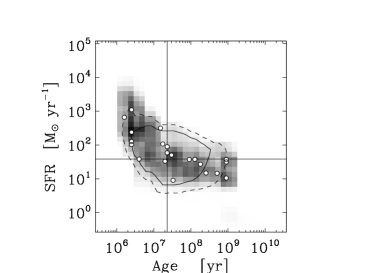
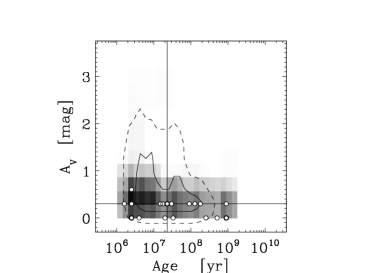
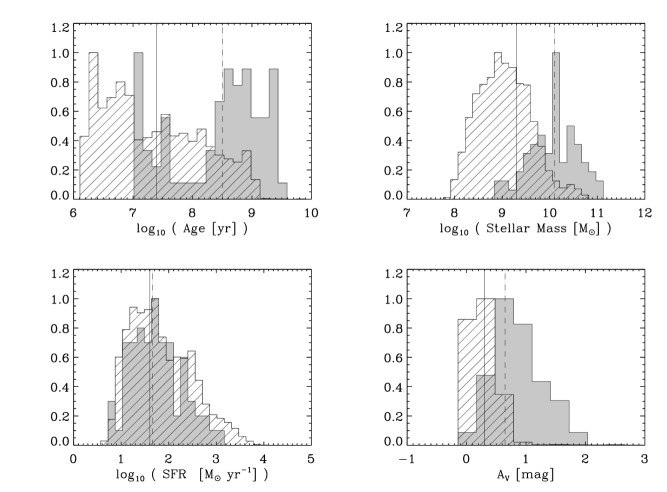
We note that it is difficult to differentiate between the exact metallicity, extinction by dust and star formation histories for each individual galaxy based solely upon the goodness-of-fit because of degeneracies among these model parameters. Therefore, to determine the confidence intervals for the modelled properties, we ran 500 Monte Carlo simulations for each object. We applied the same best-fitting procedure after perturbing the input broadband photometry assuming the photometric uncertainties are Gaussian as indicated by our background noise fluctuations analysis (see Section 2). The results of these simulations provide the probability distribution in parameter space for each source. By combining these individual probability distributions, we derived those for the properties of the ensemble of sources (see, e.g., Papovich et al. 2001, for an analogous approach). Example combined probability distributions for the age, stellar mass, star formation rate and extinction for all of the galaxies in the robust sample are shown in Figure 3. These diagrams show the probability that any galaxy satisfying the Lyman-break criteria has of having those properties. From these we can therefore determine the characteristic properties of the ensemble of galaxies without relying solely upon the mean of the (degenerate) best-fit solutions.
4 Ensemble properties of the robust sample of z5 LBGs
4.1 Redshifts: Photometric and spectroscopic
The LBGs in the robust sample have best-fitting photometric redshifts in the range 4.60 to 5.54 (zmedian = 4.8) as expected given our initial photometric selection222Using standard procedures (Madau et al. 1996) we estimate the redshift range our selection criteria are sensitive to. This range is determined following the implementation in Lehnert & Bremer (2003). Standard local galaxy templates were modified to account for IGM opacity along the line of sight short-ward of Ly (Madau et al. 1996). They were then further modified using the redshift dependent Gunn-Peterson absorption of Ly as described in Fan et al. (2005). This results in star-forming galaxies lying between z4.6 and z6 being able to satisfy our selection criteria.. Our photometric redshifts agree exceptionally well (within 2, or better), for both the high redshift LBGs and low-redshift interlopers, with spectroscopic redshifts where available (see Figure 4 and Table 1).
As part of the public spectroscopic surveys of the CDFS conducted by ESO (Vanzella et al. 2005, 2006, but also see v1.2 release http://www.eso.org/science/goods/spectroscopy/CDFS_Mastercat/), spectroscopy has been performed for 7 LBGs from our robust sample, 6 of which are confirmed to be at z5. The low signal-to-noise ratio of the spectrum of the remaining robust LBG prevented assignment of a redshift. This high confirmation rate reinforces that our selection of z5 LBGs is robust. Spectroscopic redshifts were also secured for 17 additional sources: 4 are stars, 4 are low-redshift interlopers (all agreeing with our photometric/morphological classification) and 9 are confirmed to lie at z5 and are part of our ’insufficient photometry’ sub-sample which we expect includes genuine z5 LBGs. The right panel of Figure 4 shows the -band magnitude and redshift distributions of the spectroscopically confirmed redshift 5 LBGs from the robust sample and those flagged as having insufficient photometry. The latter are slightly fainter than the robust sample while the redshift distribution is similar indicating bona fide fainter LBGs are among the sources flagged as having insufficient photometry.

| zphot | zspec | ||||||||
|---|---|---|---|---|---|---|---|---|---|
| Total | z4 | z4 | Attempted | z4 | z4 | Unassigned | |||
| (1a) | (1b) | (1c) | (2a) | (2b) | (2c) | (2d) | |||
| UV Selection | 109 | 23 | 86 | 34 | 8 | 15 | 11 | ||
| Robust sample | 21 | 0 | 21 | 7 | 0 | 6 | 1 | ||
| Insufficient Photometry | 47 | 1 | 46 | 14 | 0 | 9 | 5 | ||
| Star/QSO | 19 | 0 | 19† | 5 | 4 | 0 | 1 | ||
| Interlopers | 22 | 22 | 0 | 8 | 4 | 0 | 4 | ||
Columns 1(a-c) refer to the results of the SED modelling for all candidates (109) that satisfy our original UV-selection, and columns 2(a-d) for those of the 109 candidates which have been spectroscopically follow-up.
(1a) Total number of sources satisfying our initial selection criterion.
(1b) & (1c) The numbers of LBG candidates with photometric redshifts above and below z=4.
(2a) Total number of LBG candidates from our initial sample that have had spectroscopic measurements.
(2b) Number of candidates for which the spectra were
of insufficient quality to definitively assign a redshift.
(2c) & (2d) The numbers of sources with confirmed spectroscopic redshifts above and below z=4.
† Best-fit redshifts of zphot4 are produced for all
objects classed as stars/QSOs due to the the strong break in their
SEDs being identified with the Lyman-break and because their SEDs
are fit with inappropriate star-forming galaxy templates.
4.2 Stellar Masses, ages, star formation rates and extinction
The rest-frame SEDs of the majority of our prime candidates are very blue from the far-UV to the visible, as is expected for young stellar populations with no more than moderate dust obscuration. The results of our stellar evolutionary synthesis modelling with the parameters specified in Section 3 yields the following typical properties for the galaxies. These are typically strongly star forming galaxies with a median star formation rate of 40. The median photometric stellar mass is 2109, about a factor ten lower than Lyman-break galaxies at z3 (Shapley et al. 2001; Papovich et al. 2001). The stellar mass estimates are the most robust of all derived properties, varying by a factor of 2-5 depending on the model assumptions (see Appendix A). While a large spread in the best-fit age is seen amongst individual sources in the sample the median age is relatively young, 25. The best-fit models imply only moderate extinction with a median value in the V-band of AV = 0.3 mag. Models including extinction at this level fit the SEDs of the z5 LBGs better than models without extinction.
As discussed in Section 3, we use the results of our Monte-Carlo simulations to characterise the properties of the ensemble of z5 LBGs. Figure 3 shows the combined probability distributions for the parameters of mass, star formation rate and extinction as a function of age of the stellar population. While the ensemble probability distribution in age extends over 1 to 1, there is a clear concentration at young ages. As indicated by the contours shown in Figure 3, more than 68 per cent of the age distribution lies at ages less than 100, consistent with the majority (two-thirds) of the galaxies having formal best-fit ages younger than this. In addition, Figure 3(a) shows that these young sources have stellar masses 1010 and typically 109, and Figure 3(b) suggests they are the most strongly star-forming systems within our sample. This is unsurprising as they must have the lowest UV mass-to-light ratios in our sample given their low mass.
The remaining third of our sample have best-fit masses of order 1010M⊙ and ages older than a few hundred million years. These older galaxies are analogous to several galaxies recently reported (Egami et al. 2005; Schaerer & Pelló 2005; Yan et al. 2005; Mobasher et al. 2005; Chary et al. 2005; Eyles et al. 2005; Dow-Hygelund et al. 2005; Yan et al. 2006a) that lie at similar or slightly higher redshifts (z6-7) than ours, where the presence of a discontinuity between the near and mid-infrared bands in the SED is identified with the rest-frame Balmer/4000Å break (Figure 1). This break is indicative of more evolved stellar populations, where the emission from stars with ages of several hundred million years dominates over that from the short-lived massive stars that produce the UV emission. The absence or weakness of a discontinuity between the -band and 3.6m photometry points in the SEDs of the majority of our sample of galaxies with younger best-fit ages strongly limits the possible contribution to the integrated stellar light by such similarly evolved stellar populations. Indeed, the lack of this discontinuity constrains their best-fit ages to less than 100 million years. While old and massive systems are present in the sample, our results clearly indicate that a substantial fraction (two-thirds) of galaxies at z5 satisfying the Lyman break selection criteria are dominated by a young, intensely star-forming component. Similarly young ages and moderate masses (ages 45 and stellar masses 109M⊙) are found for IRAC undetected z6 -band-dropouts (z6) LBG candidates recently reported by Yan et al. (2006a).
In this section we have reported on the typical physical properties for the sample of luminous z5 LBGs for our adopted modelling assumptions. We have extensively investigated the effects of varying the input model parameters on the derived properties and find the key properties of young ages and moderate masses are robust under a wide range of model assumptions. We discuss the effects of varying the input parameters in the Appendix (see also N.M. Förster Schreiber et al. in preparation).
5 Comparison to LBGs at redshift 3
5.1 Stellar Masses, Ages, Star-formation Rates and Extinction
In this section we compare the properties of our z5 sample with those published for the z3 LBG sample from Shapley et al. (2001) which is matched in rest-frame UV luminosity. The SEDs for both samples span the same rest-frame wavelength range and modelling shows significant differences in the stellar masses and ages derived even for identical modelling assumptions. Because of this and the matched selection, we can only ascribe these differences to intrinsic differences in the properties of LBGs at these two epochs.
The -band selection limit of chosen for our z5 sample is matched to the typical magnitude limit of spectroscopically confirmed samples of LBGs at z3. This limit (25.5), is sensitive to z3 LBGs that are 1 mag fainter than =24.48 (Steidel et al. 1999). The band maps to 1700Å in the rest-frame at z3. This enables us to compare the ensemble properties of our robust sample of z5 LBGs to those obtained for 74 z3 LBGs with apparent magnitudes greater than 0.1m* from the sample analysed by Shapley et al. (2001). As well as matching our samples by magnitude, in order to make a fair comparison we have modelled the SEDs of our robust sample of z5 SEDs using the same assumptions as Shapley et al.. Specifically, we used solar metallicity model spectra generated with the Bruzual & Charlot (2003) population synthesis code, a constant star formation history, a Salpeter IMF 333They assume a slightly higher upper mass cut-off of 125 than our assumed 100, however this slight increase has an insignificant effect on the generated models and resultant properties. and a Calzetti attenuation law (Calzetti et al. 2000). Note that this is different a extinction law and metallicity than those used in previous sections, but allows a direct comparison between the two samples. Any differences in the results indicate intrinsic differences in the properties of the two samples, either in properties like mass and star formation rate, or that different extinction laws or metallicities are required at the two epochs.
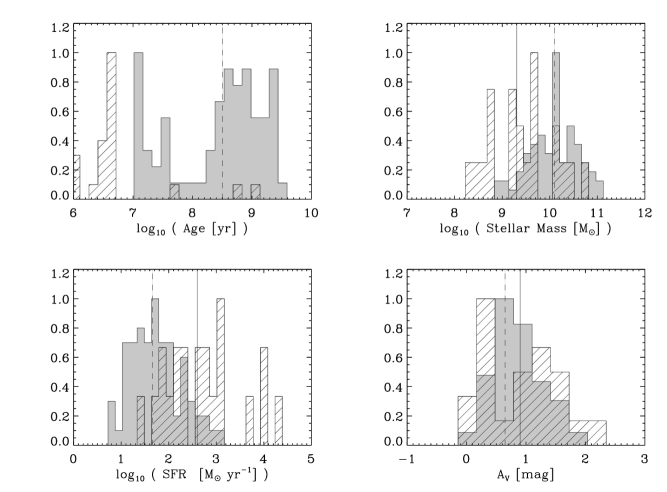
Figure 5 shows the result of this comparison for the best-fit stellar masses, ages, extinctions and star formation rates obtained for a constant star formation history from the z3 LBG sample of Shapley et al. (2001) (shaded histograms) and the results for our robust z5 sample (line filled histograms). While the derived extinctions are well matched, this comparison clearly shows significant differences in the ages, masses and star formation rates between the samples at z3 and z5. The z5 sample shows young typical ages (10), in contrast the z3 LBGs are significantly older (320). The typical stellar mass of z5 LBGs is 5-10 times lower than the z3 sample (few ). Extremely high star formation rates are estimated (500) for the z5 LBGs, a factor of ten higher than the z3 sample. Since we have compared the properties of similarly selected galaxies, based on the same rest-frame UV measurements, to the same UV luminosity, which have been modelled under the same assumptions, these differences can unequivocally be ascribed to inherent differences in the properties of the two samples of LBGs.
Moreover, this comparison demonstrates that adopting Calzetti extinction law and solar metallicity may not be appropriate for this sample of bright z5 LBGs. Implausibly young ages (10) and excessively high star formation rates (103) are seen for a large fraction of the z5 population. The fact that the ages are so signficantly younger than the z3 LBG population (see top left panel Figure 5) is an indication that the SEDs of z5 LBGs are even ’bluer’ than their z3 counterparts. The combination of the adopted extinction law and the high metallicity templates results in these extremely young ages and high star formation rates (see the discussion in Appendix A and also Papovich et al. 2001).
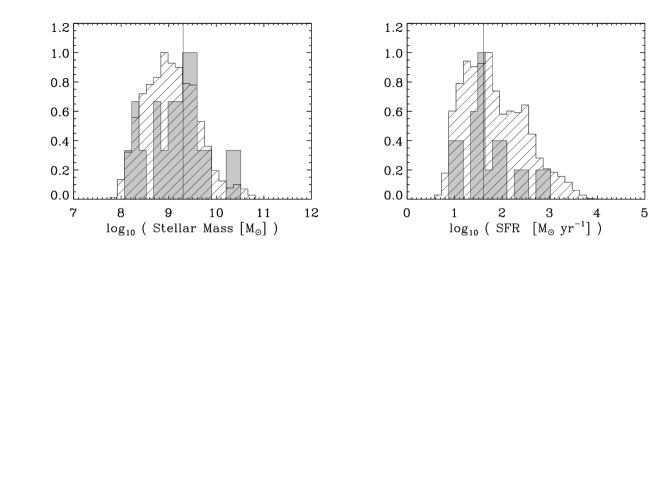
As discussed in Section 3, evidence suggests our consistent choice of 0.2 and the SMC extinction law is suitable to model the blue SEDs of our z5 LBGs. Shapley et al. (2001) have discussed the suitablilty of the Calzetti plus solar metallicity models for z3 LBGs. In Figure 6 we show the comparison between the properties of LBGs at z3 and z5 under these appropriate (but different) assumptions. We have elected to show the probability distribution of properties obtained from our Monte Carlo simulations of the z5 LBGs to give less importance to the formal best-fit solution which can be sensitive to the modelling assumptions. Since the probability histograms follow the same distribution as the best-fit parameters themselves (see example for stellar mass and SFRs in Figure 7), our comparison using the probability distributions is reasonable.
Figure 6 shows that the distributions of star formation rates are extremely well matched, however, there are clear differences in the distributions of stellar mass, age and extinction. The typical stellar mass of LBGs is a factor of ten lower at redshift 5 than at redshift 3. Similarly, the distribution of ages shows more sources have ages 100 in the z5 sample than the z3 sample. There is an apparent difference in the distribution of extinctions but this can largely be attributed to differences in the modelling assumptions (Appendix A). This is corroborated by the fact that the extinction distributions overlap almost entirely when the same modelling assumptions have been made as we have shown in Figure 5. Furthermore, a comparison to the results for similarly luminous z3 LBGs studied in Papovich et al. (2001)444Papovich et al. model z3 LBGs with the same metallicity (Bruzual & Charlot 2003) templates and IMF as we have assumed. However, they give best fit results for individual galaxies only with the Calzetti extinction law. Since Papovich et al. give best fit results for a range of star formation histories we consider only those fit with constant star formation and those with best-fit ages less than the e-folding time-scales of their ’best-fit’ exponentially decaying star formation history model. The latter condition for age gives similar results to constant star formation. In addition, we considered only those LBGs from this faint sample which are matched in luminosity to the z5 samples, V24.8. Ten LBGs from Papovich et al. satisfied these criteria., assuming a Calzetti extinction law but with the 0.2 templates, shows similar extinction for the z3 LBGs as is seen in Figure 6. Thus the difference in the extinction between z5 and z3 LBGs seen in Figure 6 is mostly a consequence of the adopted extinction law and not the metallicity of the templates.
Papovich et al. (2001) have comprehensively discussed the effects of different model assumptions on the derived properties of a faint sample of z3 LBGs. Their combined probability distributions highlight the problems associated with using the Calzetti extinction law with the low metallicity Bruzual & Charlot (2003) templates. In their Figure 9b, they show the probability distribution resulting from the SED modelling assuming a Calzetti extinction law with the bluer 0.2 metallicity templates. A clear extension of sources with extremely young ages ( 10) and high (2) is seen. This extension almost disappears under a Calzetti law with , and with the SMC law for either the 0.2 or 1 models (compare their figure 9b with 9d, 12b and 12d for a Salpeter IMF).
Thus, adopting the Calzetti law with the solar or low metallicity templates would only act to reduce the derived ages of the z5 LBGs and results in stellar masses that are 5-10 times lower than z3 LBGs, i.e. leaving our primary conclusions of young ages and moderate masses for z5 LBGs unaffected. Moreover, under all suitable assumptions for the extinction law and consistent metallicities (i.e. 1 with the Calzetti law, 0.2 or 1 with SMC), we find that galaxies with ages (100) and masses () dominate samples of bright LBGs at z5. Our analysis of the probability histograms and distributions shown in Figures 3 and 6 shows that this fraction to be 70 per cent. However, while z3 LBGs with such young ages and similar stellar masses are not unknown (e.g. Papovich et al. 2001; Shapley et al. 2001), they are less than half as prevalent in LBG samples at z3 than at z5 (30 per cent). This unequivocal change in the age and mass of the dominant population in luminous LBG samples separated by 1, implies that at z5 is an epoch where the majority of LBGs are recently formed and are in the process of accumulating their first significant mass.
5.2 Duty cycle and bias
We have shown in the previous sections that the dominant population of LBGs in our z5 sample is younger and of lower mass than that in z3 LBG samples with similar UV luminosities. Since the majority of LBGs at z5 are so young, it is inevitable their detectability is highly stochastic and this stochasticity impacts upon the interpretation of other statistical properties such as their clustering strength, number density and bias.
Lehnert & Bremer (2003) showed that the co-moving number density of z5 LBGs selected in a similar manner to our robust sample was a factor of three lower than that of similar luminosity LBGs at z3 and z4 (Steidel et al. 1999). If the LBGs at both epochs had identical properties then this can be directly related to evolution in the comoving number densities of the halos that they occupy. Clearly, this naïve picture is complicated by the clear difference in properties of the two samples in the previous section. Moreover, the younger ages of the higher redshift sample imply a shorter duty cycle for the LBG, related to the length of time a galaxy would be detected as a UV luminous LBG.
Given that the average lifetime of the z5 LBGs of 25 and that the lookback time spanned by our survey (325 over the redshift range of the z5 LBGs 4.4 z 5.6), suggests that luminous members of the z5 LBG populations have a duty cycle of 0.08. A similar estimate for z3 LBGs by Shapley et al. (2001), renders a duty cycle of 0.5, significantly longer than at z5. So across the two sample volumes, the higher redshift sample represents systems thirteen times as numerous as those detected, whereas the lower redshift sample misses only half of the potential LBGs in the volume. Clearly, the young ages of bulk of the high redshift sample have a significant effect on the bias of these sources.
LBGs have been long known to be a significantly clustered population (e.g. Adelberger et al. 1998; Giavalisco et al. 1998; Ouchi et al. 2004b; Lee et al. 2006)555Further analysis on the clustering strength of z5 LBGs will be presented in a forthcoming paper A. Verma et al. in preparation, Paper III. Clustering analysis of 23.5 25.5 LBGs at z3 suggests that LBGs reside in dark matter halos of masses (Adelberger et al. 2005) consistent with recent estimates of the dynamical virial mass of the DM halos of LBGs determined rotation curves of z3 LBGs (Weatherley & Warren 2005; Nesvadba et al. 2006). For z5 LBGs, Lee et al. (2006) suggest slightly lower halo masses may be plausible () however the uncertainties are too large to see a significant difference between the z3 and z5 populations. This conclusion is similar to that of Ouchi et al. (2004b) who found an increase (of marginal significance) in the correlation length with increasing redshift which is consistent with a constant halo mass of 1012 over z=3-to-5. Again, however, the uncertainties, especially for the highest redshift LBGs, were large. Given this, and in the absence of dynamical measurements of z5 LBGs, we adopt the z3 mass range (, Adelberger et al. 2005) for the dark matter halos for z5 LBGs. Given that the comoving number density of underlying dark matter halos of sufficient mass to host such LBGs is evolving strongly from z = 5 to 3 (Mo & White 2002), the bias of the LBGs must be increasing with redshift (Ouchi et al. 2004b).
The uncertainties in the clustering statistics of LBGs at z5 are still relatively large. The determination of accurate halo masses at z5 will come from a analysis of the clustering statistics of a sufficiently large sample of either spectroscopically-confirmed or photometrically-robust LBGs (e.g. Ouchi et al. 2004b). As we have shown in this paper, the latter requires a sample defined using both optical and infrared bands to exclude low redshift galaxies. Until this is done comprehensively, clustering statistics from samples selected by optical photometry alone or those that only include shallow infrared data, should be interpreted with caution.
5.3 Evolution of the global star formation rate and stellar mass densities
5.3.1 Global star formation rate density
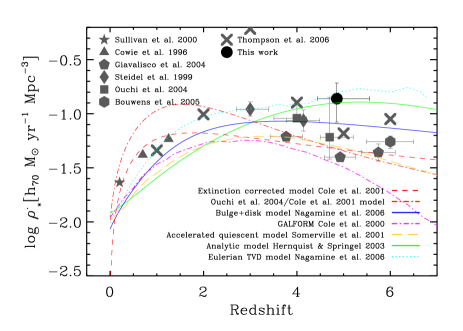
The evolution in the star formation rate density (SFRD) with redshift has been a crucial tool in our understanding of the evolution of galaxies in an ageing Universe. The ground-breaking ’Madau-plot’ (Madau et al. 1996) and versions thereafter have clearly defined the era of peak star formation activity in the Universe (z 1-2, e.g. Connolly et al. 1997; Heavens et al. 2004), however constraining the SFRD at higher redshifts is still an issue of debate with direct observed estimates suggesting a decline for z 3, while estimates based on integrating over the luminosity function and theoretical predictions (Somerville et al. 2004; Nagamine et al. 2006) imply a constant value or shallow decline beyond the peak at z 2 (e.g. Steidel et al. 1999; Bunker et al. 2004; Ouchi et al. 2004a; Giavalisco et al. 2004a; Bouwens et al. 2005; Bouwens & Illingworth 2006; see also Hopkins & Beacom 2006 for a compilation and references therein). The model of Hernquist & Springel (2003) and the TVD hydrodynamical simulations of Nagamine et al. (2006) suggest the SFRD might still be increasing at z5.
Our results from the SED modelling of z5 LBGs has an impact on this. The SFRD derived from the best-fit star formation rates for LBGs in our sample is compared in Figure 8 to several recent observational determinations and model predictions from the literature. This is determined from the total SFR for our robust sample, corrected for the number of true z5 LBGs we expect in our total sample of 109 sources (all except the 40 per cent interloper fraction), incompleteness at our magnitude limit (90 per cent666Gwyn, determined from the v1.0 release of the ACS data see http://www.astro.uvic.ca/grads/gwyn/virmos/cdfs/index5.html.) and accounting for galaxies to L*777assuming the z3 luminosity function of Steidel et al. (1999) (=-1.6) since the faint end slope of the z5 luminosity function remains uncertain., over our survey volume. Nominally, the survey volume is given by the area of the field, multiplied by the depth in redshift space between the minimum and maximum redshifts that can satisfy our initial selection criteria. However, not all sources would remain in our magnitude limited sample because of cosmological dimming and increased intervening hydrogen opacity with redshift (Lehnert & Bremer 2003). Making the assumption that all sources are at the maximum possible redshift to remain in the sample (i.e. they are close to the magnitude limit of ) gives a volume probed of 40 per cent the maximum notional volume (consistent with fractions determined from detailed calculations Lehnert & Bremer 2003, and E. Stanway, private communication). The star formation rate density accounting for this effective survey volume is shown if Figure 8. For consistency with the models, the SFRs determined have been corrected to a Chabrier/Kroupa IMF, rather than the Salpeter IMF we have used in the modelling, by dividing by a factor of 1.6 (Nagamine et al. 2006). The high SFRD determined supports no more than shallow decline in the SFRD at high redshift, consistent with the theoretical predictions of Nagamine et al. (2006) and Hernquist & Springel 2003, however lies above the semi-analytic accelerated quiescent model of Somerville et al. (2001).
Star formation rates can also be derived by scaling the intrinsic rest-frame UV luminosities of sources. The additional data points shown in Figure 8 are derived as such. For starbursts younger than , the ratio of star formation rate to UV luminosity declines with age, levelling off at . This is due to the time it takes to build up a UV luminous stellar population in such a galaxy, the levelling-off occurring once their birth and death rates match. In part owing to this effect, a z5 sample matched in intrinsic UV luminosity with a z3 sample will have higher star formation rates for the typically younger ages we infer. Here we note that the UV luminosity density declines by a factor of between and (Lehnert & Bremer 2003). Because of the younger ages at higher redshifts, this must be an upper limit to the decline in SFRD, at least for the more luminous LBGs. A detailed exploration of this issue is left to a forthcoming paper (N.M. Förster Schreiber et al., in preparation, Paper II).
5.3.2 Global stellar mass density
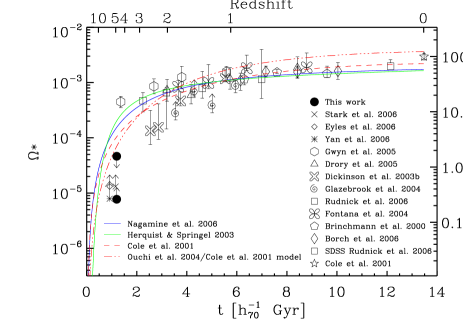
The evolution in the global stellar mass density with redshift places strong constraints on models of the stellar mass assembly in the Universe (Dickinson et al. 2003b). Approximately 50 per cent of the stellar mass in galaxies had formed by z1-1.5, with 10 per cent in place by z3 (Dickinson et al. 2003b; Rudnick et al. 2003, 2006). Accurately constraining the evolution of this property with redshift requires mass-selected (or limited) samples at different epochs. While our sample of luminous LBGs is not mass selected, we can nevertheless place limits on the formation of stellar mass soon after the end of reionisation. We have determined the stellar mass in our survey volume after applying the incompleteness corrections described in the preceding section (with the exception of the correction to 0.1L⋆). The stellar mass density at z5 is Mpc-3 (), for a Salpeter IMF. For consistency with the published modelling, e.g. Nagamine et al. (2006), we reduce this value by 1.4 to account for the difference between the Salpeter IMF and the Chabrier/Kroupa IMF used in the models, as shown in Figure 9. This limit represents 0.3 per cent of the total stellar mass of galaxies seen today and it is consistent with recent estimations at high redshift Stark et al. (2006); Eyles et al. (2006); Yan et al. (2006a).
The stellar mass density derived is a lower limit partly because of the stochasticity discussed in Section 5.2. The relatively short duty cycle of these sources suggests that up to 12-in-13 LBGs at z5 may be missed in our survey. Accounting for this incompleteness places an upper limit on stellar mass density at this epoch for our sources (see Figure 9). Even after accounting for this, our derived upper limit falls below the predictions of the evolution of mass density with redshift obtained from the integration of the models that plausibly explain the SFRD(z) to high redshift (see Figures 9). This is to be expected given our sample is not selected to be mass complete. Extending the mass function to lower masses would again increase the mass density but at a lower level (a factor of a few) compared to the duty cycle correction. Moreover, at z2 as much of the stellar mass density contained within UV-selected samples (Shapley et al. 2005) lies in the population of massive distant red galaxies (Rudnick et al. 2006), which are largely missed by UV selection techniques. Comparably massive galaxies (1011) in the UV selected sample of Shapley et al. (2005) are an order of magnitude less numerous than the DRGs. Whether such massive galaxies dominate the mass density at z5 remains to be established.
The apparent discrepancy between these theoretical predictions and the observed estimates for z 1 has been attributed to incompleteness of the observational data (e.g. Nagamine et al. 2006), or deficiencies in the models, predicting too much stellar mass at high redshift, despite reproducing the SFRD(z). Rudnick et al. (2006) comprehensively discuss both observational estimates and model predictions highlighting the potential causes for the discrepancies from both perspectives (see also the discussion in Gwyn & Hartwick 2005). Notwithstanding, based on the observational data alone, our upper limit implies that 1.5 per cent of the present-day stellar mass density could have already been been assembled in luminous LBGs in the first 1.2, rising by an order of magnitude 1 later (Rudnick et al. 2006). This suggests that once the first galaxies had formed, star formation and stellar mass assembly proceeded at a prodigious rate in the early Universe.
5.4 Mass and luminosity densities
We measured the sizes of LBGs in the robust sample using the ACS -band images. Using the spectroscopic and photometric redshifts, the mean (proper) size of the z5 LBGs is found to be 1 kpc. This is a 40 per cent decrease from the mean size of LBGs at redshift 3 (1.7 kpc), which is fully consistent with the known size evolution of UV-selected galaxies (Ferguson et al. 2004; Bouwens et al. 2004; Bremer et al. 2004).
Trujillo et al. (2004) found that there was no or only weak evolution of the stellar mass densities (mass/r) of galaxies with masses 1010over the redshift range of 0 to 3. While the results of Trujillo et al. (2004) are incomplete for lower mass galaxies, we that the stellar mass densities for our LBGs at z=5 are comparable to that found by Trujillo et al. (2004). However, their UV luminosity densities (luminosity/r) are significantly higher than LBGs at z3 with z5 LBGs producing as much luminosity as z3 LBGs in one-fifth of the volume. This difference cannot be attributed to a low surface brightness, extended component since the ACS images are significantly deeper than our magnitude limit for selection (see also Bouwens et al. 2004).
The fact that the stellar mass densities are comparable to star-forming galaxies at low redshifts, while the observed luminosity densities are significantly higher, is indicative that the mass-to-light ratio of such galaxies is evolving with redshift (Trujillo et al. 2004). LBGs (and DRGs) at z2-to-3 have M/LV ratio of 0.5 - 1 (Trujillo et al. 2004; Shapley et al. 2005) while we find by z5 LBGs have M/LV ratio of 0.1. In the hierarchical framework, stellar mass assembly is likely to have occurred in episodic bursts. Low mass-to-light ratios, such as those we are finding for the z5 LBGs, are expected for galaxies at high redshift which are forming stars in a recent burst. These findings are consistent with our contention that these are young (and likely without a significant intermediate age population, see Appendix B), unextincted intensely star-forming galaxies.
5.5 Lyman alpha emitting galaxies
The spectra of 9 of 15 LBGs with spectroscopic redshifts show an emission feature with an asymmetric line profile and continuum break consistent with the being Ly. For z5 - 6 LBGs, Ando et al. (2006) find that luminous LBGs are Ly deficient, with the separation between those which are Ly emitters occurring at M* (-21.5 to -21.0 mag). They postulate that more luminous LBGs are more chemically evolved systems where dust absorbs the Ly emission, although alternative explanations cannot be ruled out. This is consistent with the ideas put forward by Mori & Umemura (2006) who suggest that Ly emitting and Lyman-break galaxies are evolutionary stages in the chemical enrichment of galaxies that trace the evolution of primeval irregulars to present day ellipticals. From N-body hydrodynamical simulations with stellar population synthesis they state that the Ly is produced by cooling shocks in the early, sub-solar metallicity evolutionary phase for ages 300. Then, up to 1, the stellar continuum increases and the metallicity becomes solar.
We would therefore expect to see a trend in our derived ages and the equivalent width of Ly in our sample with older galaxies having lower equivalent widths. Using the ESO-FORS2 spectroscopy, we have crudely estimated the Ly equivalent widths (ignoring underestimation caused by the blue-shifted absorption due to intervening opacity along the line of sight) of the Ly emission to be -20 EW(Ly) 0 Å for all LBGs in the robust sample, irrespective of absolute magnitude (-24.0-20.5). However, as spectroscopy has only been obtained for the brightest LBGs, it is not surprising that we do not see the extremely faint Ly emitting galaxies with high equivalent widths (-40Å) seen for -21.5. There is no significant correlation between the strength of Ly equivalent width with the nominal best-fit ages. We do not find any strong difference in the distributions of mass or star formation rate suggesting these properties do not influence the presence or absence of Ly. Furthermore, we find no evidence that the ’break-only’ galaxies have a higher average extinction than the galaxies exhibiting Ly in their spectra and therefore attenuation by dust may not be the sole reason why there is a lack of Ly emission in the break-only LBGs. Rather local conditions must influence the presence and strength of Ly emission. It may well be that young galaxies have a high covering fraction of neutral gas which becomes successively more ionised as the galaxy ages. The effect of winds and the geometry of the gas may also play a crucial role in the range of ages seen in galaxies without significant Ly emission.
6 Discussion
We present detailed analysis of the properties of LBGs at z5 with robust and reliable photometry spanning the rest-frame UV to optical. Through a probability analysis we are able to constrain the properties of the ensemble and find that ’young’ ( 100) and moderately massive () galaxies are in fact more than twice as prevalent at z5 (70 per cent) than at z3 (30 per cent). This increased fraction of young and moderately massive galaxies suggests that at redshift 5 we are seeing an era of widespread stellar mass assembly in the early evolution of galaxies. Based on these properties, we discuss three key characteristics of this population that emerge from our analysis.
6.1 Progenitors of present day early type galaxies or bulges
The luminous z5 LBGs studied here are undergoing a period of intense, recent star formation that dominates their rest-frame UV-to-visible emission. Their compact sizes, as measured from the HST images, show that the UV emitting regions are small (mean and median half-light radius of 1kpc). In their short lifetimes, each of these galaxies has already assembled 2 109 of stars within this radius. The inferred stellar mass surface density (6108 kpc-2) is comparable to the bulge and spheroidal components seen in present-day typical (L*) galaxies (e.g. 5108 kpc-2, Galaz et al. 2002).
From a study of nearly 400,000 low redshift galaxies drawn from the Sloan Digital Sky Survey (SDSS), Kauffmann et al. have shown that significant differences between the structural parameters of early and late type galaxies are highly dependent on their mass surface densities, rather than the total mass of the galaxies. Specifically, they find that the concentration parameter () and stellar mass surface densities ( M☉ kpc-2) correspond to the regime of galaxy spheroids and bulges, independent of the total stellar mass of these systems. Above this threshold of mass surface density, they find that star formation is increasingly suppressed in local galaxies (the specific star formation is low) and must have ceased many Gyrs ago. As a consequence, Kauffmann et al. (2006) hypothesize that with increasing compactness and surface density of the galaxy, stars were formed in short, vigorous episodes at high redshift, with extended periods of inactivity (Kauffmann et al. 2006, characterized this as the gas consumption time scale, t). This analysis is particularly appropriate here since we do not find high stellar masses which is often taken as evidence for being progenitors of early type galaxies; we instead find very high mass surface densities. Given the circumstantial evidence that the z5 LBGs in our sample drive winds (see Section 6.2.1), have young ages and short duty cycles, it is also plausible that these galaxies will grow in strong bursts of star-formation. So while we cannot know the evolutionary path of this population of galaxies, their overall mass surface densities suggest that they are the progenitors of early type galaxies or bulges, and favours the “inside-out” galaxy formation scenario.
The star formation that dominates the UV-to-visible SEDs of the z5 LBGs in our sample is likely to be such a burst of star formation in which a significant fraction of the stellar mass of the system has been formed. A simple estimate of the relating the dynamical time-scale to the mass and size of a galaxy is
| (1) |
where is the characteristic (virial) velocity of the system, is a geometrical correction factor that depends on the mass distribution within the system, is the radius or physical scale of the system, is the mass of the system, and is the gravitational constant. Depending upon the mass distribution for a given galaxy, is 3-5, (Binney & Tremaine 1987; Rix et al. 1997). With a median measured half-light radius of 1 kpc and a mass of 2 109, we estimate that the dynamical time-scale of the galaxies in our sample is of order 20. Therefore, the intense star formation in the majority of the z5 LBGs (age100) has been typically proceeding for approximately one to 5 dynamical time-scales. Starbursts, the youngest, large-scale star star forming events seen in nearby galaxies have comparable durations (Lehnert & Heckman 1996; Kennicutt 1998; Förster Schreiber et al. 2003). A system that has assembled a significant fraction of its stellar mass over the last few dynamical time-scales is in essence a galaxy in the process of formation. Thus, the young galaxies in our sample are likely to be members of the long sought-after population of primeval galaxies in the process of significant stellar mass build up.
Further support of the progenitor scenario arises from analysis of the clustering of z5 LBGs. The clustering length of z5 LBGs implies that LL* LBGs at z5 reside in dark matter halos with masses of order 10 (Ouchi et al. 2004b; Lee et al. 2006). While this is comparable to the dark matter mass halo of the Milky Way and to the halos of z3 LBGs (Adelberger et al. 2005), this should not be interpreted as supporting that LBGs are the precursors of galaxies like the Milky Way or z3 populations. Linking a population of galaxies at one redshift with another population at another is fraught uncertainty (see for example, Moustakas & Somerville 2002). If these galaxies are the progenitors of galaxies like the Milky Way, this would require an evolutionary path whereby the clustering amplitude and halo mass does not grow, the bias decreases, but the baryonic mass would have to increase by over an order of magnitude. In a galaxy conserving model for the growth of structure (Fry 1996) and if we think of the estimated bias of the LBG population as z5 as its bias at birth, would suggest that bias would decrease with decreasing redshift while the correlation scale would increase (Fry 1996; Moustakas & Somerville 2002). In such a model, the evolution of both the bias and correlation scale suggest that the z5 LBGs could be the progenitors of the red galaxies at z1 and massive early type galaxies at z0 (Coil et al. 2004; Zehavi et al. 2005). The conclusions would be similar in hierarchical merging models (Ouchi et al. 2004b; Moustakas & Somerville 2002). In either model, it is difficult to say that the z3 and z5 are directly related (except for the large uncertainties in the clustering and bias estimates for the z5 LBGs).
In the hierarchical merging scenario, phase-space density arguments suggest that massive, present-day elliptical galaxies have formed from the merging of high redshift disk galaxies, which are smaller and denser than disk galaxies seen today (Mao & Mo 1998). If the z5 LBGs represent the early stages of the formation of present day bulges and spheroids they should have core phase-space densities that are consistent with their present-day descendants. A significantly lower phase space density would rule out a progenitor scenario. Following Carlberg (1986) and Mao & Mo (1998) the core phase-space density of the typical z5 LBG in our sample is 10-6 (pc km s-1)-3. This is consistent with the core phase-space densities of massive, bright present day ellipticals and the central region of the Milky Way (Carlberg 1986; Wyse 1998; Mao & Mo 1998; Avila-Reese et al. 2005). While we cannot constrain the evolutionary path of these LBGs, this similarity between the core phase-space densities of our z5 LBGs and present day bulges and ellipticals, strongly suggests that the central population in these systems is already in place at high redshift.
The young z5 LBGs may therefore represent the formation of the central regions of present-day massive galaxies at the earliest stages of their evolution. If so, their abundance at a look back time of 12-13 is consistent with the age of the dominant stellar population in the Galactic Bulge (Rich 2005) and its proposed formation in short bursts 1-2 after the Big Bang (Zoccali et al. 2006).
6.2 Enrichment of the intra- and inter-galactic medium
6.2.1 Winds
These galaxies are young relative to the age of the Universe at the epoch they are observed (1.2 at the median redshift). The young ages derived for the majority of z5 LBGs imply that these systems began appreciable star formation at z6 with the bulk of their stars formed at z 6. As such, if reionisation was complete at z5.8 (Becker et al. 2001; Fan et al. 2001), the intense star formation episode studied here could only significantly contribute to the end of reionisation and these galaxies are unlikely to be the perpetrators. However, these young galaxies do have an impact on the high redshift IGM. These compact galaxies are experiencing widespread and recent star formation at prodigious rates. The UV emitting regions are small (1 kpc) and consequently these z5 LBGs have high rest-frame UV surface brightnesses. Given the typical star formation rates inferred from the SED modelling, their star formation rate surface densities (star formation rate per unit area) are several tens to hundreds. This is far higher than observed star formation rate surface densities of local galaxies that are known to be driving vigorous gaseous outflows ( 0.1; Heckman 2001). Thus, young z5 galaxies host strong outflows, expelling the metals created by stellar nucleosynthesis into the surrounding medium. As such, these vigorous starbursts must contribute to the early chemical enrichment of the IGM which is supported by the detection of ions of metals such as Carbon in the IGM at redshifts as high as 5 (Songaila 2005, and references therein).
6.2.2 Galaxy-scale metal-mixing & metal-free star formation
The first stars in the Universe must have been born from gas of primordial abundance (so-called population III stars). Recent detections of the signatures of population III stars in the composite spectrum of z3 - 4 Lyman break galaxies suggest that such a population comprises 10-30% of the stellar mass, implying that galaxy-wide mixing of metals is inefficient on time-scales of a billion years (Jimenez & Haiman 2006)888Note: our assumed 0.2Z⊙ corresponds very well to the combined Z 0Z⊙ and Z0.4Z⊙ mixed model of Jimenez & Haiman (2006).. Most models of galaxy formation have assumed efficient intra-galactic mixing of metals and do not predict metal-free star formation at redshifts significantly below z5 (Yoshida et al. 2004).
While the star-formation intensities suggest that our young galaxies are likely to drive outflows and pollute the IGM with metals, and presumably their own interstellar media, their very young ages imply that this material does not reach far beyond galactic scales. We can quantify this statement by making some simple assumptions about the outflows driven by these high intensity star-forming galaxies in analogy with local starburst galaxies.
The temperature of the outflowing gas can be estimated by simple energetic arguments (i.e., energy injected rate of the intense star formation equals the rate at which material – both ambient and stellar ejecta – is thermalised; Heckman 2001; Moran et al. 1999)
| (2) |
where is the mass of hydrogen, is the energy injection rate, and is the mass outflow rate, is Boltzmann’s constant, and is the fraction of hot gas that results from “mass loading” due to sweeping up and entraining ambient interstellar material. Using the models of Leitherer et al. (1999), at the median age and star-formation rates we have estimated form fits to the SEDs of the robust sample of LBGs, the typical energy and mass injection rates are about 1043 ergs s-1 (=) and about 10(=), respectively to which we have scaled equation 6.2.2.
Similarly, equating the kinetic energy of the gas to the energy injection rate yields an estimate of the outflow velocity:
| (3) |
The mass loading of local starburst winds has been estimated to be about a factor of a few to 10 (Moran et al. 1999). This would decrease the wind velocity accordingly. If we assume that winds are loaded by about a factor of 5, then the wind velocity is 800 km s-1. In the typical age of the LBGs, the wind would traverse 15 kpc. Therefore, in principal, it is possible for the wind to span and enrich the ambient interstellar medium with metals. However, we have assumed that the mass loading is a simple drain on the energy of the wind material itself. In reality, the ambient ISM will be an inhomogeneous medium with clumps of higher density material. The diffuse ISM will get swept up while the clouds will be entrained and accelerated by the ram pressure of the wind material itself. In such an situation, it is important to consider both how a continuous medium and clouds are accelerated in the outflowing gas. Following, e.g., Dyson & Williams (1980), expansion speed of the shell and energy content of the bubble are related as:
| (4) |
where is the (constant) energy injection rate in units of 1043 ergs s-1, =1.0 cm-3 is the ambient ISM density in cm-3 and is the injection time in units of 10. At such velocities, swept-up ambient ISM will traverse about 5 kpc over the age of the typical LBG in our sample. Clouds accelerated in the wind will be dispersed over a similar size scale. Since this is only a factor of a few larger than the half light radii of the galaxies in our sample, given the strong collimation of superwinds observed in the local Universe (e.g., Heckman et al. 1990; Lehnert & Heckman 1996), it is unlikely that the metals in the outflow will be mixed significantly with the infalling or ambient gas.
While even the swept-up ambient ISM is unlikely to be efficiently mixed by the pressure and outflow of the intense star-formation, another interesting time scale to investigate is the cooling time of the hot superwind gas. If the gas were to have a long cooling time, then it would be unavailable for star-formation. This would effectively sequester the metal enriched gas from the stellar mass loss from being incorporated into star-formation over a cooling time scale. We estimated previously that the wind material itself, modulo the mass loading, will have a temperature of 5 107 K. This plasma will also be very rare. We can crudely estimate the density of the gas using the relationship from Chevalier & Clegg (1985), namely,
| (5) | |||||
| (6) |
where we have scaled the radius to 1 kpc, , approximately the half-light radius of the typical LBG in our sample and the area over which energy is being injected by massive stars. If the wind that has reached large distances from the LBG is mass loaded, the density will be of course higher (likely be a factor of a few to 30). The various ranges of density, depending on radius and mass loading is of-order 10-2 to 10-4, similar to what has been estimated in local starburst galaxies. Using this crude estimate, we can investigate the likely cooling time of the wind using standard cooling arguments. For an equilibrium plasma at a temperature of 106.7 to 107.7K and density of 10-2 to 10-4, the cooling time is, roughly 108 years to a few 109 years. Over that duration, the star-formation will be able to build up about 10-30% of the mass of LBGs at z3 and do so with much of the metals generated by the intense star-formation at higher redshifts locked in hot gas that takes about 1 to cool. Of course, the velocities estimated are also to likely be approximately or greater than the escape velocities of the dark matter halos and much of the enriched material may escape. These tight timing constraints are consistent with evidence of both a significant fraction of population III stars in lower redshift Lyman break galaxies and inefficient metal-mixing on intra- and inter-galactic scales (Jimenez & Haiman 2006).
7 Summary
We present the properties of a robust sample of LBGs at z5 selected to in the Chandra Deep Field South. On average, LBGs at z5 are 10 times less massive (109) and are significantly younger (100) than similarly luminous LBGs at z3. While LBGs with such low masses and young ages are not unknown at z3 they are far less common, such systems comprise 70% of LBGs at z5 and in contrast only 30% at z3. Their short duty cycles suggest that the z5 population must be highly stochastic and that samples of z5 LBGs may be highly incomplete, with only 1-in-13 LBGs being detected. Considering this implies that up to 1.5% of the present-day stellar mass density can be accounted for by luminous LBGs (c.f. 15% a later Rudnick et al. 2006). The abundant fraction of young and moderately massive z5 LBGs are likely to be experiencing their first (few) generations of large-scale star formation and are accumulating their first significant stellar mass. Their formation redshifts (z6-to-7) suggests these galaxies could have contributed only to the end of reionisation. They are extremely compact as measured from the UV ACS images (1 kpc) giving rise to high stellar mass and star formation rate surface densities. The stellar mass surface densities and core phase-space densities are comparable to the spheroidal components of present day L* galaxies and suggests these systems are the progenitors of early-type galaxies or bulges, favouring the inside-out galaxy formation scenario. The high star formation rate surface densities implies these sources are driving winds that enrich the inter and intra-galactic media with metals. Their young ages are consistent with inefficient metal-mixing on galaxy-wide scales. Therefore it is plausible that these galaxies contain a significant fraction of metal-free stars as has been proposed for z3 LBGs.
Acknowledgments
We would like to thank the anonymous referee for their constructive and insightful comments that substantially improved this paper. We thank Matthias Tecza and Elizabeth Stanway for their comments and useful discussion. Some of the data presented in this paper were obtained from the Multimission Archive at the Space Telescope Science Institute (MAST). STScI is operated by the Association of Universities for Research in Astronomy, Inc., under NASA contract NAS5-26555. This work is based [in part] on observations made with the Spitzer Space Telescope, which is operated by the Jet Propulsion Laboratory, California Institute of Technology under a contract with NASA. We acknowledge the ESO/GOODS EIS and spectroscopy projects (13,17) which have been carried out using the Very Large Telescope at the ESO Paranal Observatory under Program ID: LP170.A-0788 & LP168.A-0485.
Appendix A Alternative modelling assumptions
To assess the sensitivity of our characteristic ensemble properties to the model assumptions, we fit the SEDs of the z5 LBGs with different sets of input parameters, varying the star formation history (SFH), extinction law and metallicity. As we are interested in the ensemble properties, we focus on the effects of variations on the median properties of the robust sample of z5 LBGs. Degeneracies between the model parameters make it difficult to discriminate between SFHs, extinction laws or metallicities based solely on the reduced chi-squared values (). One must also keep in mind that there are uncertainties in the stellar evolution, spectral libraries, and dust properties themselves, especially important at sub-Magellanic metallicities (see the discussion by Bruzual & Charlot 2003) as well as regarding their validity at z5. Differences in goodness-of-fit, even systematic, may reflect in part template mismatches.
We discuss the effects of varying the assumed parameters in the following subsections and Table 2 summarises some of the key variations. However, in view of all the uncertainties involved, the numbers quoted in the following should not be taken at face value but rather as indications of overall trends. The interloper fraction (low galaxies as well as star/QSO candidates) for the initial sample of 109 candidate z5 LBGs is roughly 40% in all cases; the median for the robust sample is always around 4.8 except for dust-free models with star formation time-scales longer than , for which it increases by about 0.2. Only models without dust extinction could affect our conclusion of young ages and could make the ensemble as old or older than . However, such models are also those that lead to the poorest fits compared to any other set of input parameters, although they cannot be ruled out from a purely statistical argument. Typical stellar masses for the ensemble of a few are derived for all but the lowest metallicities explored, .
A.1 Star Formation History
In addition to our adopted constant star formation rate (CSF) scenario, we considered a suite of exponentially declining star formation rates (SFRs) with -folding time-scales () of 10, 30, 50, 100, 300, 500 Myr and 1 Gyr, as well as the case of a single stellar population (SSP) formed in an instantaneous burst.
Adopting the 0.2 models and the SMC extinction law, the median best fit age is a few tens of Myr, for all SFHs except for the SSP where it decreases by a factor of 2. This behaviour is not surprising given the degeneracies between age and SFH: the best-fit age gives a measure of the time elapsed since the bulk of stars that dominate the observed SED was formed, so the derived ages tend to be younger for models with shorter star formation time-scales. Since most of the LBGs in the robust sample have ages of a few tens of Myr, any SFH with time-scale of that order or longer is effectively equivalent to a CSF model and the derived ages are similar. The best-fit extinction changes little, with median values of a few tenths of magnitude for down to 0 mag for shorter time-scales. The median SFR decreases by a very modest between CSF and models, and drop by a factor of 2 for (by definition, there is no star formation for a SSP with non-zero age). The median stellar mass shows no systematic variations and remains roughly constant with star formation time-scale, the largest difference amounting to , smaller than the dispersion among individual objects in the sample.
The trends of lower median best-fit ages, values, and SFRs with star formation time-scales are qualitatively the same irrespective of the metallicity or extinction law. The exception is the median age for dust-free models, which increases from 3 Myr for all SFHs to 6 Myr for an SSP; this difference is however at the limit of the age sampling in our modelling and is not very significant. The median SFRs drop by up to a factor of from CSF to models, depending on the metallicity and extinction law. For the stellar masses, the median values vary by a factor of 1.5 or less between different SFHs for any given metallicity and extinction law considered, and up to a factor of 1.8 for models without dust extinction.
A.2 Extinction Law
Our choice of an SMC-type extinction law was motivated by consistency with the adopted metallicity of . Assuming the starburst extinction law of Calzetti et al. (2000, hereafter Calzetti law) instead, which is widely applied in high redshift studies, the median best-fit values increase by a large amount up to about 1.2 mag (0.6 mag for an SSP) and at the same time, extremely young median ages of only a few Myr are derived. The Calzetti law is much greyer (i.e., shallower) in the rest-frame UV than the SMC law, so that higher levels of extinction are allowed but this then requires younger ages to fit the very blue SEDs of our LBG sample. As a consequence of the younger ages and higher values, both the median stellar mass and SFR increase, by factors of and , respectively.
The properties and geometry of interstellar dust at is currently an open issue, and the application of extinction laws derived for low redshift galaxies to high redshift systems is questionable. Low to moderate extinction would be expected for young systems in which it would be unlikely that significant amounts of widespread dust have had sufficient time to form. Moreover, the detection of Ly in the spectrum of some of these systems argues against strong attenuation by dust. There is empirical evidence that dust in LBGs exhibits SMC-like characteristics (Vijh et al. 2003). At higher and given the young ages inferred for our LBG sample, it may be that dust from Type II supernovae dominates the extinction, as proposed for z6 quasars by Maiolino et al. (2004). However, in the absence of determinations valid for star formation dominated LBGs, the SMC extinction law is a reasonable assumption. It also leads to modest extinction, older ages, and lower SFRs that are more plausible than the extremely young ages of a few Myr, and the high and SFRs obtained with the Calzetti extinction law.
Models where we allowed extinction to be a free parameter fit the data better than models without attenuation by dust, even though the required best-fit extinction is modest for our adopted metallicity and SMC extinction law (). This is reflected in the overall systematically higher values for the zero-extinction case. Strictly speaking, the differences are not statistically significant so that models without dust extinction cannot be conclusively excluded. However, given that there is spectroscopic evidence that the metallicity of LBGs is 0.2 (Ando et al. 2004), a dust-free solution is highly unlikely.
A.3 Metallicity
We explored the effects of metallicity with models for (i.e. those available for the Bruzual & Charlot models based on the Padova 1994 evolutionary tracks and BaSeL 3.1 spectral library). For this comparison, we chose the Calzetti extinction law for all metallicities. For any of the SFHs we considered, the best-fit ages are slightly older at higher metallicities. The highest median extinction () is derived for and models. The median stellar masses decrease by a factor of between and while the median SFRs vary by a factor of and are typically lower at both ends of the metallicity range explored. The overall trend for the median stellar masses is preserved for models without dust extinction, but those for the ages and SFRs are reversed.
The typical stellar masses of our robust sample LBGs are thus most affected by changes in the metallicity, but by only a factor of 5 or less. The median masses for our adopted metallicity, supported by spectroscopic results of Ando et al. (2004), lies at the middle of the range inferred between and for any given SFH.
| Parameter | Variation | SFR | Mass | Age | Av |
| Star Formation History 999for 0.2 templates and the SMC extinction law | CSF | few10 | 2109 | few10 Myr | few10-1 mag |
| exp. declining 30 | few 10 | 2109 | few10 Myr | few10-1 mag | |
| exp. declining 30 | 10 | 2109 | few10 Myr | 0 mag | |
| SSP | - | 2 | 10 Myr | 0 mag | |
| Extinction law | SMC | few10 | 2109 | few10 Myr | few10-1 mag |
| Calzetti extinction law | few-several102-3 | 5 | few Myr | 1-2 mag | |
| Metallicity | 1 | few10 | 5109 | 200 | 1-2 mag |
| 0.2 or 0.4 | few102 | 2109 | 100 | 1 mag | |
| 0.002 or 0.02 | few10 | 1109 | few tens | few10-1 mag |
Appendix B Limits on the contribution of an old population
The SEDs of all our z5 LBGs are very blue in the rest-frame UV, indicating the presence of on-going or very recent star formation. The best-fit stellar masses (like all other derived properties) represent those of the young and luminous populations that dominate the integrated rest-frame UV to NIR light. By selection, we would not expect to have picked up old passively evolving galaxies. Therefore it is unlikely that these luminous LBGs contain a significant, older, less luminous component that significantly contributes to the stellar mass. Moreover, the z5 LBGs in our sample are extremely compact in the GOODS-ACS data (1 kpc), and given that they are selected at an -band magnitude significantly brighter than the depth of these images, any old stellar population would have to follow an extremely broad distribution to remain undetected. If any significant old population is distributed over the same extent as the UV luminous galaxy, then this would imply an extremely high mass surface density ( kpc-2), in place already at z5. Such high mass surface densities are known only in the inner regions (kpc-scale) of massive cD galaxies, and they are not for typical starburst galaxies or z3 LBGs. This unlikely high surface density strongly argues against a significant fraction of old stars contributing to the galaxy mass, and suggests that the stellar mass derived from the stellar synthesis modelling is representative of the total mass of the galaxy.
Nevertheless, we can place extreme upper limits on the mass contribution of such an old underlying population following a similar procedure to that used for LBGs at z3 (Papovich et al. 2001; Shapley et al. 2001, 2005). This consistent approach allows us to test whether such an old contribution can explain the mass difference we have found which has been discussed in Section 5. For this we consider an extreme ’worst case’ scenario, requiring the coincidence of a SSP which, compared to scenarios of extended star formation, maximizes the mass-to-light ratio of a “hidden” component for a given age. For this we assume the true photometry of the source is in fact at the brightest 1 limit of our photometric uncertainties. These uncertainties already include a generous 10% to account for flux calibration errors. Therefore, the limit that results is extreme and while there is a chance that it can apply to an individual source, it is highly unlikely to be valid for the population as a whole.
We consider the case of a passively evolving component with an age of 500, the median for the one-third of our robust sample older than 100, and comparable to the oldest ages for z5 LBGs reported by other authors as well (e.g. Eyles et al. 2005; Yan et al. 2006b). The SED of a 500 old SSP peaks in the rest-frame optical, in particular just red-wards of the Balmer/4000 Å break, and so would contribute most to the observed fluxes in the , , and bands. We thus determined the upper limit for an old component by adding to the nominal best-fit SED for each object the maximum contribution from a 500 Myr old SSP allowed by the uncertainties on the , , and photometric points. The typical maximum contribution corresponds to an increase in flux by a factor of 2.5 and translates into a factor of times more stellar mass 101010The additional flux of this old component to the other bands always remains within the uncertainties of the photometry. At observed wavelengths bluer than , the light contribution of the old component becomes much smaller relative to the strong rest-frame UV emission from the young stars. Compared to the and data, the and photometry does not provide useful limits because of significantly lower sensitivity and larger uncertainties..
However this factor must not be taken at face value. The assumption of a 500 - to maximally-old passively evolving population formed in an instantaneous burst, made to maximise the mass-to-light ratio, is more extreme than any detected population. Any scenario with an old component that has been forming stars for some non-negligible period of time, even if short, will reduce this upper limit. And considering our conservative photometric uncertainties, an upper limit to the mass contributions for our z5 LBGs will be considerably less than this. Similar factors have been determined for z3 LBGs (3-5 Papovich et al. 2001; Shapley et al. 2001), and therefore such a potential contribution from old stars would be insufficient to make the mass ranges shown in Section 5 of the sample overlap.
References
- Adelberger & Steidel (2000) Adelberger K. L., Steidel C. C., 2000, ApJ, 544, 218
- Adelberger et al. (1998) Adelberger K. L., Steidel C. C., Giavalisco M., Dickinson M., Pettini M., Kellogg M., 1998, ApJ, 505, 18
- Adelberger et al. (2005) Adelberger K. L., Steidel C. C., Pettini M., Shapley A. E., Reddy N. A., Erb D. K., 2005, ApJ, 619, 697
- Adelberger et al. (2003) Adelberger K. L., Steidel C. C., Shapley A. E., Pettini M., 2003, ApJ, 584, 45
- Alvarez et al. (2006) Alvarez M. A., Shapiro P. R., Ahn K., Iliev I. T., 2006, ArXiv Astrophysics e-prints
- Ando et al. (2006) Ando M., Ohta K., Iwata I., Akiyama M., Aoki K., Tamura N., 2006, ApJ, 645, L9
- Ando et al. (2004) Ando M., Ohta K., Iwata I., Watanabe C., Tamura N., Akiyama M., Aoki K., 2004, ApJ, 610, 635
- Avila-Reese et al. (2005) Avila-Reese V., Carrillo A., Valenzuela O., Klypin A., 2005, MNRAS, 361, 997
- Baugh et al. (2005) Baugh C. M., Lacey C. G., Frenk C. S., Granato G. L., Silva L., Bressan A., Benson A. J., Cole S., 2005, MNRAS, 356, 1191
- Becker et al. (2001) Becker R. H., et al., 2001, AJ, 122, 2850
- Binney & Tremaine (1987) Binney J., Tremaine S., 1987, Galactic dynamics. Princeton, NJ, Princeton University Press, 1987, 747 p.
- Borch et al. (2006) Borch A., Meisenheimer K., Bell E. F., Rix H.-W., Wolf C., Dye S., Kleinheinrich M., Kovacs Z., Wisotzki L., 2006, A&A, 453, 869
- Bouchet et al. (1985) Bouchet P., Lequeux J., Maurice E., Prévot L., Prévot-Burnichon M. L., 1985, A&A, 149, 330
- Bouwens & Illingworth (2006) Bouwens R. J., Illingworth G. D., 2006, Nature, 443, 189
- Bouwens et al. (2004) Bouwens R. J., Illingworth G. D., Blakeslee J. P., Broadhurst T. J., Franx M., 2004, ApJ, 611, L1
- Bouwens et al. (2005) Bouwens R. J., Illingworth G. D., Blakeslee J. P., Franx M., 2005, ArXiv Astrophysics e-prints
- Bremer et al. (2004) Bremer M. N., Lehnert M. D., Waddington I., Hardcastle M. J., Boyce P. J., Phillipps S., 2004, MNRAS, 347, L7
- Brinchmann & Ellis (2000) Brinchmann J., Ellis R. S., 2000, ApJ, 536, L77
- Bruzual & Charlot (2003) Bruzual G., Charlot S., 2003, MNRAS, 344, 1000
- Bunker et al. (2004) Bunker A. J., Stanway E. R., Ellis R. S., McMahon R. G., 2004, MNRAS, 355, 374
- Burgarella et al. (2006) Burgarella D., et al., 2006, A&A, 450, 69
- Calzetti et al. (2000) Calzetti D., Armus L., Bohlin R. C., Kinney A. L., Koornneef J., Storchi-Bergmann T., 2000, ApJ, 533, 682
- Carlberg (1986) Carlberg R. G., 1986, ApJ, 310, 593
- Chabrier (2003) Chabrier G., 2003, PASP, 115, 763
- Chary et al. (2005) Chary R.-R., Stern D., Eisenhardt P., 2005, ApJ, 635, L5
- Chevalier & Clegg (1985) Chevalier R. A., Clegg A. W., 1985, Nature, 317, 44
- Coil et al. (2004) Coil A. L., Newman J. A., Kaiser N., Davis M., Ma C.-P., Kocevski D. D., Koo D. C., 2004, ApJ, 617, 765
- Cole et al. (2000) Cole S., Lacey C. G., Baugh C. M., Frenk C. S., 2000, MNRAS, 319, 168
- Cole et al. (2001) Cole S., et al., 2001, MNRAS, 326, 255
- Connolly et al. (1997) Connolly A. J., Szalay A. S., Dickinson M., Subbarao M. U., Brunner R. J., 1997, ApJ, 486, L11+
- Cowie et al. (1996) Cowie L. L., Songaila A., Hu E. M., Cohen J. G., 1996, AJ, 112, 839
- Dickinson et al. (2003a) Dickinson M., Giavalisco M., The Goods Team, 2003a, in The Mass of Galaxies at Low and High Redshift, Bender R., Renzini A., eds., pp. 324–+
- Dickinson et al. (2003b) Dickinson M., Papovich C., Ferguson H. C., Budavári T., 2003b, ApJ, 587, 25
- Dow-Hygelund et al. (2005) Dow-Hygelund C. C., et al., 2005, ApJ, 630, L137
- Drory et al. (2005) Drory N., Salvato M., Gabasch A., Bender R., Hopp U., Feulner G., Pannella M., 2005, ApJ, 619, L131
- Dunlop et al. (2006) Dunlop J. S., Cirasuolo M., McLure R. J., 2006, ArXiv Astrophysics e-prints
- Dyson & Williams (1980) Dyson J. E., Williams D. A., 1980, Physics of the interstellar medium. New York, Halsted Press, 1980. 204 p.
- Egami et al. (2005) Egami E., et al., 2005, ApJ, 618, L5
- Eyles et al. (2006) Eyles L., Bunker A., Ellis R., Lacy M., Stanway E., Stark D., Chiu K., 2006, ArXiv Astrophysics e-prints
- Eyles et al. (2005) Eyles L. P., Bunker A. J., Stanway E. R., Lacy M., Ellis R. S., Doherty M., 2005, MNRAS, 364, 443
- Fan et al. (2001) Fan X., et al., 2001, AJ, 122, 2833
- Fan et al. (2005) Fan X., et al., 2005, ArXiv Astrophysics e-prints
- Ferguson et al. (2004) Ferguson H. C., et al., 2004, ApJ, 600, L107
- Fontana et al. (2004) Fontana A., et al., 2004, A&A, 424, 23
- Förster Schreiber et al. (2006a) Förster Schreiber N. M., et al., 2006a, AJ, 131, 1891
- Förster Schreiber et al. (2006b) Förster Schreiber N. M., et al., 2006b, ApJ, 645, 1062
- Förster Schreiber et al. (2003) Förster Schreiber N. M., Sauvage M., Charmandaris V., Laurent O., Gallais P., Mirabel I. F., Vigroux L., 2003, A&A, 399, 833
- Förster Schreiber et al. (2004) Förster Schreiber N. M., et al., 2004, ApJ, 616, 40
- Fry (1996) Fry J. N., 1996, ApJ, 461, L65+
- Galaz et al. (2002) Galaz G., Dalcanton J. J., Infante L., Treister E., 2002, AJ, 124, 1360
- Giacconi et al. (2001) Giacconi R., et al., 2001, ApJ, 551, 624
- Giavalisco et al. (2004a) Giavalisco M., et al., 2004a, ApJ, 600, L103
- Giavalisco et al. (2004b) Giavalisco M., et al., 2004b, ApJ, 600, L93
- Giavalisco et al. (1998) Giavalisco M., Steidel C. C., Adelberger K. L., Dickinson M. E., Pettini M., Kellogg M., 1998, ApJ, 503, 543
- Glazebrook et al. (2004) Glazebrook K., et al., 2004, Nature, 430, 181
- Groenewegen et al. (2002) Groenewegen M. A. T., et al., 2002, A&A, 392, 741
- Gwyn & Hartwick (2005) Gwyn S. D. J., Hartwick F. D. A., 2005, AJ, 130, 1337
- Heavens et al. (2004) Heavens A., Panter B., Jimenez R., Dunlop J., 2004, Nature, 428, 625
- Heckman (2001) Heckman T. M., 2001, in ASP Conf. Ser. 240: Gas and Galaxy Evolution, Hibbard J. E., Rupen M., van Gorkom J. H., eds., pp. 345–+
- Heckman et al. (1990) Heckman T. M., Armus L., Miley G. K., 1990, ApJS, 74, 833
- Hernquist & Springel (2003) Hernquist L., Springel V., 2003, MNRAS, 341, 1253
- Hopkins & Beacom (2006) Hopkins A. M., Beacom J. F., 2006, ApJ, 651, 142
- Huang et al. (2005) Huang J.-S., et al., 2005, ApJ, 634, 137
- Jimenez & Haiman (2006) Jimenez R., Haiman Z., 2006, Nature, 440, 501
- Kauffmann et al. (2006) Kauffmann G., Heckman T. M., De Lucia G., Brinchmann J., Charlot S., Tremonti C., White S. D. M., Brinkmann J., 2006, MNRAS, 367, 1394
- Kennicutt (1998) Kennicutt R. C., 1998, ARA&A, 36, 189
- Kroupa (2001) Kroupa P., 2001, MNRAS, 322, 231
- Lee et al. (2006) Lee K.-S., Giavalisco M., Gnedin O. Y., Somerville R. S., Ferguson H. C., Dickinson M., Ouchi M., 2006, ApJ, 642, 63
- Lehnert & Bremer (2003) Lehnert M. D., Bremer M., 2003, ApJ, 593, 630
- Lehnert & Heckman (1996) Lehnert M. D., Heckman T. M., 1996, ApJ, 472, 546
- Leitherer et al. (1999) Leitherer C., et al., 1999, ApJS, 123, 3
- Madau et al. (1996) Madau P., Ferguson H. C., Dickinson M. E., Giavalisco M., Steidel C. C., Fruchter A., 1996, MNRAS, 283, 1388
- Maiolino et al. (2004) Maiolino R., Schneider R., Oliva E., Bianchi S., Ferrara A., Mannucci F., Pedani M., Roca Sogorb M., 2004, Nature, 431, 533
- Malhotra & Rhoads (2004) Malhotra S., Rhoads J. E., 2004, ApJ, 617, L5
- Mao & Mo (1998) Mao S., Mo H. J., 1998, MNRAS, 296, 847
- McLure et al. (2006) McLure R. J., et al., 2006, MNRAS, 944
- Mo & White (2002) Mo H. J., White S. D. M., 2002, MNRAS, 336, 112
- Mobasher et al. (2005) Mobasher B., et al., 2005, ApJ, 635, 832
- Moran et al. (1999) Moran E. C., Lehnert M. D., Helfand D. J., 1999, ApJ, 526, 649
- Mori & Umemura (2006) Mori M., Umemura M., 2006, Nature, 440, 644
- Moustakas & Somerville (2002) Moustakas L. A., Somerville R. S., 2002, ApJ, 577, 1
- Nagamine et al. (2006) Nagamine K., Ostriker J. P., Fukugita M., Cen R., 2006, ArXiv Astrophysics e-prints
- Nesvadba et al. (2006) Nesvadba N. P. H., et al., 2006, ArXiv Astrophysics e-prints
- Oke & Gunn (1983) Oke J. B., Gunn J. E., 1983, ApJ, 266, 713
- Olsen et al. (2006) Olsen L. F., et al., 2006, ArXiv Astrophysics e-prints
- Ouchi et al. (2005) Ouchi M., et al., 2005, ApJ, 635, L117
- Ouchi et al. (2004a) Ouchi M., Shimasaku K., Okamura S., Furusawa H., Kashikawa N., Ota K., Doi M., Hamabe M., Kimura M., Komiyama Y., Miyazaki M., Miyazaki S., Nakata F., Sekiguchi M., Yagi M., Yasuda N., 2004a, ApJ, 611, 660
- Ouchi et al. (2004b) —, 2004b, ApJ, 611, 685
- Papovich et al. (2001) Papovich C., Dickinson M., Ferguson H. C., 2001, ApJ, 559, 620
- Papovich et al. (2006) Papovich C., et al., 2006, ApJ, 640, 92
- Pettini et al. (2001) Pettini M., Shapley A. E., Steidel C. C., Cuby J.-G., Dickinson M., Moorwood A. F. M., Adelberger K. L., Giavalisco M., 2001, ApJ, 554, 981
- Prévot et al. (1984) Prévot M. L., Lequeux J., Prévot L., Maurice E., Rocca-Volmerange B., 1984, A&A, 132, 389
- Reddy et al. (2005) Reddy N. A., Erb D. K., Steidel C. C., Shapley A. E., Adelberger K. L., Pettini M., 2005, ApJ, 633, 748
- Rich (2005) Rich R. M., 2005, New Astronomy Review, 49, 465
- Rigopoulou et al. (2006) Rigopoulou D., et al., 2006, ArXiv Astrophysics e-prints
- Rix et al. (1997) Rix H.-W., Guhathakurta P., Colless M., Ing K., 1997, MNRAS, 285, 779
- Roche et al. (2003) Roche N. D., Dunlop J., Almaini O., 2003, MNRAS, 346, 803
- Rudnick et al. (2006) Rudnick G., et al., 2006, ApJ, 650, 624
- Rudnick et al. (2003) Rudnick G., et al., 2003, ApJ, 599, 847
- Schaerer & Pelló (2005) Schaerer D., Pelló R., 2005, MNRAS, 362, 1054
- Schneider et al. (2006) Schneider R., Salvaterra R., Ferrara A., Ciardi B., 2006, MNRAS, 369, 825
- Shapley et al. (2001) Shapley A. E., Steidel C. C., Adelberger K. L., Dickinson M., Giavalisco M., Pettini M., 2001, ApJ, 562, 95
- Shapley et al. (2005) Shapley A. E., Steidel C. C., Erb D. K., Reddy N. A., Adelberger K. L., Pettini M., Barmby P., Huang J., 2005, ApJ, 626, 698
- Shapley et al. (2003) Shapley A. E., Steidel C. C., Pettini M., Adelberger K. L., 2003, ApJ, 588, 65
- Shu et al. (2001) Shu C., Mao S., Mo H. J., 2001, MNRAS, 327, 895
- Somerville et al. (2004) Somerville R. S., et al., 2004, ApJ, 600, L135
- Somerville et al. (2001) Somerville R. S., Primack J. R., Faber S. M., 2001, MNRAS, 320, 504
- Songaila (2005) Songaila A., 2005, AJ, 130, 1996
- Stark et al. (2006) Stark D. P., Bunker A. J., Ellis R. S., Eyles L. P., Lacy M., 2006, ArXiv Astrophysics e-prints
- Steidel et al. (1999) Steidel C. C., Adelberger K. L., Giavalisco M., Dickinson M., Pettini M., 1999, ApJ, 519, 1
- Steidel et al. (2003) Steidel C. C., Adelberger K. L., Shapley A. E., Pettini M., Dickinson M., Giavalisco M., 2003, ApJ, 592, 728
- Steidel & Hamilton (1993) Steidel C. C., Hamilton D., 1993, AJ, 105, 2017
- Steidel et al. (1995) Steidel C. C., Pettini M., Hamilton D., 1995, AJ, 110, 2519
- Sullivan et al. (2000) Sullivan M., Treyer M. A., Ellis R. S., Bridges T. J., Milliard B., Donas J., 2000, MNRAS, 312, 442
- Thompson et al. (2006) Thompson R. I., Eisenstein D., Fan X., Dickinson M., Illingworth G., Kennicutt Jr. R. C., 2006, ApJ, 647, 787
- Trujillo et al. (2004) Trujillo I., et al., 2004, ApJ, 604, 521
- Vanzella et al. (2005) Vanzella E., et al., 2005, A&A, 434, 53
- Vanzella et al. (2006) Vanzella E., et al., 2006, ArXiv Astrophysics e-prints
- Vijh et al. (2003) Vijh U. P., Witt A. N., Gordon K. D., 2003, ApJ, 587, 533
- Weatherley & Warren (2005) Weatherley S. J., Warren S. J., 2005, MNRAS, 363, L6
- Wyse (1998) Wyse R. F. G., 1998, MNRAS, 293, 429
- Yan et al. (2004) Yan H., et al., 2004, ApJ, 616, 63
- Yan et al. (2006a) Yan H., Dickinson M., Giavalisco M., Stern D., Eisenhardt P. R. M., Ferguson H. C., 2006a, ArXiv Astrophysics e-prints
- Yan et al. (2005) Yan H., et al., 2005, ApJ, 634, 109
- Yan et al. (2006b) —, 2006b, New Astronomy Review, 50, 127
- Yoshida et al. (2004) Yoshida N., Bromm V., Hernquist L., 2004, ApJ, 605, 579
- Zehavi et al. (2005) Zehavi I., et al., 2005, ApJ, 630, 1
- Zoccali et al. (2006) Zoccali M., et al., 2006, ArXiv Astrophysics e-prints