11email: fmalacri@ast.obs-mip.fr 22institutetext: Observatoire de Haute-Provence, 04870 Saint-Michel l’Observatoire, France 33institutetext: Centre d’Etude Spatiale des Rayonnements, Observatoire Midi-Pyrénées (CNRS/UPS), BP 4346, 31028 Toulouse Cedex 04, France 44institutetext: Canada-France-Hawaii Telescope Corp., Kamuela, HI 96743, USA
Constraining the rate of GRB visible afterglows with the CFHTLS Very Wide Survey††thanks: Based on observations obtained with MegaPrime/MegaCam, a joint project of CFHT and CEA/DAPNIA, at the Canada-France-Hawaii Telescope (CFHT) which is operated by the National Research Council (NRC) of Canada, the Institut National des Sciences de l’Univers of the Centre National de la Recherche Scientifique (CNRS) of France, and the University of Hawaii
Abstract
Aims. We analyze images of the CFHTLS Very Wide Survey to search for visible orphan afterglows from gamma-ray bursts (GRBs).
Methods. We have searched 490 square degrees down to magnitude r’=22.5 for visible transients similar to GRB afterglows. We translate our observations into constraints on the number of GRB visible afterglows in the sky, by measuring the detection efficiency of our search with a simulation reproducing the characteristics of our observational strategy and the properties of on-axis GRB afterglows.
Results. We have found only three potential candidates, of which two are most probably variable stars, and one presents similarities to an orphan afterglow. We constrain the number of visible afterglows to be less than 220 down to r’=22.5 in the whole sky at any time. Our observations are marginally consistent with the most optimistic model, which predicts orphan afterglows to be about 10 times more frequent than GRBs.
Conclusions. This search has led to the detection of one possible GRB afterglow, and provides the strongest constraints on the rate of GRB visible afterglows as well as an estimation of the observing time required to detect a significant number of GRB afterglows.
Key Words.:
Gamma rays: bursts – Methods: data analysis1 Introduction
The prediction of the existence of orphan GRB afterglows relies on the double assumption that the GRB prompt emission is beamed and that the afterglow emission is still bright enough to be detectable when it starts to radiate outside the GRB beam. This situation, which was described by Rhoads in 1997 soon after the discovery of the first GRB afterglows, makes the detection of visible afterglows possible even without the GRB trigger. Such afterglows are usually called ’orphan afterglows’. The properties and expected number of orphan GRB afterglows have been discussed by Rhoads (rhoads97 (1997, 1999)), Totani & Panaitescu (totani02 (2002)), Nakar, Piran & Granot (nakar02 (2002)), and Dalal et al. (dalal02 (2002)). Huang et al. (huang02 (2002)) have proposed that failed on-axis GRBs with Lorentz factors well below 100 could also produce orphan afterglows.
| Filter | Nim | Sim | Accuracy | Mlim | Density | Success |
|---|---|---|---|---|---|---|
| [] | ||||||
| g’ | 536 | 481 | 0.52 | 23.1 | 31910 | 99.47 |
| r’ | 1302 | 1167 | 0.54 | 22.6 | 41370 | 99.30 |
| i’ | 589 | 531 | 0.51 | 22.4 | 51075 | 99.83 |
The detection of orphan afterglows at optical wavelengths would open a new window in the GRB field. First, it would suppress the existing bias in GRB studies due to the fact that all GRBs observed to date have been detected by their prompt emission at high-energies. Second, since orphan afterglows are thought to be far more numerous than on-axis afterglows, we expect to detect many more nearby afterglows, allowing detailed studies on specific issues like the GRB-SN connection. Third, the detection, or non-detection, of orphan afterglows will provide constraints on the beaming angle and energetics of GRBs (see Rhoads rhoads97 (1997), Totani & Panaitescu totani02 (2002), Nakar, Piran & Granot nakar02 (2002)).
Given the potential science returns from the detection of visible orphan afterglows, various searches have been performed, with very different depth and sky coverage (Becker et al. becker04 (2004), Rykoff et al. rykoff05 (2005), Rau et al. rau06 (2006)). These searches produced no orphan afterglow detection and provided constraints on GRB beaming which are described in section 3. We report here the results of a search performed in images taken for the CFHTLS Very Wide Survey (hereafter CFHTLS-VWS) which has a combination of depth and sky coverage providing an unprecedented sensitivity for orphan afterglow searches. An extensive description of the survey and of our search procedure has been given in Malacrino et al. (malacrino06 (2006), hereafter paper I), we refer the reader to this paper for details. In this letter we focus on the afterglow candidates found in the CFHTLS-VWS images (section 2) and on the constraints that we derive on the frequency of GRB visible afterglows (section 3).
2 Visible afterglow candidates
| NAME | RA | DEC | Nim | Date | Time [SOD] | Filter | Magnitude | Comment |
|---|---|---|---|---|---|---|---|---|
| OT 20050629 | 19 38 06.81 | - 21 22 31.3 | 4 | 2005-06-29 | 38182 | r’ | 21.54 | probably a variable star, |
| 2005-06-29 | 40527 | r’ | 21.55 | only 4 images | ||||
| 2005-06-29 | 42924 | r’ | 21.37 | |||||
| 2005-07-01 | 42422 | r’ | 22.07 | |||||
| OT 20050728 | 15 57 16.78 | -18 50 58.6 | 11 | 2005-06-10 | 34244 | g’ | 23.35 | afterglow candidate, |
| 2005-06-12 | 22204 | g’ | 23.19 | detected in 5 out of 11 images | ||||
| 2005-07-28 | 21849 | i’ | 20.08 | |||||
| 2005-07-28 | 26054 | i’ | 18.66 | |||||
| 2005-07-28 | 30330 | i’ | 20.90 | |||||
| 2005-07-28 | 30631 | i’ | 20.70 | |||||
| 2005-07-29 | 22204 | i’ | 21.58 | |||||
| OT 20060202 | 04 54 05.71 | +21 45 17.8 | 4 | 2006-02-02 | 26962 | i’ | 21.58 | probably a variable star, |
| 2006-02-02 | 30226 | i’ | 21.74 | only 4 images | ||||
| 2006-02-02 | 33356 | i’ | 21.91 | |||||
| 2006-02-03 | 25483 | i’ | 22.01 |
The present work is based on the analysis of images covering an area of 490 square degrees. Their completeness magnitude depends on the filter. 50% of our images are complete down to g’=23.1, r’=22.6, and i’=22.4 (see Table 1). The regions of the sky that have been observed, and the analysis of the images leading to the detection and validation of afterglow candidates are described in detail in paper I. We briefly recall here only the points relevant to our orphan afterglow search.
When a new image is recorded for the CFHTLS-VWS, we construct the catalog of sources in the image. Usually, three images of the same field are acquired about 1 hour apart during a single night, and another one on the following night. Our software compares the sources detected in these images and searches for photometrically variable or moving objects, which are checked by a member of the collaboration less than 24 hours after the acquisition of the images (see paper I for details). A visual examination of these objects led to the rejection of 90% of them, and to the validation of the remaining 10% as truly variable objects, which correponds to 0.007% of the total number of sources.
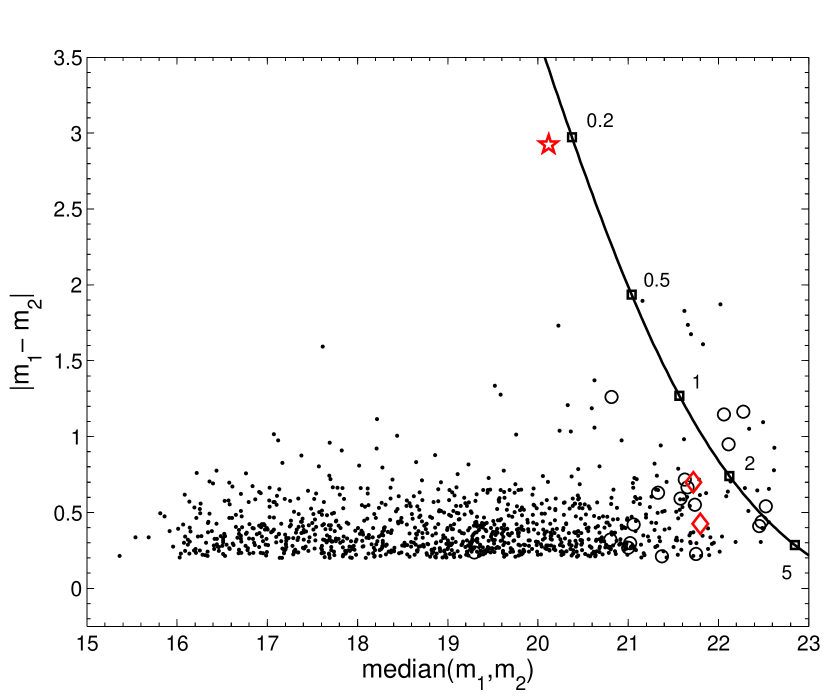
While paper I discusses variable sources found in all comparisons, we restrict the work in this paper to sources found in inter-night comparisons. This is not a strong limitation since all afterglows should be detected in inter-night comparisons (see paper I). Another important point is that we have chosen to restrict our search to objects that vary by 0.2 magnitude or more, a value that offers a good compromise between sensitivity and the number of false detections. Our analysis has led to the identification of 1067 truly variable objects out of more than 18 million, in 549 MegaCAM fields, which shows that few objects in the sky show variations larger than 0.2 magnitude on a timescale of 1 day. The absolute variation in magnitude of these sources between the two nights as a function of their median magnitude is shown in Figure 1.
All the objects of figure 1 have been carefully examined in order to determine their nature. Most of them are variable stars which are identified as such because they are present in archived astronomical images111We use the Aladin sky atlas, Bonnarel et al. (bonnarel00 (2000))., or in the USNO-B1.0 catalog (Monet et al. monet03 (2003)), or in images of the same field acquired during other observational periods of the CFHTLS-VWS. This last method is particularly useful for variable objects fainter than the limit of the USNO-B1.0 catalog (about mag). This selection assumes that GRB afterglows are truly transient sources. During this screening process we also eliminate a few slow moving objects that are referenced in the MPchecker (http://scully.harvard.edu/cgi/CheckMP). These objects can mimick a GRB afterglow that has ’disappeared’ after one day. Variable sources that are not eliminated by one of these methods are classified as ’afterglow candidates’.
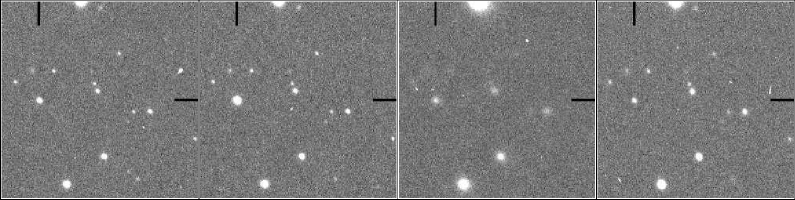
During the real-time process, 26 sources were classified as ’afterglow candidates’. A careful re-analysis of these sources with the full set of images allowed us to re-qualify 23 of them as variable stars. These 23 sources are shown with open circles in Figure 1. We note that nearly all of them are fainter than the magnitude limit of USNO-B1.0, emphasizing the role of this catalog in the rejection of bright variable sources. At the time of writing this paper we are left with only 3 objects, listed in Table 2. Two of them (the diamonds) are probably variable stars which we still consider as ’candidates’ due to the lack of reference images. The last transient (the red in Figure 1) is a remarkable event which shares some similarities with a visible afterglow (the solid line in Figure 1 simulates the track of a typical on-axis afterglow). We have called it OT 20050728, and its evolution is shown in Figure 2. Unfortunately, the available data (see Table 2) are not sufficient to unambiguously determine its nature.
One significant source of background in searches for GRB visible afterglows is flare stars (Kulkarni & Rau kulkarni06 (2006)). We consider that it is unlikely that OT 20050728 is a stellar flare since its long rise time (greater than 1 hour) and its 3 magnitude variation in the i’ band are unusual for stellar flares. We thus consider OT 20050728 as a possible visible afterglow candidate. In view of the importance of the characterization of this event, we have requested additional observations during June and July 2007. We strongly encourage deep observations of this source.
In the following we discuss the rate of GRB visible afterglows under two assumptions; i) our search has led to the detection of zero afterglow, ii) OT 20050728 is a GRB afterglow.
3 Constraining GRB beaming
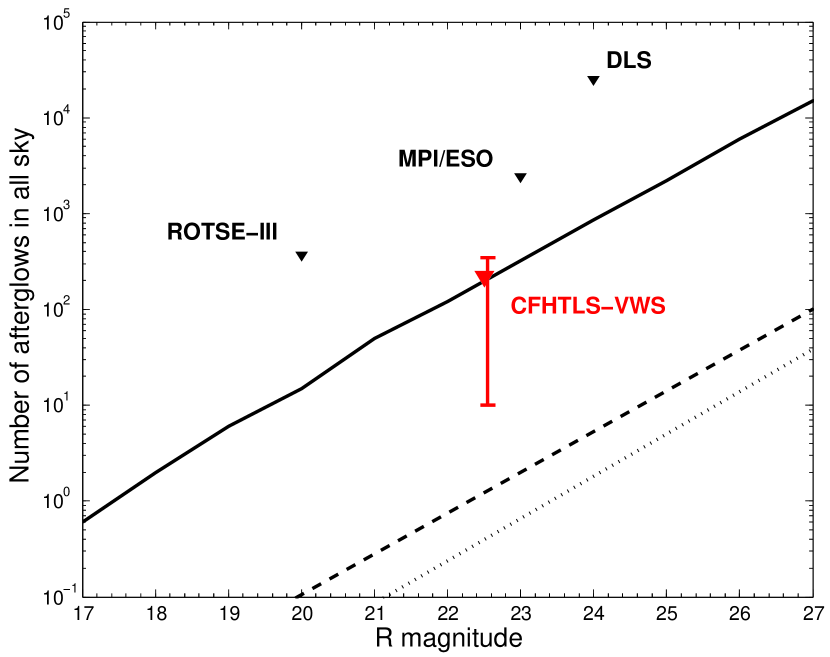
In this section we use our observations to constrain the number of visible afterglows in the whole sky. The transformation of this value into a number of detected afterglows in a given survey depends on parameters describing the observational strategy (sky coverage, limiting magnitude, time between consecutive observations of a given field…) and on parameters describing the afterglows (shape of the light-curve, magnitude at 1 day, magnitude of the host…). We have constructed a simple simulation which generates random afterglow light-curves and computes the fraction detected in a given observational strategy (see paper I for more details). One current limitation of our simulation is that it uses observed light-curves taken from the GCN Circulars, which are presumably generated by on-axis GRBs. This may not be too much of a problem however because in a deep survey like ours, GRB afterglows are detected after several days, when the light-curves of on-axis and off-axis afterglows are similar. According to our simulation, and assuming that we have detected no afterglow, the number of visible afterglows in the sky at a given time down to r’=22.5 is smaller than 220 (90% confidence). This translates into an upper limit of 10100 visible afterglows per year, or less than 13 orphan afterglows per GRB. If we assume in contrast that we have detected one afterglow, the number of afterglows in the sky at a given time is 100, with an error bar comprised between 10 and 350 (90% confidence). These numbers are reported in Figure 3 along with the constraints derived from previous searches and some theoretical estimates.
Figure 3 shows that our search is about 10 times more sensitive than previous works. This is due to its unprecedented combination of depth and sky coverage which has been permitted by the large area of MegaCAM, the high throughput of the 3.6 meter CFH Telescope, the organisation of a survey adequate for visible afterglow searches, and by the implementation of dedicated software allowing a quick processing of the images and an efficient search for variable objects. If we compare our observations to theoretical predictions, the assumption that we have detected no afterglow gives an upper limit which is marginally consistent with the (optimistic) prediction of Totani & Panaitescu (totani02 (2002)), and fully consistent with the more pessimistic predictions of Nakar et al. (nakar02 (2002)), and Zou et al. (zou06 (2006)). If we assume that our candidate is a real afterglow we reach a different conclusion: our data are incompatible with the predictions of Nakar et al. (nakar02 (2002)) and Zou et al. (zou06 (2006)) at the 90% confidence level. More importantly, if OT 20050728 is a true GRB afterglow, our work is the first one to provide an estimate of the amount of observing time needed to detect a significant number of GRB visible afterglows.
While the detection of orphan afterglows was initially proposed as a way to constrain GRB beaming (Rhoads rhoads97 (1997)), more recent work has shown that the number of visible afterglows depends on various factors like the structure of the jet (Dalal et al. dalal02 (2002), Granot et al. granot02 (2002), Nakar et al. nakar02 (2002), Totani & Panaitescu totani02 (2002)) and on the existence of orphan afterglows not due to off-axis GRBs (Huang et al. huang02 (2002), Nakar & Piran nakar03 (2003)). It could be possible to constrain the GRB beaming by including a model of GRB jets in our simulations, but this is beyond the scope of this paper.
Along the duration of the survey our main method to discard false alarms in a search for GRB afterglows has been the comparison with images taken months or years earlier or later. In doing so we rely on the truly transient nature of GRB afterglows, which is one of their most unique properties. This is illustrated in Figure 1, which shows that, among 22 million objects, we have found one thousand sources varying by more than 0.2 magnitude in one day, and that only one of these sources was truly transient. We believe that future efficient searches should be made in regions of the sky covering several tens to a few hundred square degrees, already observed down to m 24-25, and which are outside the Ecliptic and Galactic planes. This is typically the case of weak shear surveys, like the CFHTLS Wide Synoptic Survey which covers a total of 175 square degrees in 5 filters (u*,g’,r’,i’,z’), down to i’=24.5. The existence of such catalogs represents a remarkable opportunity for future searches of GRB visible afterglows. Moreover, the combination of optical and radio observations (Levinson et al. levinson02 (2002), Gal-Yam et al. galyam06 (2006)) may be the best way to measure GRB beaming in the near future.
Acknowledgements.
We thank everyone at CFHT for their continuous support, especially Kanoa Withington. We thank the Observatoire Midi-Pyrénées for funding the Real Time Analysis System.References
- (1) Becker, A. C. et al. 2004, ApJ, 611, 418
- (2) Bonnarel, F., Fernique, P., Bienayme, O. et al. 2000, A&AS, 143, 33
- (3) Dalal, N., Griest, K., & Pruet, J. 2002, ApJ, 564, 209
- (4) Gal-Yam, A., et al. 2006, ApJ, 639, 331
- (5) Granot, J., Panaitescu, A., Kumar, P., and Woosley, S.E. 2002, ApJ, 570, L61
- (6) Huang, Y. F., Dai, Z. G., & Lu, T. 2002, MNRAS, 332, 735
- (7) Kulkarni, S. R., & Rau, A., 2006, ApJ Letter, 644, L63
- (8) Levinson, A., Ofek, E. O., Waxman, E., & Gal-Yam, A. 2002, ApJ, 576, 923
- (9) Malacrino, F., Atteia, J-L., Boër, M. et al. 2006, A&A, 459, 465, paper I
- (10) Monet, D.G., Levine, S.E., Canzian, B., et al. 2003, AJ, 125, 984
- (11) Nakar, A., Piran, T., & Granot, J. 2002, ApJ, 579, 699
- (12) Nakar, A., & Piran, T. 2003, NewA, 8, 141
- (13) Rau, A., Greiner, J., and Schwarz, R. 2006, A&A, 449, 79
- (14) Rhoads, J. E. 1997, ApJ, 487, L1
- (15) Rhoads, J. E. 1999, ApJ, 525, 737
- (16) Rykoff, E. S., Aharonian, F., Akerlof, C. W. et al. 2005, ApJ, 631, 1032
- (17) Totani, T., & Panaitescu, A. 2002, ApJ, 576, 120
- (18) Zou, Y.C., Wu, X.F., & Dai, Z.G. 2006, A&A, accepted, astro-ph/0601292