Evolution of brown dwarf disks:
A Spitzer survey in Upper Scorpius
Abstract
We have carried out a Spitzer survey for brown dwarf disks in the 5 Myr old Upper Scorpius (UpSco) star forming region, using IRS spectroscopy from 8 to 12 and MIPS photometry at 24. Our sample consists of 35 confirmed very low mass members of UpSco. Thirteen objects in this sample show clear excess flux at 24, explained by dust emission from a circum-sub-stellar disk. The spectral energy distributions (SEDs) of the remaining objects are consistent with pure photospheric emission. Objects without excess emission either have no disks at all or disks with inner opacity holes of at least AU radii. Our disk frequency of % is higher than what has been derived previously for K0-M5 stars in the same region (on a 1.8 confidence level), suggesting a mass-dependent disk lifetime in UpSco. The clear distinction between objects with and without disks as well as the lack of transition objects shows that disk dissipation inside 5 AU occurs rapidly, probably on timescales of years. For the objects with disks, most SEDs are uniformly flat with flux levels of a few mJy, well modeled as emission from dusty disks affected by dust settling to the midplane, which also provides indirect evidence for grain growth. The silicate feature around 10 is either absent or weak in our SEDs, arguing for a lack of hot, small dust grains. Compared with younger objects in Taurus, brown dwarf disks in UpSco show less flaring. By comparing SEDs of stars and brown dwarfs in UpSco, we find that dust settling is not a strong function of mass in this region. Taken together, these results clearly demonstrate that we see disks in an advanced evolutionary state: Dust settling and grain growth are ubiquituous in circum-sub-stellar disks at ages of 5 Myr, arguing for planet forming processes in brown dwarf disks. For almost all our targets, results from high-resolution spectroscopy and high-spatial resolution imaging have been published before, thus providing a large sample of brown dwarfs for which information about disks, accretion, and binarity is available. We find that nine out of 13 objects with disks do not accrete significantly. Hence, dusty disks can persist although the continuous accretion has stopped or dropped below measurable levels. Four objects with disks are binaries, three of them with (projected) separations AU. These objects likely harbour small disks truncated by the companion.
1 Introduction
Young brown dwarfs are known to undergo a T Tauri phase similar to solar-mass stars. A large fraction of them exhibits spectroscopic signatures of ongoing accretion and outflows (e.g. Jayawardhana et al., 2003b; Mohanty et al., 2005; Muzerolle et al., 2005) combined with strong, T Tauri like variability (e.g. Scholz & Eislöffel, 2005; Scholz & Jayawardhana, 2006). Moreover, near/mid infrared colour excess has been found, indicative of the presence of dusty circum-sub-stellar disks. It is this latter aspect of the T Tauri phase in brown dwarf evolution that we want to investigate in this paper.
Probing the properties and evolution of brown dwarf disks by analyzing their spectral energy distribution (SED) in the infrared and sub/mm regime is a useful test of brown dwarf origins, for example to distinguish between in situ formation and formation as stellar embryos ejected from a multiple system by searching for signatures of disk truncation (see Whitworth et al., 2006, for a summary). Additionally, disks are believed to be the nurseries of planets, and hence substellar disks allow us to study the early stages of planet formation, i.e. the process of grain and planetesimal growth, in an extreme case, constraining the efficiency and universality of current scenarios for the formation of planetary systems.
Until recently, our knowledge of substellar disks relied on a few case studies. In the pre-Spitzer era, mid-infrared SEDs have been published for example by Natta et al. (2002); Apai et al. (2002); Mohanty et al. (2004b), in total for brown dwarfs with ages of 1-2 Myr, but only for one older object (the Myr old 2M1207, Sterzik et al. (2004)). By comparing the observed spectral energy distributions (SEDs) with model predictions, it has been found that young brown dwarfs appear to harbour disks with a diversity of geometries, which are interpreted as a consequence of disk evolution, consistent with findings for T Tauri stars. In some cases the opening angle of the disks increase with increasing distance from the star (”flared disks”), in others the disk is flat, which is explained as a consequence of grain growth and settling of the larger grains to the disk midplane (Apai et al., 2004; Sterzik et al., 2004).
Larger samples have been investigated in the near-infrared, where ground-based observations are much easier (e.g. Muench et al., 2001; Jayawardhana et al., 2003a), providing constraints on disk frequency as a function of age: Based on near-infrared (K-, L-band) colour excess, disk frequencies decline strongly between 1 and 5 Myr, and only very few brown dwarfs retain their disks longer than that. Thus, the lifetimes for brown dwarf disks are in the range of 5 Myr, which is comparable to the lifetimes of disks of solar-mass stars (Haisch et al., 2001).
It is known, however, that the near-infrared () has major limitations for studies of brown dwarf disks (e.g. Comerón et al., 2000). Problems in this wavelength regime include, for example, the low contrast between disk and photosphere, the restriction to the innermost parts of the disks (), and the presence of strong photospheric molecular bands for these cool objects. As a consequence, the disk census derived from near-infrared observations may be incomplete, and it is difficult to obtain reliable constraints on the disk lifetime. Mid-infrared observations give much better sensitivity for disk detections, because the photospheric flux rapidly declines at . The wavelength range is ideal to probe flaring geometry and inner disk hole sizes by comparing SED with model predictions. Moreover, an analysis of shape and intensity of the silicate feature around 10 is able to give detailed constraints on the warm disk chemistry (e.g. Meeus et al., 2003).
Spitzer provides unprecedented sensitivity between 3 and 24, and thus allows us for the first time to carry out efficient mid-infrared observations of large object samples. Using Spitzer’s IRS spectrograph, Apai et al. (2005) find silicate emission in six substellar disks at ages of 1-2 Myr, and confirm previous claims for grain growth and crystallization. Spitzer also allows to push the limits in disk detection in terms of object age and mass (e.g. Riaz et al., 2006; Luhman et al., 2005a).
Only broad wavelength coverage and large object samples can overcome the large degree of uncertainties when deriving disk properties, considering the numerous degeneracies inherent in radiation transfer modeling of dusty disks, and thus provide reliable constraints on the disk parameters. This consideration is the main guideline for our long-term program to characterize brown dwarf disks. In a first paper, we have combined 1.3 mm measurements for 20 young brown dwarfs in Taurus with Spitzer IRAC/MIPS photometry, to constrain fundamental parameters of substellar disks in a systematic way (Scholz et al., 2006). Our results, together with previous findings by Klein et al. (2003), show that brown dwarf disks can have masses of several Jupiter masses; at least 25% have outer radii AU. In Taurus there is no evidence for truncated disks due to an ejection process early in the life history of brown dwarfs, implying that most sub-stellar objects probably form in isolation.
In this second paper, we focus on evolutionary effects like disk dissipation, inner disk clearing, dust settling, and grain growth, which are believed to be consequences or prerequisites of planet formation. The occurence of these processes in brown dwarfs disks has already been confirmed, mostly at ages of 1-2 Myr. The goal of this paper is to probe disk evolution for a large sample of somewhat older objects. The ideal target region for this project is the star forming association Upper Scorpius (UpSco): With an age of 5 Myr and supposedly low age spread (e.g. Preibisch & Zinnecker, 1999), it is significantly older than the well-studied star forming regions in Chamaeleon, Ophiuchus, and Taurus, the main targets in previous brown dwarf disk surveys, and thus presents disks at an evolved stage. Moreover, UpSco is nearby (distance pc) and contains a large population of substellar objects, confirmed spectroscopically in recent surveys (Ardila et al., 2000; Martín et al., 2004). Small samples () of brown dwarfs in UpSco have already been studied in the near-/mid infrared by Jayawardhana et al. (2003a) and Bouy et al. (2006a).
Using Spitzer IRS spectroscopy and MIPS 24 photometry, we carried out a disk survey for a large sample of 35 UpSco brown dwarfs. This dataset has been complemented by H measurements and results from companions surveys (mostly from the literature), which gives us the opportunity to probe connections between disks, accretion, and binarity. In Sect. 2 we introduce the sample, describe the observations, the data reduction, and the extraction of SEDs. Subsequently, we give a general discussion of our SEDs, and derive an estimate of the disk frequency based on MIPS photometry (Sect. 3). In the subsequent section, we compare the observed fluxes with models to constrain disk geometry (Sect. 4.1) and chemistry (Sect. 4.2). The interpretation of these results is given in Sect. 5, including a discussion of the accretion/disk and disk/binarity connection. Finally, we give our conclusions in Sect. 6.
2 Targets, observations, data reduction
This paper is based on Spitzer observations of 35 very low mass objects in the Upper Scorpius (UpSco) star forming region. The targets have been selected from the surveys of Ardila et al. (2000) and Martín et al. (2004), excluding objects later identified as non-members (Mohanty et al., 2004a). From these spectroscopically confirmed young members of UpSco, we selected 35 objects with spectral type M5, corresponding to effective temperatures 3000 K (Mohanty et al., 2004a; Luhman et al., 2003) and thus masses (Baraffe et al., 1998). Although some of these objects may have masses higher than the substellar limit at , for the sake of simplicity we will call them brown dwarfs in the following. For a more detailed assessment of object masses see Sect. 3.1. Our target sample thus comprises almost all brown dwarfs in UpSco known at the time of the observations and is listed in Table 3.1. It does not include the very low mass objects in this region found recently by Slesnick et al. (2006). We note that the objects in our sample are mostly unbiased with respect to their disk environment, since they have been identified based on colour/magnitude diagrams and spectroscopic youth signatures.
A note on nomenclature: Objects from Ardila et al. (2000) are called ’UScoCTIO XXX’ in the discovery paper, where XXX is an identification number; we will abbreviate them as uscoXXX in the following. The targets from Martín et al. (2004) have originally been detected based on DENIS photometry and are thus called ’DENIS-P J’ plus sky coordinates in DENIS (e.g., DENIS-P J155556.0-204518.5). For brevity, we will name these objects ’usd’ followed by the first six digits of the sky coordinates, e.g. usd155556. To avoid ambiguities, we include the coordinates of all sources in Table 1.
All 35 objects were targets of Spitzer GO program #20435 (PI: Ray Jayawardhana). Since six of these objects overlapped with the GTO program #248 (PI: Subhanjoy Mohanty), they have been observed in the framework of the GTO campaign. For all objects we obtained IRS spectroscopy from 7.4 to 14.5 (module SL, 1st order) and MIPS images at 24. We aimed for a sensitivity of 0.2 mJy, providing clear detections of the photospheric continuum at 10 even for our faintest targets and excellent upper limits at 24, allowing us a reliable distinction between objects with and without disks. The objects were observed with MIPS in one standard dither cycle with 10 sec exposure time per position and small offsets, resulting in a total on-source time of sec. The only exceptions were the six targets observed in program #248, in these cases three cycles were carried out, in total sec on-source time. IRS observations for all objects were carried out with two cycles, two nod positions, and 60 sec ramp duration, resulting in a total on-source time of 240 sec. The peak-up accuracy (i.e. the difference between pointing and requested position) was typically 02 or less; most of this offset is along the slit and thus slit losses are negligible.
We used the post-BCD pipeline products for further reduction (pipeline version S13.2.0). Photometry on the MIPS post-BCD images was carried out using daophot aperture photometry in IRAF with a large aperture of 13” and a sky annulus with inner and outer radii of 20” and 32”, respectively. After applying the aperture correction given in the MIPS data handbook, version 3.2.1, fluxes were converted to mJy. Fifteen brown dwarfs are clearly detected in the MIPS observations, with flux levels between 0.35 and 10.7 mJy. For the non-detections, we estimated a generic upper limit from our images by measuring fluxes in a large number of regions containing only sky and no objects. These regions were chosen to be close to the positions, where the objects are expected to be. After excluding some outliers, these measurements scatter between -0.2 and 0.2 mJy. This is the flux level obtained from pure noise, and we thus infer a 2 upper limit of 0.4 mJy for our MIPS non-detections. We note that this limit may vary somewhat from object to object due to varying background level, but we prefer to use this statistically robust estimate instead of deriving upper limits for each object individually based on small number statistics. We estimate the uncertainty of our MIPS fluxes to be %, composed of uncertainties in calibration (%), aperture correction, and instrumental magnitudes. (According to the suggestions in the MIPS data handbook, colour corrections are negligible for our objects.) All 24 fluxes are listed in Table 1.
For the IRS spectra, we started with the coadded spectra from the BCD data products, pipeline version S13.2.0, and corrected for the sky background by subtracting the two nod positions. Extraction of the spectra was done using the Spitzer IRS Custom Extractor Spice, version 1.3. All our targets are visible as profile peak along the slit, albeit some of them at the detection limit; flux levels at 10 are between 0.2 and 8.5 mJy. Extraction was carried out with standard settings for the two nod positions, followed by averaging these two single datasets to produce the final spectrum for the respective object. Additionally, we extracted the sky noise at two positions in the slit not affected by the objects. After excluding outliers, these noise spectra provide us with an uncertainty estimate for each datapoint in the science spectra. Typical uncertainties of the individual datapoints are in the range of 0.2-0.3 mJy, where 7 spectra are affected of excessive noise in the range of mJy, which can in most cases be attributed to background emission from the molecular cloud. Following the information in the IRS Data Handbook, version 2.0, we expect additional flux calibration uncertainties of %. Because of low flux levels in most spectra and thus low signal-to-noise ratio, we binned all IRS spectra to a resolution of . This reduces the number of datapoints per spectrum from to and improves the signal-to-noise ratio by a factor of . All analysis using the IRS data is done on these binned spectra (see Sect. 4.2).
All IRS spectra were truncated to the wavelength range between 7.5 and 12.5. Fluxes at longer wavelengths are increasingly affected by the ’14 micron teardrop’ effect, which is believed to be a type of scatter light, as described in the IRS data handbook. We calculated broadband fluxes at 9, 10, and 11 from the IRS spectra by averaging over a wavelength range of 1. Table 1 contains these values together with the average noise level for the individual datapoints in the IRS spectrum for all objects.
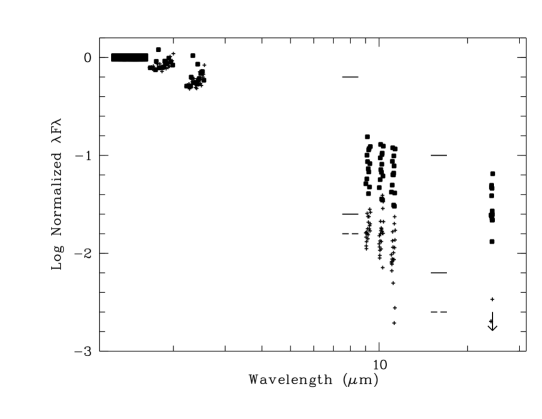
Final spectral energy distributions (SEDs) were produced by combining IRS and MIPS fluxes with near-infrared photometry from 2MASS and optical I-band photometry from Ardila et al. (2000) and Martín et al. (2004). After shifting 2MASS values to the CIT system (Carpenter, 2001), magnitudes were converted to fluxes using the zeropoints given by Skinner (1996), which are based on the CIT zeropoints in Beckwith et al. (1976). Vice versa, we calculated colours by converting the MIPS fluxes to magnitudes using the zeropoint of Jy given in the MIPS data handbook. In Fig. 1 we show all SEDs for our sources, normalized to the J-band fluxes.
The brown dwarf usd160603 appears to have a faint neighbour in the MIPS image, at a separation of 10”. Since this object is not seen in 2MASS images, we assume that this is a spurious source, most likely an asteroid. Because the separation is considerably larger than the slitwidth of IRS (3.7”), the IRS spectrum of usd160603 is probably not affected by this neighbour. (Moreover, the spectrum has been taken three weeks before the MIPS image, thus it is unlikely that the neighbour was at the same position, if it is indeed an asteroid.) The large aperture of the MIPS photometry, however, does contain both objects. To correct for this contamination, we measured relative fluxes of both objects using a small aperture, and corrected the total flux accordingly. We obtain a flux of 2.84 mJy for the brown dwarf and 1.50 mJy for the (likely asteroidal) neighbour.
We aimed to include H measurements for our targets in this paper. Of particular interest is the H 10% width, which is correlated with the disk accretion rate (Natta et al., 2004) and can therefore be used as a signature for accretion. For 19 of our objects, H 10% widths have been published by Jayawardhana et al. (2002) or Mohanty et al. (2005). We observed the remaining 16 objects using the high-resolution spectrographs UVES at ESO/VLT as part of the program 077.C-0323(B) and MIKE at the 6.5 m Clay Magellan telescope on Las Campanas. For UVES we used dichroic 2 with central wavelengths of 437 and 760 nm and a 08 slit, resulting in . For MIKE we used a slit width of 0.7”, binning, and achieved a typical resolution of . Data reduction and line measurements were carried out in a standard fashion, see Scholz & Jayawardhana (2006) for details. All H 10% widths are listed in Table 1. Most of our targets have been observed recently with high spatial resolution to search for companions, either with HST (Kraus et al., 2005) or with adaptive optics (Bouy et al., 2006b). We added the results from these surveys to Table 1.
3 Spectral energy distributions
The aim of this section is to provide an overview of the SEDs for our targets and to determine for how many objects we see evidence for excess mid-infrared emission due to disks. It turns out that based on a comparison of the Spitzer fluxes with photospheric fluxes expected for our targets, the disk frequency in our sample is %. We will start with deriving fundamental parameters for the objects, to be able to estimate photospheric fluxes. Subsequently, we will discuss the SEDs and probe if disk excess is required to interpret the mid-infrared SEDs.
3.1 Fundamental parameters for the targets
A reliable distance of Upper Scorpius has been determined based on the Hipparcos measurements for the high-mass stars in this association. On average the distance is 145 pc (de Zeeuw et al., 1999), with a spread of pc, consistent with a roughly spherical shape for the association (Preibisch et al., 2002).
The age of the pre-main sequence population in Upper Scorpius has been subject of several recent studies. Since we are interested in evolutionary effects, a reliable estimate of the age of UpSco is relevant. For the high-mass stars in this region, an age of 5-6 Myr has been found from several different methods, with no evidence for age spread (de Geus et al., 1989). For the low-mass population, Preibisch & Zinnecker (1999) estimate an age of 5 Myr based on an HR diagram, in agreement with the results for high-mass stars. According to their analysis, the age spread is not significant and probably smaller than 2 Myr. This view has been challenged by Sartori et al. (2003), who find an average age of 8-10 Myr with a large spread of 1-20 Myr for Upper Scorpius. Their HR diagram analysis, however, is mainly based on early-type stars, for which 1-20 Myr isochrones quickly converge to the ZAMS and thus do not allow a clear discrimination between different ages. Therefore, we believe they overestimate the age spread.
Recently, Mohanty et al. (2004a) measured gravities and temperatures from high-resolution spectroscopy for 11 of our targets. When compared with evolutionary tracks, 8 objects are clustered around the 5 Myr isochrone, but three of them (usco104, 128, 130) appear to have ages Myr. Mohanty et al. (2004a) discuss in detail several scenarios to explain this discrepancy, and arrive at the conclusion that a large age spread is unlikely. Instead, they favour a scenario where this apparent age offset arises from evolutionary model uncertainties related to accretion, deuterium burning and/or convection effects. Thus, except for Sartori et al. (2003), all recent studies give an age of Myr and no convincing evidence for strong age spread. This is the assumption which we will use in the remainder of this paper. Still there are some concerns, and a future study of ages in UpSco based on Lithium absorption is desirable.
Visual extinctions have been determined for our sample by Ardila et al. (2000) and Martín et al. (2004). They find an upper limit of mag, for most objects the optical extinction is mag. This shows that a) near-infrared magnitudes are not significantly affected by extinction, and b) there is no indication for close to edge-on disks from the optical magnitudes. Therefore, we can neglect the effects of disk inclination for most of the following analysis.
In Table 1, we list effective temperatures for our 36 targets. These values have been determined by comparing the spectral types with the effective temperature scale provided by Luhman et al. (2003). Mohanty et al. (2004a) derived fundamental parameters for some of our objects by spectral fitting, and their effective temperatures tend to be lower than our estimates by as much as 200 K. This discrepancy reflects the difficulties in assigning a reliable effective temperature scale for these cool objects, but might also be affected by problems in spectral typing. The absolute uncertainties of the effective temperatures in Table 1 are thus probably in the range of K. Since they have been derived in a consistent way, the relative accuracy is certainly better.
The masses for our targets can be constrained by comparing the effective temperatures with the 5 Myr isochrones from Baraffe et al. (2003). With this approach, we obtain masses between and 0.12. The masses derived by Mohanty et al. (2004a) span a larger range, from 0.01 to 0.26, where the discrepancies are probably again due to some problems of the evolutionary tracks at young ages (see Baraffe et al., 2002). Still, these estimates confirm that all our objects have very low masses, although some of them may not be substellar.
3.2 SEDs: General remarks
The mid-infrared SEDs for the sample of 35 brown dwarfs in UpSco are plotted in Fig. 1. In this Section, we give an overview of the derived SEDs purely based on the observational results, without invoking models for comparison.
From the appearance of the SED, we can clearly divide the objects in two classes: There are thirteen objects with clear excess at 24, which also have the highest fluxes between 9 and 11. The remaining ones are either not detected or have very low fluxes in MIPS, and are in most cases faint in IRS. In these two types of SED we likely see objects with and without disks, roughly speaking. (We will show in Sect. 3.3 more definitively that the 13 with the highest 24 fluxes are safe disk detections.) For all objects with MIPS detections, the SEDs (given in flux units) are surprisingly flat: With three exceptions, which will be discussed below, the fluxes at 9-11 are consistent with the fluxes at , and generally on the level of a few mJy. The MIR SED is sensitive to both disk structure and inclination (e.g. Wood et al., 2002); since we can rule out high inclinations (i.e. close to edge-on disks) for all our targets based on the low visual extinction (see Sect. 3.1), this points out that most brown dwarf disks in UpSco have similar structural characteristics, resulting in flat SEDs.
The three exceptions are usco55, usd161833, and usd161939. These are the only objects with MIPS and IRS fluxes mJy, and the only ones which show clear excess flux at 24, compared with . Rising flux levels in the mid-infrared are a trade mark of strongly flared disks, as shown in numerous comparisons of observed and modeled SEDs (e.g. Kenyon & Hartmann, 1987; Dullemond & Dominik, 2004). When the opening angle of the disk increases with its radius, the disk will intercept more light from the central object than a flat disk, leading to excessive mid-infrared emission. On the other hand, a flat disk where the dust has settled to the midplane causes a flat or gradually decreasing SED in the mid-infrared. Thus, the three objects with rising SEDs are probably the ones with the most flaring in our sample. Over all, the degree of flaring is low in UpSco brown dwarf disks, or conversely, most disks are likely affected by dust settling.
All three objects with rising SEDs are known to have companions (see Table 1): usco55 at AU (0.12”) (Kraus et al., 2005), usd161833 at AU (0.9”) (Luhman, 2005), and usd161939 at AU (0.08”)111usd161939 has additionally a wide companion which is, however, likely a background source (Bouy et al., 2006b). (Bouy et al., 2006b). (All physical separations given in AU are projected values assuming a distance of 145 pc; because of the projection factor strictly speaken they should be considered as lower limits to the true separation.) The two closer companions are far from being resolved with MIPS and IRS (which have pixel sizes of 2.4 and 1.8” respectively). The 240 AU companion of usd1618333 is not resolved by MIPS either, and it is likely to contaminate the IRS spectrum to some extent. Thus, our MIPS fluxes for these three objects include the flux from the companion. Photospheric fluxes from the companions, however, are not able to explain the ’flared’ SED appearance, since the photospheres cannot contribute more than 0.5 mJy, less than 5% of our total 24 fluxes for these three objects. Moreover, companions also contribute to near-infrared and IRS fluxes, thus cannot produce an increasing SED. Therefore, we attribute the excess emission at 24 to their disks. A discussion of possible influences of binarity on the disks follows in Sect. 5.4.
Comparable to the overall SED, the IRS spectra alone appear flat or decreasing in most cases. Only three objects – usco112, usd160958, usd161939 – show an indication of an emission feature (further investigated in Sect. 4.2 and Fig. 6). Emission features around 10 (often referred to as silicate features) are assumed to have its origin in an optically thin hot surface layer of small dust grains. The absence or weakness of this feature thus can be interpreted as lack of hot, small grains – possibly due to grain growth and subsequent dust settling to the (colder) disk midplane. Dust settling is confirmed for the majority of our objects by the general appearance of the SED (see above). Additional factors which can lead to dust settling and thus may weaken the silicate feature are a low gas-to-dust ratio or weak turbulence in the disk. We caution that disk inclination can also weaken the emission feature and thus might also play a role in some of our targets, although high inclinations are unlikely (see Sect. 3.1). For a more detailed discussion of the minimal effects of inclination for our sample see also Fig. 5 and the assciated discussion in Sect. 4.1.
Both findings, the uniformly flat SEDs and the paucity of strong dust emission features, demonstrate that UpSco brown dwarfs harbour disks that are clearly in an advanced stage of their evolution. At an age of 5 Myr, flaring is not a major trait anymore. Instead, dust settling likely affects the majority of the disks, possible accompanied (and caused) by grain growth. We will come back to these findings in Sect. 5, where we carry out comparisons with disk properties for younger and more massive objects.
3.3 Disk frequency
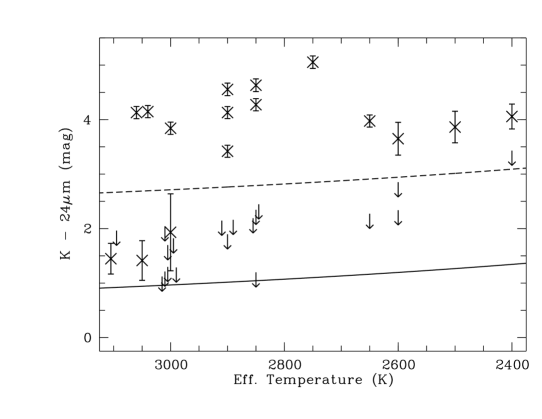
In Fig. 2 we plot the colour vs. effective temperature for all targets. This plot will be used to derive an estimate for the disk frequency in our sample. Specifically, we want to find out for how many objects the measured MIPS flux (or upper limit) is consistent with photospheric emission. For this purpose, we calculate blackbody fluxes for the given effective temperature range at 2.2 and 24, from which we obtain the photospheric colour.
The solid line in Fig. 2 shows the result: Photospheric colours for our targets are between 0.9 and 1.4 mag, depending on effective temperature. Dashed lines show the colour assuming five times the photospheric emission at 24 . All objects with colours exceeding this level, have strong excess emission, and are thus likely to harbour a disk. Thirteen objects with MIPS detection are in this colour range, and are thus primary disk candidates. For one more object, the upper limit is too high to exclude excess due to a disk. For the remaining objects, the MIPS fluxes are fully consistent with pure photospheric emission. In total, the disk frequency for our sample is % (13 out of 35, uncertainty corresponds to the 1 confidence interval based on binomial statistics), but might be as high as 40% (14 out of 35), if we count the upper limit above the threshold.
This estimate is quite robust and does not depend on distance and radii of the objects. Using a conservative limit (dashed line), we make sure that uncertainties in effective temperatures, which might be considerable (see above), and the inaccuracy of the black body approximation does not strongly affect our result. This conservative approach also prevents us from confusing disks with non-resolved, cool companions, which might enhance the mid-infrared flux.
As can be seen in Fig. 2 there is a clear dichotomy in the mid-infrared colours of our targets: Down to K, objects with strong excess are separated by at least 1.2 mag (i.e. a factor of three) from objects without excess. (This is a lower limit, because most objects without excess are in fact non-detections.) For the lowest mass objects, where the noise level increases, the difference between both populations is still at least a factor of two in colour. Thus, most of the objects with disks are clearly separated from objects without disks, leaving only a small number of faint objects with ambiguities. Thus, we can quite reliably conclude that, based on the photometry, the disk frequency in our sample is 37%. This value, derived from an unbiased survey, is somewhat smaller, but still consistent with the disk frequencies obtained from smaller samples of brown dwarfs in UpSco (50%, see Jayawardhana et al., 2003a; Bouy et al., 2006a).
All 13 objects with MIPS detection and clear excess emission, i.e. objects with safe disk detection, are marked in the last column in Table 1. For clarity, they are also plotted with different symbols in Fig. 1. Those are the primary candidates for the comparison with models, which will be described in Sect. 4. Their SEDs are shown in Fig. 3.
4 Modeling the SEDs
In this section, we will compare the observed SEDs with models to obtain more quantitative constraints. Two different and independent approaches are used: a) a Monte Carlo radiative transfer model providing predictions for the MIR fluxes (Sect. 4.1, and b) linear combinations of mass absorption coefficients to fit the dust emission features around 10m (Sect. 4.2). Both approaches give results consistent with the more qualitative discussion in Sect. 3.2: Brown dwarf disks in UpSco are ubiquitously affected by dust settling, possibly grain growth, and inner disk clearing.
4.1 The overall SED
We adopt the same modeling approach for the UpSco Spitzer data as we did in our previous paper on brown dwarf disks (Scholz et al., 2006). These SED models use our Monte Carlo radiation transfer code, ignore accretion, use NextGen model atmospheres for the input spectra (Allard et al., 2001; Hauschildt et al., 1999), and assume the disk surface density profile is given by a power law, . The disk density is parameterized by
| (1) |
where is the radial coordinate in the disk mid-plane and the scaleheight increases with radius, . We vary the degree of flaring within the geometric disk models by adjusting the values of and . We assume two dust size distributions are present within the disk, a) small grains as with an interstellar-like size distribution (Kim et al., 1994, typical grain size ) and b) larger grains with sizes up to 1 mm following a distribution we have used previously to model SEDs of disks around classical T Tauri stars (see Wood et al., 2002, for more details). The smaller, ISM-like grains have a larger scaleheight than a population of larger grains. This is a simple way to mimic dust coagulation and the settling of larger particles towards the disk midplane. In our parameterization we assign the mass to the large grains and the mass to the ISM-like grains. The dust mass is then . For the conversion to the total disk mass, we assumed a gas to dust ratio of 100. For all models we assume that dust in regions close to the star is destroyed if temperatures rise above 1600 K (Duschl et al., 1996). This condition provides a minimum inner dust radius of typically . Any remaining dust within this gap we assume to be optically thin and therefore we effectively have an opacity gap in the disk (Lada & Adams, 1992). For further details of the model ingredients, assumptions, and dust properties see Scholz et al. (2006).
In our previous paper we discussed the many degeneracies in disk parameters that are inherent in SED modeling. In this paper we set the disk mass to be . This disk mass is typical for the sources with 1.3 mm data that we modeled in our Taurus-Auriga sample. In the absence of mm data we cannot constrain the disk mass, as the mid-IR SED is not very sensitive to disk mass (e.g. Wood et al., 2002). The lack of long wavelength data (sub-mm and mm) also precludes us from determining the optical depths of the disks in our sample. As shown by Walker et al. (2004), low mass disks in hydrostatic equilibrium can provide acceptable fits for the mid-IR SEDs of brown dwarf disks. However, our models for Taurus brown dwarf disks showed that such low mass disks are not consistent with mm data. Therefore we believe that very low mass, optically thin disks are unlikely, but mm data is required to test this further. As we demonstrated in Scholz et al. (2006) our data is not sensitive to the outer disk radius, so we choose a disk radius of AU. For the object usd160958, which has a close companion at AU and a disk (see Table 1), we also tried a smaller disk radius of 5 AU.
In Fig. 4 we show the results of our SED fitting for the objects with disk; Table 2 contains the star and disk parameters used to model each source. Each SED shows the data, the input atmosphere model spectrum (dotted line), our model SED using the parameters from Table 2 (solid line), and also the SED for a disk in hydrostatic equilibrium (dashed line, see Scholz et al. (2006) for a description of the hydrostatic disk models). For usd160958, we plot additionally a model with disk radius of 5 AU as dash-dotted line. All models are for a disk inclination angle ; none of our sources show the characteristic faint optical spectra indicative of highly inclined disks (see also Sect. 3.1).
As with our models for brown dwarf disks in Taurus, we immediately see that the highly flared hydrostatic disk models, which assumes that dust and gas are well mixed, produce in all cases larger IR excesses than observed. Thus, some degree of dust settling has to be assumed to match the observed IRS and MIPS fluxes. The models assuming two dust components without hydrostatic equilibrium agree much better with the observations, consistent with a picture of dust grain growth and the settling of larger grains towards the disk midplane, leaving a population of small grains suspended at large heights producing the silicate feature seen in a few cases (Sect. 3.2 and 4.2). The best fit is typically achieved with a small amount of small grains or no small grains at all, i.e. when the dust mass is dominated by the larger grains. The SED of usd160958 can be modeled adequately assuming a small disk radius of 5 AU, again demonstrating that the mid-infrared is not very sensitive to the global disk radius (see Sect. 5.4 for further discussion of the disk-binarity connection).
As described in Scholz et al. (2006), disk structure, inclination, and grain sizes are degenerate parameters in these models. To confirm that dust settling is required to match the observed SEDs, we explored these degeneracies in more detail in Fig. 5. For one exemplarily case, the object usco112, we plot our best fit using the non-hydrostatic model (solid line for large and small grains, dashed line for small grains only) and hydrostatic, highly flared models (with small grains only) for different inclinations (dash-dotted lines). As can be seen in this figure, for low and moderate inclinations the hydrostatic models give clearly too much flux at 24, which turns out to be strongest constraint for the disk geometry. Conversely, we can exclude high disk inclinations (i.e. close to edge-on geometry) based on the low extinction seen in the near-infrared photometry. Thus, some extent of dust settling and/or grain growth is required to explain the observed SED, no matter what value is chosen for the inclination. Fig. 5 also demonstrates that non-hydrostatic models with predominantly large grains and with small grains only are both able to provide a reasonable match to the data, because the large-scale mid-infrared SED is not particularly sensitive to the grain size.
The results from the model fits can be directly compared to our previous findings for younger brown dwarfs in Taurus, where we used the same models. In Taurus, however, we only analysed five out of 20 objects with detection at 1.3 mm; the sample is thus biased towards the most massive (and thus maybe less evolved) disks. For all five Taurus objects a small amount of ISM-like dust is required to fit the model SED. The same is found in UpSco: For five of our disks, the best fit is obtained when we add small grains. The values for the flaring parameters are similar in both samples, but the scaling factors are much smaller (in absolute units) in all UpSco disks, leading to smaller scaleheights at a given radius. Thus, in our large sample in UpSco we do not see disks which are similarly strongly flared as the Taurus sources. This indicates a higher degree of dust settling in the UpSco objects when compared with younger brown dwarfs.
As there is a gap in our data coverage in the m to m region, we cannot constrain the size of any inner disk holes in sources showing IRS and MIPS excesses. Sources without MIR excess, however, either have no disk or a disk with a inner hole, i.e. an optically thin region. To constrain the inner hole sizes, we applied the same models to five objects without excess emission (usco75, usco104, usco130, usd1555605, usd162041). For four of these objects, the resulting model fits are shown in Fig. 4. In all cases, a substantial inner hole is required to explain the lack of excess emission, the minimum hole sizes are 5 AU for usco130, usd155606, usd162041, 7.5 AU for usco104, and 20 AU for usco75. These estimates do not depend significantly on the choice of the grain size.
Taken together, the results from the SED modeling provide strong evidence for dust settling in UpSco brown dwarf disks. Hydrostatic, highly flared models cannot reproduce the observed SEDs. In addition, we find that AU size (opacity) holes are required to fit the SEDs without disk excess.
4.2 The silicate features
The spectral region around 10 is valuable for deriving the composition of the warm (200 K) circumstellar dust. Indeed, it is here that the most common components of astronomical dust have spectral features. Using these features, detailed analysis of the disk chemistry has been carried out previously for Herbig Ae/Be (e.g. Bouwman et al., 2001) and T Tauri stars (e.g. Meeus et al., 2003). According to these studies, the main dust species in circumstellar disks are olivines, pyroxenes and silica, either in amorphous or crystalline state. A similar modeling approach, tailored to our faint targets, will be used in the following to analyse their IRS spectra. For a deeper discussion of the properties of astronomical dust and the mass absorption coefficients we used in this paper, we refer to van Boekel et al. (2005).
Given that the flux levels around 10 are low for most of our targets, resulting in low signal-to-noise in the IRS spectra, we refrained from doing a detailed analysis of the dust composition, which requires high quality data. Instead, we tried to answer two questions using a more robust approach: a) Can we confirm the presence of silicate features in some of our targets (see Sect. 3.2)? b) Is there evidence for grain growth from these features?
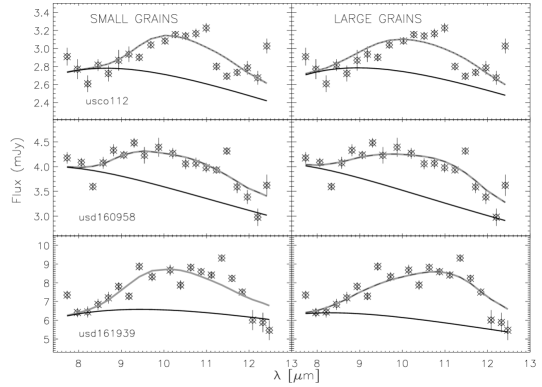
Because changes in the dust composition only causes relatively subtle (for us undetectable) changes in the shape of the silicate feature, we simply adopted a dust composition, which contains only amorphous silicates, the most prominent dust species in many circumstellar disks. To check for evidence of grain growth, we run the models with two different grain sizes, 0.1 and 1.5 m. We represent the dust continuum by a blackbody with a temperature , and for simplicity, assumed that all the grains emitting at 10 m have the same temperature. Since we are modelling emission features, the region where the emission originates must be optically thin. Therefore, the flux of the emission feature can be represented by a linear combination of the mass absorption coefficents: , where is the Planck function with a temperature , and are the mass absorption coefficents and the multiplication factors for each individual species (in our case: only amorphous silicate). We used a reduced analysis to fit the spectra. For each object showing an indication of an emission feature, we obtain a best fit (lowest reduced ) for small and large grains, respectively.
In the following, we summarise the results for our 13 sources with confirmed disk excess (see Sect. 3.3). For three objects, usco112, usd160958, usd161939, we detect a silicate feature, i.e. the spectrum can not be reproduced within the error bars only by a blackbody dust continuum. This is in line with the results from visual inspection of the spectra done in Sect. 3.2. For these three sources, we show the best fit for small and large grains in Fig. 6. As can be seen in the figure, both small and large grains give an adequate fit to the spectra. The values for the best fit do not differ significantly for small and large grains, respectively. Thus, even when using binned data, the flux levels and thus the signal-to-noise in our sample are too low to distinguish between different particle sizes from the IRS spectra.
For the remaining 10 objects with disk the dust emission features around 10 are either absent or too weak to be confidently detected in our spectra. The MIR SEDs from 8 to 13 are mostly flat and featureless. Since the dust emission has its origin in relatively small (), warm grains in the disk atmosphere, this implies that to some extent the dust has settled to the optically thick midplane, a process which is usually thought to be accompanied by grain growth (e.g. Dullemond & Dominik, 2004). Disk inclination might also contribute in some cases to weaken the silicate feature, although this is not a major factor in our sample, because high inclinations (and thus close to edge-on disks) are excluded based on the low extinction (see Sect. 3.1).
In summary, we find silicate features for three out of 13 objects with disks. However, the flux levels and thus the signal-to-noise ratios are too low to give meaningful constraints on dust chemistry and particle sizes from the emission features. For the remaining 10 objects with disk we do not detect an emission feature.
5 Discussion: Brown dwarf disks at 5 Myr
Both the purely empirical discussion of the MIR SEDs in Sect. 3 and the results from the modeling (Sect. 4.1 and 4.2) provide a consistent picture of the disk properties in our sample. Given our large sample of coeval targets, they can be used to give constraints on evolutionary processes in brown dwarf disks. In the following, we will summarise the results from the previous sections and compare them with similar studies for younger objects and more massive stars (Sect. 5.1 and 5.2). Care has to be taken, though, when comparing results obtained at different wavelenghts, because longer wavelenghts probe the disk at larger radii. This is further complicated by the fact that when changing central object masses the same wavelength probes different regions in the disks. Nevertheless, as it turns out, the main conclusions are basically unaffected by these restrictions. Furthermore, we will include a discussion of the accretion/disk connection (Sect. 5.3) and possible influences of binarity on disk evolution (Sect. 5.4).
5.1 Disk dissipation
The main probe for disk dissipation timescales is the disk frequency. In Sect. 3.3 we derive a disk frequency of % for our sample of UpSco brown dwarfs, spectral types , based on the 24 MIPS fluxes. This is consistent with values of % derived previously based on smaller samples in the same region using shorter wavelength data (Jayawardhana et al., 2003a; Bouy et al., 2006a). We can now compare these results with similar studies for more massive stars. Recently, Carpenter et al. (2006) published a Spitzer disk survey for a large sample of stars spanning a wide range in spectral types in UpSco, thus coeval to our targets. For stars with spectral types K0-M5 (corresponding to masses 0.1-1, complementary to our targets), they report a disk frequency of %222We re-calculated the uncertainty based on binomial statistics, to be consistent with the uncertainty estimate derived for our disk frequency. derived from observations at 16 and a very similar value from observations at 8. This is lower than our datapoint for brown dwarfs on a 1.8 confidence level.
Both samples, our brown dwarfs and the stars from Carpenter et al. (2006), are unbiased in the sense that the objects have been selected using criteria independent from their disk properties. The only difficulty when comparing the two studies is the different wavelength used to probe the presence of inner disks. However, all objects for which we see strong excess at 24 do also show significant excess already at IRS wavelengths, i.e. between 8 and 12. In addition, studies at wavelengths between 3 and 8 provide a similar disk frequency (see above). Conversely, the disk fraction derived by Carpenter et al. (2006) does not change significantly when going from 16 to 8. Apparently, the disk fraction is not a strong function of wavelength between 8 and 24, regardless of object mass. Therefore, a comparison between the stellar disk frequency derived from 16 data and the substellar disk frequency obtained from 24 is valid. Moreover, both in the Carpenter et al. and in our sample the value for the disk frequency is fairly robust, because there is a clear gap in mid-infrared emission between objects with and without disks. Thus, this comparison suggests that the disk fraction for 5 Myr old brown dwarfs (spectral types M5) is higher (on a 1.8 confidence level) than for coeval K0-M5 stars.
The disk frequency (and thus the average disk lifetime) in UpSco are therefore a function of stellar mass: As found by Carpenter et al. (2006), disks are less frequently observed around G/F stars compared with K0-M5 stars. Now we find that the disk frequency for objects with spectral types is even higher than for K0-M5. This indicates that the disk lifetime in UpSco, i.e. the age at which only very few objects (%) retain an inner disk, is anti-correlated with the object mass: Myr for G/F stars, but larger than 5 Myr for brown dwarfs.
To verify this result, it is useful to compare with IC348, a cluster with age of Myr, for which disk frequencies have been published recently: Based on IRAC data, Lada et al. (2006) derive disk fractions of % for stars earlier than K6, % for K6-M2 stars, and % for M2-M6 stars. Using a similar method, Luhman et al. (2005b) has previously found a disk frequency of % for the brown dwarfs (spectral types M6) in this cluster. Taken together, these results give evidence for a mass-dependent disk lifetime, however, it may not simply be an increase towards lower masses as in UpSco. In pre-Spitzer studies, it was commonly found that brown dwarf disk lifetimes are not ’vastly different’ (Jayawardhana et al., 2003a) from those of T Tauri stars, i.e. for both object classes the disk frequency drops to values % after 5-10 Myr (Haisch et al., 2001). While this conclusion still holds, Spitzer may now allow us to determine disk lifetimes as a function of mass more accurately. The results from IC348 (Lada et al., 2006; Luhman et al., 2005b) and UpSco (this paper, Carpenter et al., 2006), although not entirely consistent, are first steps in this direction. Future studies in other star forming regions will hopefully help to disentangle the effects of mass, environment, and age on the disk dissipation timescale.
Our data provide useful constraints for the duration of the inner disk clearing process. The brown dwarfs in UpSco clearly fall in two groups: About one third has significant MIR excess, whereas the MIR emission for the remaining objects is completely consistent with photospheric fluxes (see Sect. 3.3). For the latter ones, we find that they either have no disks or disks with a large inner hole having a radius of at least 5-20 AU (see Sect. 4.1). ”Inner hole” in this context means an ”opacity hole”, i.e. the clearing from small ( mm) and thus observable dust grains; this does not necessarily imply that the region is completely devoid of material.
This clear dichotomy and the lack of intermediate objects indicate that the dust clearing in the inner 5 AU of the disks occurs rapidly. Assuming that our objects have an age spread of 2 Myr (see discussion in Sect. 3.1) and are evenly distributed in age, the time scale for this process is shorter than 2 Myr divided by the number of objects in our sample. Thus, a rough upper limit for the timescale of inner dust clearing within 5 AU is years. The rapid clearing process is also supported by the fact that disk frequencies do not strongly vary when derived from observations in different wavelength regimes (i.e. from 3 to 24 , see above).
The consequence is a pronounced scarcity of so-called transition disks, with lack of emission at , but excess at 24 and thus a large hole in the inner disk. A few of these transition disks have been found recently and they are believed to be ’caught in the act’ of inner disk clearing (e.g. Calvet et al., 2002, 2005). From our sample, we can constrain the frequency of transition disks among brown dwarfs in UpSco to be less than 8% (2 confidence limit). Since our wavelength coverage has a gap between 2.5 and 7.5 , this does not include objects with hole radii of AU. Therefore, our result is consistent with transition disk frequencies found for very low mass objects in IC348 (Muzerolle et al., 2006) as well as for stars in young clusters (e.g. Sicilia-Aguilar et al., 2006). Based on the available data, we conclude that inner disk clearing timescales are not vastly different between stars and brown dwarfs.
It should be emphasised that the inner disk clearing timescale is not comparable to the inner disk lifetime. Inner disk clearing appears to be a rapid process, which may be triggered by photoevaporation (Alexander et al., 2006) or formation of giant planets. It interrupts the relatively quiet viscous evolution of the disk, produces large inner opacity holes, and may initiate the transformation of T Tauri like accretion disks to debris disks. From all what we know today, this scenario does probably also apply in the substellar regime.
5.2 Dust settling and grain growth
Our results regarding dust evolution can be summarised as follows: Out of 13 definitive disk detections, 10 have a flat broad-band SED (measured in fluxes, within our uncertainties) from 8 to 24 , and only three show a weak flux increase at 24 . This is best explained by dust settling to the disk midplane, which is usually thought to be accompanied by grain growth. The radiative transfer modeling in Sect. 4.1 confirms this result; for all objects with disk, some degree of dust settling is required to match the observed broad-band SED.
For a model-independent evaluation of the geometric properties of the disks, we calculated the flux ratio for the brown dwarf disks in UpSco (13 objects) and for five brown dwarfs in Taurus, recently investigated in Scholz et al. (2006). This flux ratio is a robust indicator for the flaring in the disk; it is expected to be around or below unity for flat disks and will exceed unity significantly for strongly flared disks (e.g. Wood et al., 2002; Mohanty et al., 2004b). From the observed SEDs, we obtain in UpSco and in Taurus. For three out of five objects in Taurus exceeds the highest value in UpSco. Thus, our sample in UpSco lacks the highly flared disks typical for very young star forming regions, indicating a larger degree of dust settling. This confirms the results from comparing the outcomes of SED models for UpSco and Taurus discussed in Sect. 4.1. Again, it has to be emphasised that while our survey in UpSco is unbiased with respect to the disk properties, the small Taurus sample comprises only the objects with the most massive disks.
While the dust settling can be probed reasonably well with our data, it is more difficult to evaluate the grain properties. For three objects in our sample, we find significant silicate emission features (see Sect. 4.2), indicating the presence of hot, small grains. Following Apai et al. (2005) (see their Fig. 2), we determined parameters for the shape (continuum-subtracted flux ratio ) and strength (peak flux above the continuum) for these three objects, using the continuum derived in Sect. 4.2. We obtain values of 0.5 to 1.5 () for the peak strength and 1.2 to 1.6 () for the shape. These numbers are not strikingly different from what has been found for brown dwarfs in ChaI (Apai et al., 2005). It has to be clarified that Apai et al. (2005) have targeted objects known to be accreting and/or bright in the MIR. Thus, their sample is biased towards objects with strong MIR emission. Therefore, we basically compare the objects with the strongest silicate features in UpSco and ChaI, and their dust properties (based on shape and strength of the emission feature) appear to be rather similar. This is based on small samples and should therefore be substantiated as soon as more data is available. To take into account the large number of objects without measurable silicate feature in UpSco, it would be particularly interesting to compare with a complete, unbiased brown dwarf IRS survey in a younger region like ChaI or Taurus, which is not available yet.
Neither the large-scale SED nor the silicate feature allow us to put much constraint on the coagulation of grains and their sizes. There are, however, two indirect arguments for the occurence of grain growth in UpSco disks: a) the evidence for dust settling, which is usually thought to happen as the grains coagulate and decouple from the gas, and b) the absence of strong silicate emission in the majority of the UpSco disks and thus the lack of hot, small dust grains. Based on these indirect arguments, the occurrence of grain growth is ubiquitous in our sample.
The general picture of the dust evolution in brown dwarf disks by dust settling and grain growth is consistent with recent findings for stars. All these processes are now routinely observed with Spitzer in T Tauri disks (e.g. Megeath et al., 2005; Furlan et al., 2005; Bouwman et al., 2005; Forrest et al., 2004). It is not clear yet, however, to what extent the dust evolution is a function of object mass. This can now be probed in UpSco by comparing the broad-band SEDs of stars and brown dwarfs. In Fig. 1, we overplot the typical flux levels for K0-M5 stars with and without disks at 8 and 16 as solid and dashed lines (taken from Carpenter et al. (2006)). Although the wavelength coverage for stars and brown dwarfs is not identical, hampering a reliable comparison, it is clear that the mid-infrared fluxes of the brown dwarfs with disks clearly fall in the range defined by the sample of stars. The spread in the mid-infrared SEDs appears to be smaller in the brown dwarf regime by 0.5-1 order of magnitude, maybe indicating a more uniform evolutionary timeline for very low mass objects. But there is no clear evidence that the typical slope in the SED and thus the efficiency of the dust settling process in the inner disk is a strong function of mass. This is contrary to the results of Lada et al. (2006) in the somewhat younger cluster IC348, where a larger degree of dust settling is seen for late M-type objects. To what extent this discrepancy is a result of age effects or environmental differences has to be clarified in future work.
5.3 Accretion signature from H emission
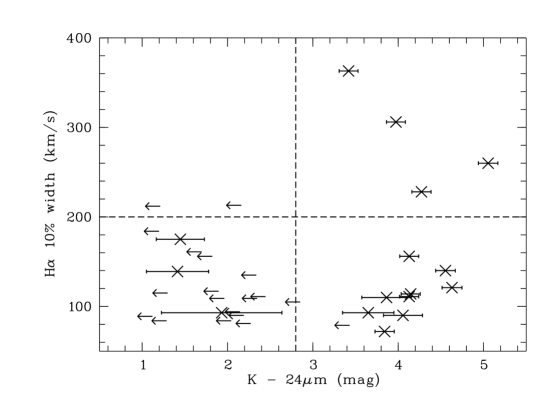
We have compiled H 10% width measurements for our targets from our own spectra and the literature (see Table 1). This is the largest sample of brown dwarfs for which both MIR SEDs and H measurements are available. H emission is a useful indicator of disk accretion, and particulary the 10% width has been found to be correlated with the accretion rate (Natta et al., 2004). Typically, a 10% width of kms-1 corresponds to accretion rates of /year. A value of 200-270 kms-1 is usually adopted as a threshold between accretors and non-accretors, corresponding to accretion rates below /year (White & Basri, 2003; Jayawardhana et al., 2003b; Mohanty et al., 2005). It is important to emphasise that this is mostly an empirical limit and in rare cases even a non-accretor might exceed the threshold because of fast rotation or strong magnetic activity.
To probe the connection between disks and accretion, we plot the H 10% widths vs. the colour already used in Sect. 3.3 (see Fig. 7). The four quadrants in this figure correspond to the expected positions for objects without disks and without accretion (lower left), with disks but without accretion (lower right), with disks and accretion (upper right), and without disks but with accretion (upper left). The left half of this figure is easy to understand: There are no objects without mid-infrared excess and H 10% width clearly exceeding the 200 kms-1 limit. Thus, when an object has lost the disk or developed a inner opacity hole of at least 5 AU, the accretion also drops to unmeasurable rates. Thus, once the inner 5 AU of the disk is devoid of dust, the accretion rate drops below /year.
The right half of Fig. 7 is more puzzling. Surprisingly, only four out of 13 objects with clear evidence for the presence of an inner dust disk show a spectroscopic signature of accretion. The remaining nine sources with inner disks are located well below the threshold between accretors and non-accretors, so their accretion rates are probably significantly lower than /year. Thus, although a dusty disk is still present in the inner 5 AU around these objects, accretion has ceased or at least reduced to a trickle. This confirms previous claims by Jayawardhana et al. (2003a) and Bouy et al. (2006a) based on NIR/MIR observations of smaller samples.
It is not clear to what extent the lack of accretion in these nine objects with disk is an indication for depletion of gas in the disk, particularly because two of these nine have the most flared disks in our sample. Flaring requires the presence of small grains (see Sect. 3.2 and Sect. 4.1), and it is usually believed that due to dust/gas coupling small dust grains are a good tracer for the presence of gas (e.g. Haisch et al., 2001). Thus, although accretion is not detectable in these seven objects, there is presumably still a (small?) amount of gas in their disks.
A plausible explanation for the lacking disk/accretion connection might be variable accretion. Spectroscopic signatures of accretion are known to be variable in accreting objects (Johns & Basri, 1995; Alencar & Batalha, 2002; Bouvier et al., 2003, e.g.). Specifically for young brown dwarfs, we found recently that accretion rate changes by 0.5-1 order of magnitude and episodic phases of accretion and quiescence are not unusual (Scholz et al., 2005; Scholz & Jayawardhana, 2006). Assuming that the phases of quiescence are dominant in the latest stages of accretion, maybe due to the onset of inner disk clearing, it might be that most objects with disks are observed in an epoch of low (and thus unmeasurable) accretion level, although they still have an inner disk. Multi-epoch spectra are required to constrain the degree of accretion variation in these objects. In summary, based on our large sample we find that the inner disks of brown dwarfs can persist longer than measurable rates of continuous accretion.
5.4 Binarity and disk evolution
Large parts of our sample have been observed with high spatial resolution, either with HST or with AO imaging using NACO at VLT (Bouy et al., 2006b; Kraus et al., 2005). The main goal of these surveys was to search for companions around young brown dwarfs; the observations are typically sensitive to substellar companions for separations between 5-10 AU and several hundred AU. The results are summarised in Table 1: Out of 29 objects that have been covered, 6 have been found to have a companion in the given separation range. These companions are unresolved in our Spitzer images and spectra. In the following, all separations are given as projected values, assuming a distance of 145 pc for UpSco. Strictly speaking, these values should be considered to be lower limits to the physical separation.
Two of the objects with companions in our sample, usco66 and usco109, do not show any MIR excess, i.e. they have either lost their disk or the disk has a large inner hole. These are also the two objects with the smallest separations between the two binary components, 10 and 5 AU, respectively. The four remaining binary brown dwarfs (usco55, usd160958, usd161833, usd161939) in the sample, with separations ranging from 12 AU to 130 AU, show clear signs for a dusty disk.
The existence of companions inside 10 AU for objects without MIR excess is in line with the idea that these objects have either lost their disk or harbour a disk with a large inner hole, which would then be circumbinary. For the objects with inner disk and companion the situation is more complex. The presence of a companion is usually thought to truncate the individual disks of the components due to tidal forces, leaving two objects with small disks plus potentially an outer circumbinary disk (see Artymowicz & Lubow, 1994), which however would be undetectable with our MIR data. For solar-mass binaries with mass ratios close to one, the tidal truncation radius is between 0.3 and 0.4 times the (physical) separation (Armitage et al., 1999). For the closest binaries with disk – usd160958, usco55, and usd161939 – this might imply outer disk radii as low as 5-10 AU (assuming that projected separation is comparable to the physical separation). This scenario of disk truncation due to close companions is not inconsistent with our MIR SEDs: As we have shown in Sect. 4.1 for the case of usd160958 (which has a 12 AU companion), it is possible to have a small disk within the truncation radius that gives enough dust emission to explain the measured flux levels in the MIR (see Fig. 3, 7th panel). Thus, it appears plausible that these three objects feature small disks and companions.
All three objects with increasing flux levels in the MIR (and thus flaring) have a companion, at projected separations of 18, 26, and 130 AU, as already pointed out in Sect. 3.2. At face value, this might be a hint for enhanced flaring in the inner disk due to a companion, e.g. by increased disk heating or turbulence. The literature, however, does not provide support for this scenario: Large-scale studies for T Tauri stars carried out by Furlan et al. (2006) and McCabe et al. (2006) find no correlation of MIR properties and the presence of companions. Thus, our finding of three objects with flared disks and companions might well be result of coincidence and should be treated with caution.
6 Summary
We have carried out a Spitzer survey of 35 brown dwarfs in the Upper Scorpius star forming region with an age of Myr. Combined with literature data from spectroscopy and high-resolution imaging, the brown dwarfs in UpSco now comprise a large sample of substellar objects, for which information about disks, accretion, and multiplicity is available. In the following, we list our most important results:
-
1.
Out of 35 objects, 13 show clear excess emission at 24, indicating emission from a dusty circum-sub-stellar disk. This corresponds to a disk frequency of %. The disk frequency is on a 1.8 confidence level higher in our sample than for K0-M5 stars in the same region (% Carpenter et al., 2006), suggesting a mass-dependency in the disk lifetime.
-
2.
The objects without emission either do not have a disk or they harbour a disk with large inner holes (radii AU). The clear distinction between objects with/without disks and the lack of objects in transition between the two subsamples is a clear sign of rapid inner disk clearing, probably on timescales of years.
-
3.
The midinfrared SEDs of the disks appear uniform: Most of them are flat between 8 and 24 with flux levels of a few mJy. Only three objects show slighly enhanced flux levels at 24, indicative of flaring. Hydrostatic disk models where dust and gas are well-mixed are not able to fit the data. However, assuming a two component dust composition where large grains have smaller scaleheights than ISM-like small grains provides good agreement between model and observations. This is well-explained with a scenario in which grain growth leads to larger grains that settle to the disk midplane.
-
4.
In most disks, there is no clear indication for dust emission features around 10, arguing for a lack of hot, small grains. This confirms that the disks are affected by dust settling and grain growth.
-
5.
Brown dwarf disks in UpSco (5 Myr) show a larger degree of dust settling than in the younger Taurus star forming region. In UpSco itself, we do not see a significant difference between stars and brown dwarfs in the broad-band SEDs, indicating that dust settling is not a strong function of object mass.
-
6.
Taken together, our survey finds disks at an advanced stage: A large fraction of the objects have already cleared out inner parts of the disk. Evolutionary processes like dust settling and grain growth are ubiquitous in brown dwarf disks at 5 Myr. Since these processes are prerequisites for the formation of larger bodies in the disk, our results suggest possible planetesimal growth and planet formation in brown dwarf disks.
-
7.
Out of 13 objects with disks, only four appear to accrete at more than /year. Thus, dusty disks can persist although continuous accretion has stopped or at least reduced to unmeasurable levels.
-
8.
Four objects with disks also have a companion; in three cases the (projected) separations are smaller than 30 AU. This can be explained with the existence of a small disk (radius 5-10 AU) around the primary, truncated by the companion.
References
- Alencar & Batalha (2002) Alencar, S. H. P., & Batalha, C. 2002, ApJ, 571, 378
- Alexander et al. (2006) Alexander, R. D., Clarke, C. J., & Pringle, J. E. 2006, MNRAS, 369, 229
- Allard et al. (2001) Allard, F., Hauschildt, P. H., Alexander, D. R., Tamanai, A., & Schweitzer, A. 2001, ApJ, 556, 357
- Apai et al. (2005) Apai, D., Pascucci, I., Bouwman, J., Natta, A., Henning, T., & Dullemond, C. P. 2005, Science, 310, 834
- Apai et al. (2002) Apai, D., Pascucci, I., Henning, T., Sterzik, M. F., Klein, R., Semenov, D., Günther, E., & Stecklum, B. 2002, ApJ, 573, L115
- Apai et al. (2004) Apai, D., Pascucci, I., Sterzik, M. F., van der Bliek, N., Bouwman, J., Dullemond, C. P., & Henning, T. 2004, A&A, 426, L53
- Ardila et al. (2000) Ardila, D., Martín, E., & Basri, G. 2000, AJ, 120, 479
- Armitage et al. (1999) Armitage, P. J., Clarke, C. J., & Tout, C. A. 1999, MNRAS, 304, 425
- Artymowicz & Lubow (1994) Artymowicz, P., & Lubow, S. H. 1994, ApJ, 421, 651
- Baraffe et al. (1998) Baraffe, I., Chabrier, G., Allard, F., & Hauschildt, P. H. 1998, A&A, 337, 403
- Baraffe et al. (2002) —. 2002, A&A, 382, 563
- Baraffe et al. (2003) Baraffe, I., Chabrier, G., Barman, T. S., Allard, F., & Hauschildt, P. H. 2003, A&A, 402, 701
- Beckwith et al. (1976) Beckwith, S., Evans, II, N. J., Becklin, E. E., & Neugebauer, G. 1976, ApJ, 208, 390
- Bouvier et al. (2003) Bouvier, J., Grankin, K. N., Alencar, S. H. P., Dougados, C., Fernández, M., Basri, G., Batalha, C., Guenther, E., Ibrahimov, M. A., Magakian, T. Y., Melnikov, S. Y., Petrov, P. P., Rud, M. V., & Zapatero Osorio, M. R. 2003, A&A, 409, 169
- Bouwman et al. (2005) Bouwman, J., Lawson, W., Feigelson, E. D., Henning, T., Tielens, A. G. G. M., Waters, L. B. F. M., & Dominik, C. 2005, in Protostars and Planets V, 8565
- Bouwman et al. (2001) Bouwman, J., Meeus, G., de Koter, A., Hony, S., Dominik, C., & Waters, L. B. F. M. 2001, A&A, 375, 950
- Bouy et al. (2006a) Bouy, H., Huelamo, N., Martin, E. L., Barrado y Navascues, D., Sterzik, M., & Pantin, E. 2006a, ArXiv Astrophysics e-prints
- Bouy et al. (2006b) Bouy, H., Martín, E. L., Brandner, W., Zapatero-Osorio, M. R., Béjar, V. J. S., Schirmer, M., Huélamo, N., & Ghez, A. M. 2006b, A&A, 451, 177
- Calvet et al. (2002) Calvet, N., D’Alessio, P., Hartmann, L., Wilner, D., Walsh, A., & Sitko, M. 2002, ApJ, 568, 1008
- Calvet et al. (2005) Calvet, N., D’Alessio, P., Watson, D. M., Franco-Hernández, R., Furlan, E., Green, J., Sutter, P. M., Forrest, W. J., Hartmann, L., Uchida, K. I., Keller, L. D., Sargent, B., Najita, J., Herter, T. L., Barry, D. J., & Hall, P. 2005, ApJ, 630, L185
- Carpenter (2001) Carpenter, J. M. 2001, AJ, 121, 2851
- Carpenter et al. (2006) Carpenter, J. M., Mamajek, E. E., Hillenbrand, L. A., & Meyer, M. R. 2006, ApJ, 651, L49
- Comerón et al. (2000) Comerón, F., Neuhäuser, R., & Kaas, A. A. 2000, A&A, 359, 269
- de Geus et al. (1989) de Geus, E. J., de Zeeuw, P. T., & Lub, J. 1989, A&A, 216, 44
- de Zeeuw et al. (1999) de Zeeuw, P. T., Hoogerwerf, R., de Bruijne, J. H. J., Brown, A. G. A., & Blaauw, A. 1999, AJ, 117, 354
- Dullemond & Dominik (2004) Dullemond, C. P., & Dominik, C. 2004, A&A, 421, 1075
- Duschl et al. (1996) Duschl, W. J., Gail, H.-P., & Tscharnuter, W. M. 1996, A&A, 312, 624
- Forrest et al. (2004) Forrest, W. J., Sargent, B., Furlan, E., D’Alessio, P., Calvet, N., Hartmann, L., Uchida, K. I., Green, J. D., Watson, D. M., Chen, C. H., Kemper, F., Keller, L. D., Sloan, G. C., Herter, T. L., Brandl, B. R., Houck, J. R., Barry, D. J., Hall, P., Morris, P. W., Najita, J., & Myers, P. C. 2004, ApJS, 154, 443
- Furlan et al. (2005) Furlan, E., Calvet, N., D’Alessio, P., Hartmann, L., Forrest, W. J., Watson, D. M., Uchida, K. I., Sargent, B., Green, J. D., & Herter, T. L. 2005, ApJ, 628, L65
- Furlan et al. (2006) Furlan, E., Hartmann, L., Calvet, N., D’Alessio, P., Franco-Hernández, R., Forrest, W. J., Watson, D. M., Uchida, K. I., Sargent, B., Green, J. D., Keller, L. D., & Herter, T. L. 2006, ApJS, 165, 568
- Haisch et al. (2001) Haisch, K. E., Lada, E. A., & Lada, C. J. 2001, ApJ, 553, L153
- Hauschildt et al. (1999) Hauschildt, P. H., Allard, F., & Baron, E. 1999, ApJ, 512, 377
- Jayawardhana et al. (2003a) Jayawardhana, R., Ardila, D. R., Stelzer, B., & Haisch, K. E. 2003a, AJ, 126, 1515
- Jayawardhana et al. (2002) Jayawardhana, R., Mohanty, S., & Basri, G. 2002, ApJ, 578, L141
- Jayawardhana et al. (2003b) —. 2003b, ApJ, 592, 282
- Johns & Basri (1995) Johns, C. M., & Basri, G. 1995, AJ, 109, 2800
- Kenyon & Hartmann (1987) Kenyon, S. J., & Hartmann, L. 1987, ApJ, 323, 714
- Kim et al. (1994) Kim, S.-H., Martin, P. G., & Hendry, P. D. 1994, ApJ, 422, 164
- Klein et al. (2003) Klein, R., Apai, D., Pascucci, I., Henning, T., & Waters, L. B. F. M. 2003, ApJ, 593, L57
- Kraus et al. (2005) Kraus, A. L., White, R. J., & Hillenbrand, L. A. 2005, ApJ, 633, 452
- Lada & Adams (1992) Lada, C. J., & Adams, F. C. 1992, ApJ, 393, 278
- Lada et al. (2006) Lada, C. J., Muench, A. A., Luhman, K. L., Allen, L., Hartmann, L., Megeath, T., Myers, P., Fazio, G., Wood, K., Muzerolle, J., Rieke, G., Siegler, N., & Young, E. 2006, AJ, 131, 1574
- Luhman (2005) Luhman, K. L. 2005, ApJ, 633, L41
- Luhman et al. (2005a) Luhman, K. L., Adame, L., D’Alessio, P., Calvet, N., Hartmann, L., Megeath, S. T., & Fazio, G. G. 2005a, ApJ, 635, L93
- Luhman et al. (2005b) Luhman, K. L., Lada, C. J., Hartmann, L., Muench, A. A., Megeath, S. T., Allen, L. E., Myers, P. C., Muzerolle, J., Young, E., & Fazio, G. G. 2005b, ApJ, 631, L69
- Luhman et al. (2003) Luhman, K. L., Stauffer, J. R., Muench, A. A., Rieke, G. H., Lada, E. A., Bouvier, J., & Lada, C. J. 2003, ApJ, 593, 1093
- Martín et al. (2004) Martín, E. L., Delfosse, X., & Guieu, S. 2004, AJ, 127, 449
- McCabe et al. (2006) McCabe, C., Ghez, A. M., Prato, L., Duchêne, G., Fisher, R. S., & Telesco, C. 2006, ApJ, 636, 932
- Meeus et al. (2003) Meeus, G., Sterzik, M., Bouwman, J., & Natta, A. 2003, A&A, 409, L25
- Megeath et al. (2005) Megeath, S. T., Hartmann, L., Luhman, K. L., & Fazio, G. G. 2005, ApJ, 634, L113
- Mohanty et al. (2004a) Mohanty, S., Basri, G., Jayawardhana, R., Allard, F., Hauschildt, P., & Ardila, D. 2004a, ApJ, 609, 854
- Mohanty et al. (2005) Mohanty, S., Jayawardhana, R., & Basri, G. 2005, ApJ, 626, 498
- Mohanty et al. (2004b) Mohanty, S., Jayawardhana, R., Natta, A., Fujiyoshi, T., Tamura, M., & Barrado y Navascués, D. 2004b, ApJ, 609, L33
- Muench et al. (2001) Muench, A. A., Alves, J., Lada, C. J., & Lada, E. A. 2001, ApJ, 558, L51
- Muzerolle et al. (2006) Muzerolle, J., Adame, L., D’Alessio, P., Calvet, N., Luhman, K. L., Muench, A. A., Lada, C. J., Rieke, G. H., Siegler, N., Trilling, D. E., Young, E. T., Allen, L., Hartmann, L., & Megeath, S. T. 2006, ApJ, 643, 1003
- Muzerolle et al. (2005) Muzerolle, J., Luhman, K. L., Briceño, C., Hartmann, L., & Calvet, N. 2005, ApJ, 625, 906
- Natta et al. (2002) Natta, A., Testi, L., Comerón, F., Oliva, E., D’Antona, F., Baffa, C., Comoretto, G., & Gennari, S. 2002, A&A, 393, 597
- Natta et al. (2004) Natta, A., Testi, L., Muzerolle, J., Randich, S., Comerón, F., & Persi, P. 2004, A&A, 424, 603
- Preibisch et al. (2002) Preibisch, T., Brown, A. G. A., Bridges, T., Guenther, E., & Zinnecker, H. 2002, AJ, 124, 404
- Preibisch & Zinnecker (1999) Preibisch, T., & Zinnecker, H. 1999, AJ, 117, 2381
- Riaz et al. (2006) Riaz, B., Gizis, J. E., & Hmiel, A. 2006, ApJ, 639, L79
- Sartori et al. (2003) Sartori, M. J., Lépine, J. R. D., & Dias, W. S. 2003, A&A, 404, 913
- Scholz & Eislöffel (2005) Scholz, A., & Eislöffel, J. 2005, A&A, 429, 1007
- Scholz & Jayawardhana (2006) Scholz, A., & Jayawardhana, R. 2006, ApJ, 638, 1056
- Scholz et al. (2005) Scholz, A., Jayawardhana, R., & Brandeker, A. 2005, ApJ, 629, L41
- Scholz et al. (2006) Scholz, A., Jayawardhana, R., & Wood, K. 2006, ApJ, 645, 1498
- Sicilia-Aguilar et al. (2006) Sicilia-Aguilar, A., Hartmann, L., Calvet, N., Megeath, S. T., Muzerolle, J., Allen, L., D’Alessio, P., Merín, B., Stauffer, J., Young, E., & Lada, C. 2006, ApJ, 638, 897
- Slesnick et al. (2006) Slesnick, C., Carpenter, J., & Hillenbrand, L. 2006, ArXiv Astrophysics e-prints
- Sterzik et al. (2004) Sterzik, M. F., Pascucci, I., Apai, D., van der Bliek, N., & Dullemond, C. P. 2004, A&A, 427, 245
- van Boekel et al. (2005) van Boekel, R., Min, M., Waters, L. B. F. M., de Koter, A., Dominik, C., van den Ancker, M. E., & Bouwman, J. 2005, A&A, 437, 189
- Walker et al. (2004) Walker, C., Wood, K., Lada, C. J., Robitaille, T., Bjorkman, J. E., & Whitney, B. 2004, MNRAS, 351, 607
- White & Basri (2003) White, R. J., & Basri, G. 2003, ApJ, 582, 1109
- Whitworth et al. (2006) Whitworth, A., Bate, M. R., Nordlund, A., Reipurth, B., & Zinnecker, H. 2006, ArXiv Astrophysics e-prints
- Wood et al. (2002) Wood, K., Lada, C. J., Bjorkman, J. E., Kenyon, S. J., Whitney, B., & Wolff, M. J. 2002, ApJ, 567, 1183
| Name | (J2000) | (J2000) | SpT | H 10% | Bin.ddBinarity: If a companion has been found, the projected separation in AU is given, assuming a distance of 145 pc. A ’S’ (’single’) indicates that the object does not have a companion at separations AU. Objects with ’NaN’ have not been observed yet with high spatial resolution (see Bouy et al., 2006b; Kraus et al., 2005). | F(9) | F(10) | F(11) | IRS err. | F(24)aaUpper limits are based on 2 flux upper limits. Errors correspond to 1 flux uncertainties. | |
|---|---|---|---|---|---|---|---|---|---|---|---|
| (K) | (kms-1) | (mJy) | (mJy) | (mJy) | (mJy) | (mJy) | |||||
| usco53 | 16 00 26.3 | -22 59 40.4 | M5 | 3100 | 175ccFrom Jayawardhana et al. (2002) and Mohanty et al. (2005). | NaN | 2.36 | 2.03 | 1.73 | 0.28 | |
| usco55 | 16 02 45.6 | -23 04 49.8 | M5.5 | 3050 | 114ccFrom Jayawardhana et al. (2002) and Mohanty et al. (2005). | 18 | 6.40 | 6.49 | 6.43 | 0.29 | bbSafe disk detections according to the analysis in Sect. 3.3. |
| usco66 | 16 01 49.7 | -23 51 07.4 | M6 | 3000 | 115ccFrom Jayawardhana et al. (2002) and Mohanty et al. (2005). | 10 | 1.33 | 1.38 | 0.80 | 0.27 | |
| usco67 | 15 59 25.9 | -23 05 08.1 | M5.5 | 3050 | 139ccFrom Jayawardhana et al. (2002) and Mohanty et al. (2005). | S | 1.69 | 1.49 | 1.16 | 0.24 | |
| usco75 | 16 00 30.2 | -23 34 44.7 | M6 | 3000 | 212ccFrom Jayawardhana et al. (2002) and Mohanty et al. (2005). | S | 1.10 | 0.92 | 0.75 | 0.20 | |
| usco100 | 16 02 04.1 | -20 50 41.5 | M7 | 2850 | 184ccFrom Jayawardhana et al. (2002) and Mohanty et al. (2005). | S | 0.98 | 0.93 | 0.83 | 0.29 | |
| usco104 | 15 57 12.7 | -23 43 45.3 | M5 | 3100 | 109ccFrom Jayawardhana et al. (2002) and Mohanty et al. (2005). | NaN | 0.64 | 0.58 | 0.49 | 0.17 | |
| usco109 | 16 01 19.1 | -23 06 38.6 | M6 | 3000 | 84ccFrom Jayawardhana et al. (2002) and Mohanty et al. (2005). | 5 | 0.71 | 0.64 | 0.46 | 0.33 | |
| usco112 | 16 00 26.6 | -20 56 32.0 | M5.5 | 3050 | 111ccFrom Jayawardhana et al. (2002) and Mohanty et al. (2005). | S | 2.85 | 3.11 | 3.01 | 0.13 | bbSafe disk detections according to the analysis in Sect. 3.3. |
| usco128 | 15 59 11.2 | -23 37 59.0 | M7 | 2850 | 121ccFrom Jayawardhana et al. (2002) and Mohanty et al. (2005). | S | 2.11 | 2.20 | 2.23 | 0.18 | bbSafe disk detections according to the analysis in Sect. 3.3. |
| usco130 | 15 59 43.6 | -20 14 38.1 | M7 | 2850 | 111ccFrom Jayawardhana et al. (2002) and Mohanty et al. (2005). | S | 0.64 | 0.44 | 0.41 | 0.13 | eeAlso called usd160019, see Martín et al. (2004). |
| usco131 | 16 00 19.5 | -22 56 28.9 | M6.5 | 2900 | 105ccFrom Jayawardhana et al. (2002) and Mohanty et al. (2005). | S | 0.29 | 0.43 | 0.37 | 0.24 | |
| usd155556 | 15 55 56.0 | -20 45 18.5 | M6.5 | 2900 | 140 | S | 5.19 | 4.82 | 4.90 | 0.24 | bbSafe disk detections according to the analysis in Sect. 3.3. |
| usd155601 | 15 56 01.0 | -23 38 08.1 | M6.5 | 2900 | 109 | S | 2.98 | 2.74 | 2.68 | 0.21 | bbSafe disk detections according to the analysis in Sect. 3.3. |
| usd155605 | 15 56 05.0 | -21 06 46.4 | M7 | 2850 | 156 | S | 0.48 | 0.51 | 0.38 | 0.29 | |
| usd160440 | 16 04 40.8 | -19 36 52.8 | M6.5 | 2900 | 117 | S | 0.64 | 0.56 | 0.64 | 0.22 | |
| usd160455 | 16 04 55.8 | -23 07 43.8 | M6.5 | 2900 | 213 | S | 0.86 | 0.73 | 0.22 | 0.26 | |
| usd160514 | 16 05 14.0 | -24 06 52.6 | M6 | 3000 | 84 | S | 1.36 | 1.29 | 0.93 | 0.22 | |
| usd160603 | 16 06 03.9 | -20 56 44.6 | M7.5 | 2650 | 306ccFrom Jayawardhana et al. (2002) and Mohanty et al. (2005). | S | 3.41 | 3.49 | 3.60 | 0.18 | bbSafe disk detections according to the analysis in Sect. 3.3. |
| usd160951 | 16 09 51.1 | -27 22 42.2 | M6 | 3000 | 156 | S | 1.14 | 1.08 | 0.68 | 0.29 | |
| usd160958 | 16 09 58.5 | -23 45 18.6 | M6.5 | 2900 | 363 | 12 | 4.32 | 4.23 | 4.03 | 0.24 | bbSafe disk detections according to the analysis in Sect. 3.3. |
| usd161005 | 16 10 05.4 | -19 19 36.0 | M7 | 2850 | 228 | S | 2.81 | 2.23 | 1.99 | 0.51 | bbSafe disk detections according to the analysis in Sect. 3.3. |
| usd161006 | 16 10 06.0 | -21 27 44.6 | M8.5 | 2500 | 110ccFrom Jayawardhana et al. (2002) and Mohanty et al. (2005). | NaN | 0.91 | 1.52 | 1.62 | 0.54 | bbSafe disk detections according to the analysis in Sect. 3.3. |
| usd161007 | 16 10 07.5 | -18 10 56.4 | M6 | 3000 | 89 | S | 2.27 | 1.79 | 1.01 | 0.60 | |
| usd161103 | 16 11 03.6 | -24 26 42.9 | M9 | 2400 | 90ccFrom Jayawardhana et al. (2002) and Mohanty et al. (2005). | NaN | 1.61 | 1.61 | 1.31 | 0.34 | bbSafe disk detections according to the analysis in Sect. 3.3. |
| usd161452 | 16 14 52.6 | -20 17 13.2 | M9 | 2400 | 79ccFrom Jayawardhana et al. (2002) and Mohanty et al. (2005). | NaN | 0.15 | 0.15 | -0.02 | 0.11 | |
| usd161632 | 16 16 32.2 | -22 05 20.2 | M6 | 3000 | 93 | S | 1.83 | 1.68 | 0.95 | 0.52 | |
| usd161833 | 16 18 33.2 | -25 17 50.4 | M6 | 3000 | 72 | 130 | 5.35 | 4.37 | 4.16 | 0.33 | bbSafe disk detections according to the analysis in Sect. 3.3. |
| usd161840 | 16 18 40.8 | -22 09 48.1 | M7 | 2850 | 90 | S | 0.70 | 0.29 | 0.51 | 0.51 | |
| usd161903 | 16 19 03.4 | -23 44 08.8 | M6.5 | 2900 | 94 | S | 0.76 | 0.86 | 0.78 | 0.28 | |
| usd161916 | 16 19 16.5 | -23 47 22.9 | M8 | 2600 | 93ccFrom Jayawardhana et al. (2002) and Mohanty et al. (2005). | NaN | 1.06 | 0.88 | 0.65 | 0.45 | 0.5-1bbSafe disk detections according to the analysis in Sect. 3.3. |
| usd161926 | 16 19 26.4 | -24 12 44.5 | M6 | 3000 | 161 | S | 0.80 | 0.84 | 0.16 | 0.27 | |
| usd161929 | 16 19 29.9 | -24 40 47.1 | M8 | 2600 | 135ccFrom Jayawardhana et al. (2002) and Mohanty et al. (2005). | S | 0.49 | 0.92 | 0.41 | 0.29 | |
| usd161939 | 16 19 39.8 | -21 45 35.1 | M7 | 2750 | 260 | 26 | 7.60 | 8.53 | 8.78 | 0.52 | bbSafe disk detections according to the analysis in Sect. 3.3. |
| usd162041 | 16 20 41.5 | -24 25 49.0 | M7.5 | 2650 | 81ccFrom Jayawardhana et al. (2002) and Mohanty et al. (2005). | S | 0.55 | 0.49 | 0.44 | 0.41 |
| Full name | |||||||||
|---|---|---|---|---|---|---|---|---|---|
| (K) | () | () | (AU) | () | () | ||||
| usco55 | 2800 | 0.65 | 0.26 | 100 | 0.015 | … | 0.0 | 1.15 | |
| usco112 | 2850 | 0.40 | 0.10 | 100 | 0.01 | 0.02 | 0.03 | 1.1 | |
| usco128 | 2600 | 0.30 | 0.01 | 100 | 0.0375 | … | 0.0 | 1.1 | |
| usd155556 | 2900 | 0.40 | 0.075 | 100 | 0.06 | … | 0.0 | 1.0 | |
| usd155601 | 2900 | 0.35 | 0.075 | 100 | 0.03 | … | 0.0 | 1.1 | |
| usd160603 | 2900 | 0.35 | 0.03 | 100 | 0.05 | … | 0.0 | 1.0 | |
| usd160958 | 2900 | 0.55 | 0.075 | 100 | 0.01 | … | 0.0 | 1.1 | |
| 2900 | 0.55 | 0.075 | 5 | 0.007 | … | 0.0 | 1.1 | ||
| usd161005 | 2850 | 0.33 | 0.04 | 100 | 0.025 | 0.03 | 0.03 | 1.1 | |
| usd161006 | 2500 | 0.26 | 0.02 | 100 | 0.05 | 0.06 | 0.03 | 1.0 | |
| usd161103 | 2500 | 0.26 | 0.02 | 100 | 0.05 | 0.06 | 0.03 | 1.0 | |
| usd161833 | 3000 | 0.65 | 0.10 | 100 | 0.0055 | … | 0.0 | 1.2 | |
| usd161916 | 2600 | 0.25 | 0.03 | 100 | 0.015 | 0.025 | 0.03 | 1.1 | |
| usd161939 | 2750 | 0.50 | 0.04 | 100 | 0.03 | 0.04 | 0.03 | 1.15 |