33email: dteyssier@sciops.esa.int
Deuterium fractionation in the Horsehead edge††thanks: Based on observations obtained with the IRAM Plateau de Bure interferometer and 30 m telescope. IRAM is supported by INSU/CNRS (France), MPG (Germany), and IGN (Spain).
Abstract
Context. Deuterium fractionation is known to enhance the [DCO+]/[HCO+] abundance ratio over the D/H10-5 elemental ratio in the cold and dense gas typically found in pre-stellar cores.
Aims. We report the first detection and mapping of very bright DCO+ =3–2 and =2–1 lines (3 and 4 respectively) towards the Horsehead photodissociation region (PDR) observed with the IRAM-30m telescope. The DCO+ emission peaks close to the illuminated warm edge of the nebula ( or away).
Methods. Detailed nonlocal, non–LTE excitation and radiative transfer analyses have been used to determine the prevailing physical conditions and to estimate the DCO+ and H13CO+ abundances from their line intensities.
Results. A large [DCO+]/[HCO+] abundance ratio is inferred at the DCO+ emission peak, a condensation shielded from the illuminating far-UV radiation field where the gas must be cold (10–20) and dense (). DCO+ is not detected in the warmer photodissociation front, implying a lower [DCO+]/[HCO+] ratio ().
Conclusions. According to our gas phase chemical predictions, such a high deuterium fractionation of HCO+ can only be explained if the gas temperature is below 20, in good agreement with DCO+ excitation calculations.
Key Words.:
ISM clouds – molecules – individual object (Horsehead nebula) – radio lines: ISMMolecules are enriched in deuterium over the elemental D/H abundance (, Linsky et al. 2006) in many different astrophysical environments. These include cold, dense cores (Guelin et al. 1982), mid–planes of circumstellar disks (van Dishoeck et al. 2003; Guilloteau et al. 2006), hot molecular cores (Hatchell et al. 1998), and even PDRs (Leurini et al. 2006). Multiply deuterated species were first detected several years ago, e.g. D2CO in warm gas (Turner 1990) and NHD2 in cold gas (Roueff et al. 2000). Solomon & Woolf (1973) and Watson (1974) first proposed that deuterium fractionation is mostly caused by gas-phase ion–molecule reactions. Smith et al. (1982) and Roberts & Millar (2000a) confirmed that the deuteration of H at low temperatures () and of CH at higher temperatures (up to ) are important precursor reactions in the subsequent deuteration of other species. Roberts & Millar (2000b), Walmsley et al. (2004) and Flower et al. (2006) succeeded in reproducing the amount of several multiply deuterated molecules in cold gas by adding to pure gas-phase chemistry the accretion (freeze-out) of gas-phase molecules onto the surfaces of dust grains. Finally the observed deuterium fractionation in hot cores is thought to result from the liberation of deuterated molecules, trapped in ice mantles in the prestellar phase.
Although it has been studied thoroughly for 30 years, deuterium chemistry is not yet fully understood. With many chemical and physical processes competing for efficient fractionation, models are easier to compare with observations for sources with well described physical conditions. In this letter, we report the detection of very bright DCO+ lines in the Horsehead edge. In particular, the mane of the Horsehead nebula is a PDR viewed nearly edge-on (inclination ) illuminated by the O9.5V star Ori (Abergel et al. 2003; Philipp et al. 2006). Habart et al. (2005) showed that the PDR has a very steep gradient, rising to in less than or 0.02, at a roughly constant thermal pressure of . The newly detected DCO+ lines arise from a condensation adjacent to the PDR, first detected by Hily-Blant et al. (2005). According to its submillimeter continuum emission, this core (B33-SMM1) is long and has an average H2 density of and a peak density of (Ward-Thompson et al. 2006).
| Molecule | Transition | Frequency | Instrument | # Pix.a | a | a | Resol. | Resol. | Int. Timea,b | Noisec | Obs. datea |
| GHz | arcsec | hours | K | ||||||||
| H13CO+ | =3–2 | 260.255339 | 30m/HERA | 9 | 0.90 | 0.46 | 0.20 | 5.9/11.3 | 0.06 | Mar. 2006 | |
| H13CO+ | =1–0 | 86.754288 | 30m+PdBI | 2 | 0.95 | 0.78 | 0.20 | 2.6/4.5 | 0.10 | Sep. 2006 | |
| DCO+ | =3–2 | 216.112582 | 30m/HERA | 9 | 0.90 | 0.52 | 0.11 | 1.5/2.0 | 0.10 | Mar. 2006 | |
| DCO+ | =2–1 | 144.077289 | 30m/CD150 | 2 | 0.93 | 0.69 | 0.08 | 5.9/8.7 | 0.18 | Sep. 2006 | |
| C18O | =2–1 | 219.560319 | 30m/HERA | 9 | 0.91 | 0.55 | 0.11 | – | 0.26 | May 2003 | |
| Continuum at 1.2 | 30m/MAMBO | 117 | – | – | – | – | – | – | |||
a Those columns apply to the 30m data but not to the PdBI data for the H13CO+ =1–0 line. b Two values are given for the integration time: the on-source time and the telescope time. c Noise values estimated at the position of the DCO+ peak.
1 Observations and data reduction
The DCO+ =3–2 line was observed during 2 hours of excellent winter weather ( of water vapor) using the first polarization (i.e. nine of the eighteen available pixels) of the IRAM-30m/HERA single sideband multi-beam receiver. We used the frequency-switched, on-the-fly observing mode. We observed along and perpendicular to the direction of the exciting star in zigzags (i.e. the lambda and beta scanning direction). The multi-beam system was rotated by 9.6∘ with respect to the scanning direction. This ensured Nyquist sampling between the rows except at the edges of the map. The DCO+ =2–1 was observed during 11.3 hours using the C150 and D150 single-side band receivers of the IRAM-30m under of water vapor. We used the frequency-switched, on-the-fly observing mode over a portion of the sky. Scanned lines and rows were separated by ensuring Nyquist sampling. A detailed description of the C18O =2–1 and 1.2 continuum observations and data reductions can be found in Hily-Blant et al. (2005). We estimate the absolute position accuracy to be .
We also use a small part of the H13CO+ (=1–0 and =3–2) data, which were obtained with the IRAM PdBI and 30m telescopes. The whole data set will be comprehensively described in a forthcoming paper studying the fractional ionization across the Horsehead edge (Hily-Blant et al. 2007, in prep). In short, the H13CO+ =3–2 line was observed under averaged winter weather ( of water vapor) in rasters along the direction of the exciting star using the first polarization of the unrotated HERA. Each pointing of the rasters was observed in frequency-switched mode. This resulted in a map, Nyquist sampled along the direction of the exciting star but slightly undersampled in the orthogonal direction (i.e. rows separated by instead of ). The noise increases quickly at the map edges which were seen only by a fraction of the HERA pixels. We finally used a frequency-switched, on-the-fly map of the H13CO+ =1–0 line, obtained at the IRAM-30m using the A100 and B100 3mm receivers ( of water vapor) to produce the short-spacings needed to complement a 7-field mosaic acquired with the 6 PdBI antennae in the CD configuration (baseline lengths from 24 to 176 m).
The data processing was done with the GILDAS111See http://www.iram.fr/IRAMFR/GILDAS for more information about the GILDAS softwares. softwares (Pety 2005). The IRAM-30m data were first calibrated to the scale using the chopper wheel method (Penzias & Burrus 1973), and finally converted to main beam temperatures () using the forward and main beam efficiencies ( & ) displayed in Table 1. The resulting amplitude accuracy is 10%. Frequency-switched spectra were folded using the standard shift-and-add method, after baseline subtraction. The resulting spectra were finally gridded through convolution by a Gaussian.
2 Results and discussion
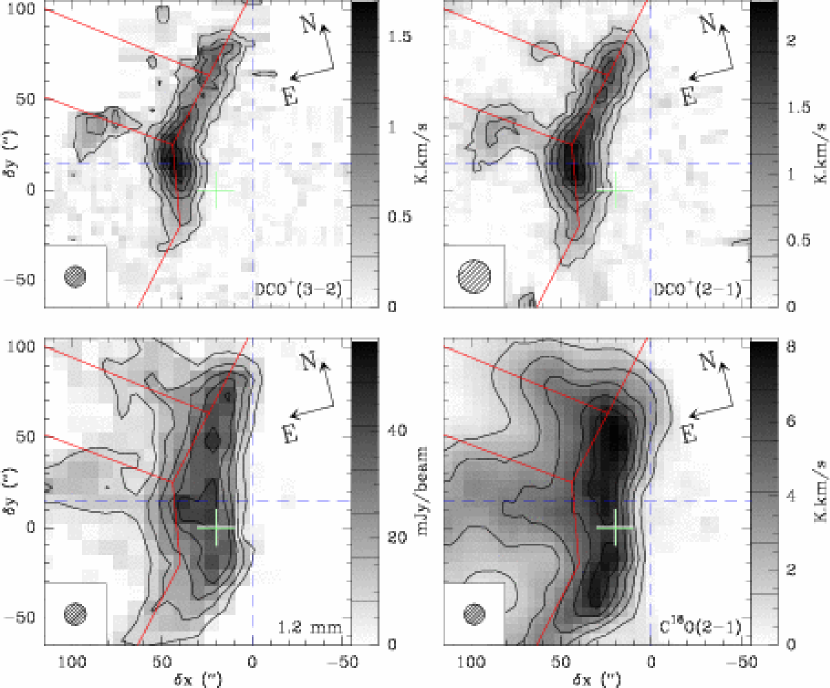
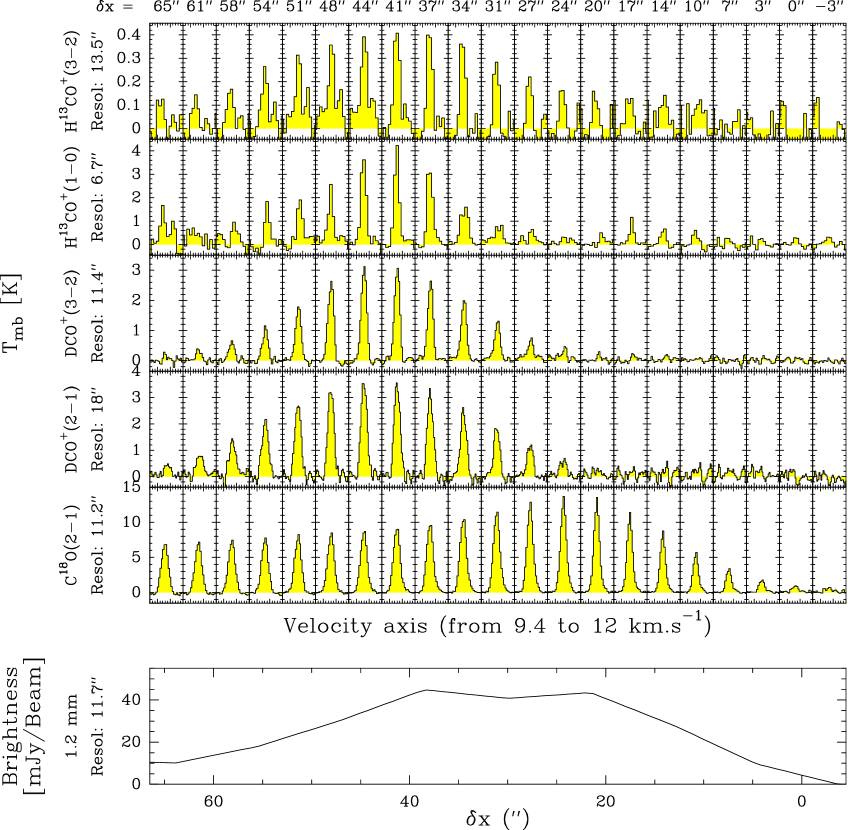
Figure 1 presents the DCO+ =2–1 and =3–2 and the C18O =2–1 integrated intensity maps, together with 1.2 continuum emission. All maps are presented in a coordinate system adapted to the source geometry, as described in the figure caption. The DCO+ emission is concentrated in a narrow, arc-like structure, delineating the left edge of the dust continuum emission. A second maximum is found at the extreme left of the map, associated with a smaller dust continuum peak. Figure 2 shows the H13CO+ and DCO+ spectra in a cut along the direction of the exciting star at (horizontal dashed line of Figure 1). This cut intersects the DCO+ emission peak which is close to the illuminated edge of the nebula ( or ). To our knowledge, this is the brightest DCO+ emission (4) detected in an interstellar cloud close to a bright H2/PAH emitting region (Habart et al. 2005; Pety et al. 2005). The spatial shift between the DCO+ and C18O/continuum emission peaks likely results from the steep thermal gradient. The region where the DCO+ emission is produced, is probably cooler than the region where the C18O lines and 1.2 mm continuum emission peak, i.e. cooler than 30, the minimum temperature needed to explain the intensity of the C18O =2–1 lines in the cloud edge (Goicoechea et al. 2006).
In order to constrain the [DCO+]/[HCO+] abundance222. ratio from the observed line emission, we assumed that both species coexist within the same gas (implying the same physical conditions). This assumption is mainly justified by the spatial coincidence of the H13CO+ and DCO+ emission peaks (i.e. where ). Besides, we used the H13CO+ lines to determine the line–of–sight HCO+ column density. Indeed, the direct determination of the HCO+ column density from its rotational line emission is hampered by the large HCO+ line opacities and their propensity to suffer from self–absorption and line scattering effects (Cernicharo & Guelin 1987). In addition, large critical densities for HCO+ (and its isotopologues) are expected even for the lowest– transitions due to its high dipole moment: D (Table 2). Hence, thermalization will only occur at very high densities. For lower densities, , subthermal excitation dominates as increases. Therefore, in order to accurately determine the mean physical conditions and the [DCO+]/[H13CO+] ratio at the DCO+ peak, we have used a nonlocal, non-LTE radiative transfer code including line trapping, collisional excitation and radiative excitation by cosmic background photons (Goicoechea 2003; Goicoechea et al. 2006). Collisional rates of H13CO+ and DCO+ with H2 and He have been derived from the HCO+–H2 rates of Flower (1999).
Assuming a maximum extinction depth of 50 along the line-of-sight where DCO+ peaks (Ward-Thompson et al. 2006), the observed DCO+ =2–1 and =3–2 line intensities are well reproduced (with line opacities 1.5) only if the gas is cold (10–20) and dense (). This high density is consistent with the one required to reproduce the CS =5–4 excitation (Goicoechea et al. 2006) and with the value derived from dust submm continuum emission (Ward-Thompson et al. 2006). The weakness of the H13CO+ =3–2 line compared to the DCO+ =3–2 line is caused in part by its larger Einstein coefficient (a factor 1.7 larger) and its higher energy level (see Table 2). This implies that the H13CO+ =3–2 line is more subthermally excited than the analogous DCO+ line for the derived densities and temperatures. Note that we have not included collisions with electrons in this excitation analysis. In fact, the expected ionization fraction in such a cold and dense condensation is usually low, (Caselli et al. 1999). The derived DCO+ and H13CO+ column densities toward the DCO+ peak are (i.e., [DCO+][H13CO+]). Assuming a 12C/13C=60 isotopic ratio (Milam et al. 2005), we finally find a abundance ratio.
| Molecule | Transition | |||
|---|---|---|---|---|
| (s-1) | (K) | (cm-3) | ||
| H13CO+ | =1–0 | 4.2 | ||
| H13CO+ | =3–2 | 25.0 | ||
| DCO+ | =2–1 | 10.4 | ||
| DCO+ | =3–2 | 20.7 |
In order to understand the observed deuterium fractionation in the dense gas close to the Horsehead PDR, we have modeled the steady state deuterium gas phase chemistry in a cloud with a proton density illuminated by a FUV field 60 times the mean interstellar radiation field. We used the Meudon PDR code333Publicly available at http://aristote.obspm.fr/MIS/, a photochemical model of a unidimensional PDR (see Le Bourlot et al. 1993; Le Petit et al. 2006, for a detailed description) and its associated chemical reaction network. As this network only includes singly deuterated species, we added the D2 and HD species and associated reactions from Flower et al. (2006). Nevertheless, these additional reactions do not affect much the predicted DCO+ abundances. Only H2, HD and D2 form on grain surfaces because the used chemical network allows only H and D atoms to accrete onto dust grains. We chose the following gas phase abundances: D/H=1.610-5, He/H=0.1, O/H=310-4, C/H=1.410-4, N/H=810-5, N/H=810-5, S/H=3.510-6 (Goicoechea et al. 2006), Si/H=1.710-8, Na/H=2.310-9 and Fe/H=1.710-9.
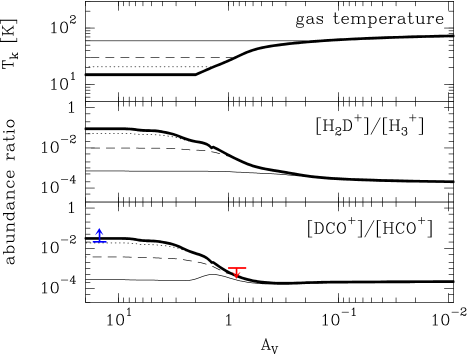
We first investigated the role of gas thermodynamics in the HCO+ deuterium fractionation. To do this, we stopped to solve the thermal balance when the FUV absorption was large enough so that the temperature reaches a minimum value that we kept constant in the most shielded regions of the PDR. Figure 3 shows the predicted temperature profiles as well as the [H2D+]/[H] and [DCO+]/[HCO+] abundance ratios as a function of the cloud depth for a minimum value of Tk=15, 20, 30 and 60. The predicted [DCO+]/[HCO+] ratio scales with the [H2D+]/[H] ratio, as expected when DCO+ gets fractionated by the reaction of CO with H2D+ and mainly destroyed by dissociative recombination with electrons (see e.g. Guelin et al. 1982). The displayed models also imply that low gas temperatures () are needed to reproduce the observed [DCO+]/[HCO+] ratio at 40-45′′ ( depending on the assumed density profile). This is easily understood because the exchange reaction between H and HD is most efficient at low temperatures (Gerlich et al. 2002). Therefore, the observed abundance ratio can be reproduced using gas phase chemistry only if the gas cools down from the photodissociation front to , in good agreement with the DCO+ excitation calculations. Note, however, that CO freeze–out is believed to further enhance the [DCO+]/[HCO+] ratio over the values predicted by pure gas phase fractionation by increasing the abundance of H and H2D+ (Brown & Millar 1989; Caselli et al. 1999). The C18O =2–1 emission shown in Figure 2 substantially decreases at the DCO+ peak. This behavior is reminiscent of CO depletion but it could also come from a combination of lower excitation and of opacity effects. Future observations of molecular tracers of gas depletion are needed to constrain the dominant scenario.
The DCO+ lines stay undetected in the warm gas where HCO+ (not shown here) and H13CO+ still emit. Indeed, DCO+ can not be abundant in the photodissociation front, where the large photoelectric heating rate implies warm temperatures (), because the reaction of H2D+ with H2 dominates and implies a low H2D+ abundance (). From the upper limit of the DCO+ emission at 10-15, we estimate a low abundance ratio in the FUV photodominated gas, in agreement with the model predictions.
The small distance to the Horsehead nebula (), its low FUV illumination and its high gas density imply that many physical and chemical processes, with typical gradient lengthscales ranging between and , can be probed in a small field-of-view (less than ). The Horsehead edge thus offers the opportunity to study in great detail the transition from the warmest gas, dominated by photodissociation processes and photoelectric heating, to the coldest and shielded gas where strong deuterium fractionation is taking place. Therefore, the Horsehead edge is the kind of source needed to serve as a reference for PDR models (Pety et al. 2006) and offers a realistic template to analyze more complex galactic or extragalactic sources.
Acknowledgements.
We thank M. Guelin for useful comments and the IRAM PdBI and 30m staff for their support during the observations. JRG was supported by an individual Marie Curie fellowship, contract MEIF-CT-2005-515340.References
- Abergel et al. (2003) Abergel, A., Teyssier, D., Bernard, J. P., et al. 2003, A&A, 410, 577
- Brown & Millar (1989) Brown, P. D. & Millar, T. J. 1989, MNRAS, 237, 661
- Caselli et al. (1999) Caselli, P., Walmsley, C. M., Tafalla, M., Dore, L., & Myers, P. C. 1999, ApJ, 523, L165
- Cernicharo & Guelin (1987) Cernicharo, J. & Guelin, M. 1987, A&A, 176, 299
- Flower (1999) Flower, D. R. 1999, MNRAS, 305, 651
- Flower et al. (2006) Flower, D. R., Pineau Des Forêts, G., & Walmsley, C. M. 2006, A&A, 449, 621
- Gerlich et al. (2002) Gerlich, D., Herbst, E., & Roueff, E. 2002, Planet. Space Sci., 50, 1275
- Goicoechea (2003) Goicoechea, J. R. 2003, PhD Thesis. Universidad Autonoma de Madrid
- Goicoechea et al. (2006) Goicoechea, J. R., Pety, J., Gerin, M., et al. 2006, A&A, 456, 565
- Guelin et al. (1982) Guelin, M., Langer, W. D., & Wilson, R. W. 1982, A&A, 107, 107
- Guilloteau et al. (2006) Guilloteau, S., Piétu, V., Dutrey, A., & Guélin, M. 2006, A&A, 448, L5
- Habart et al. (2005) Habart, E., Abergel, A., Walmsley, C. M., Teyssier, D., & Pety, J. 2005, A&A, 437, 177
- Hatchell et al. (1998) Hatchell, J., Millar, T. J., & Rodgers, S. D. 1998, A&A, 332, 695
- Hily-Blant et al. (2005) Hily-Blant, P., Teyssier, D., Philipp, S., & Güsten, R. 2005, A&A, 440, 909
- Le Bourlot et al. (1993) Le Bourlot, J., Pineau Des Forets, G., Roueff, E., & Flower, D. R. 1993, A&A, 267, 233
- Le Petit et al. (2006) Le Petit, F., Nehmé, C., Le Bourlot, J., & Roueff, E. 2006, ApJS, 164, 506
- Leurini et al. (2006) Leurini, S., Rolffs, R., Thorwirth, S., et al. 2006, A&A, 454, L47
- Linsky et al. (2006) Linsky, J. L., Draine, B. T., Moos, H. W., et al. 2006, ApJ, 647, 1106
- Milam et al. (2005) Milam, S. N., Savage, C., Brewster, M. A., Ziurys, L. M., & Wyckoff, S. 2005, ApJ, 634, 1126
- Penzias & Burrus (1973) Penzias, A. A. & Burrus, C. A. 1973, ARA&A, 11, 51
- Pety (2005) Pety, J. 2005, in SF2A-2005: Semaine de l’Astrophysique Francaise, ed. F. Casoli, T. Contini, J. M. Hameury, & L. Pagani, 721–+
- Pety et al. (2006) Pety, J., Goicoechea, J. R., Gerin, M., et al. 2006, in SF2A-2006: Semaine de l’Astrophysique Francaise, astro-ph/0612588
- Pety et al. (2005) Pety, J., Teyssier, D., Fossé, D., et al. 2005, A&A, 435, 885
- Philipp et al. (2006) Philipp, S. D., Lis, D. C., Güsten, R., et al. 2006, A&A, 454, 213
- Roberts & Millar (2000a) Roberts, H. & Millar, T. J. 2000a, A&A, 364, 780
- Roberts & Millar (2000b) Roberts, H. & Millar, T. J. 2000b, A&A, 361, 388
- Roueff et al. (2000) Roueff, E., Tiné, S., Coudert, L. H., et al. 2000, A&A, 354, L63
- Smith et al. (1982) Smith, D., Adams, N. G., & Alge, E. 1982, ApJ, 263, 123
- Solomon & Woolf (1973) Solomon, P. M. & Woolf, N. J. 1973, ApJ, 180, L89+
- Turner (1990) Turner, B. E. 1990, ApJ, 362, L29
- van Dishoeck et al. (2003) van Dishoeck, E. F., Thi, W.-F., & van Zadelhoff, G.-J. 2003, A&A, 400, L1
- Walmsley et al. (2004) Walmsley, C. M., Flower, D. R., & Pineau des Forêts, G. 2004, A&A, 418, 1035
- Ward-Thompson et al. (2006) Ward-Thompson, D., Nutter, D., Bontemps, S., Whitworth, A., & Attwood, R. 2006, MNRAS, 369, 1201
- Watson (1974) Watson, W. D. 1974, ApJ, 188, 35