119–126
Strongly triggered collapse model confront observations
Abstract
Detailed modelling of individual protostellar condensations, is important to test the various theories. Here we present comparisons between strongly induced collapse models with one young class-0, IRAS4A in the Perseus cloud and one prestellar cloud observed in the Coalsack molecular cloud.
keywords:
stars:formation, hydrodynamics, gravitation1 Introduction
Triggered star formation has been proposed since many years (see e.g. ) as an important mode of star formation. Indeed many sources of star formation triggering have been proposed and are discussed in this volume, namely turbulence, supernovae remnants, ionisation fronts, stellar outflows or large scale collapse. All of these processes ought to play a rôle in inducing star formation and probably have their own signatures. In order to be able to identify and to quantify their relative importance, it is necessary to study in great details protostellar condensations in which the collapse has been externally induced, looking for signatures of such violent triggering.
Here we present detailed comparisons between induced collapse models and 2 observed sources in which external triggering may have taken place, namely IRAS4A a well observed class-0 condensation located in the NGC1333 complex and the G2 globule located in the Coalsack molecular cloud.
In section 2, we first describe the models with which comparison will be performed. In section 3, comparison with IRAS4A is presented whereas comparison with the G2 globule is described in section 4.
2 Spontaneous versus induced collapse

In order to compare in details, observations of protostellar cores with theoretical models, it is necessary to construct a class of models which on one hand is realistic enough but on the other hand sufficiently simple to be described by few parameters that can be easily varied. It is for example unlikely or at least computationally expensive to find in large scale turbulence simulations, a core which fits sufficiently well an observed object to allow very detailed comparisons. Our approach is as described in Hennebelle et al. (2003, 2004). We setup initially a stable Bonnor-Ebert sphere and we increase the external pressure at a given rate. In order to quantify the rapidity of the pressure increasement, we define where is the cloud radius, the sound speed, the pressure and its time derivative. represents therefore the ratio of the sound crossing time over the typical pressure increasement time. Large values of correspond to slow pressure increasement and describe a spontaneous collapse whereas for small values of , the collapse is strongly externally triggered. The calculations have been done with the SPH technique.
Figure 1 shows the density and the velocity field in the equatorial plan before and after protostar formation for a spontaneous collapse () and for a strongly triggered collapse (). In the first case, the density appears to be close to a Bonnor-Ebert sphere density in the prestellar phase, even when the cloud has become unstable, and close to the density of the singular isothermal sphere (SIS) during the class-0 phase. The velocity remains subsonic during the prestellar phase and in the core outer part in the class-0 phase. It becomes more and more supersonic as the collapse proceeds, in the inner part. The situation is much different for . The velocity is supersonic in the outer part of the core during prestellar phase and everywhere during class-0 phase. The density is also very different from the previous case. It is higher in outer part than in the center. Indeed the strong pressure increasement has launched a compression wave that propagates indwards. During the class-0 phase, the density is significantly denser than the SIS density. All of these features appear therefore to be characteristic of externally induced collapse.
3 Comparison with the young class-0 IRAS4A
NGC1333 is a well studied regions of the Perseus cloud. Several outflows have been detected (Knee & Sandell 2000), at least one of them is pointing towards IRAS4A making the possibility of induced collapse for this source rather plausible. IRAS4A has been observed in various molecular lines by Di Francesco et al. (2001) and in the continuum by Motte & André (2001). Di Francesco et al. (2001) inferred supersonic velocity (0.5-1 km/s) whereas Motte & André (2001) observed density up to 10 times the SIS density. As recalled in previous section, both are signatures of induced collapse. This has been confirmed by observations done recently by Belloche et al. (2006).
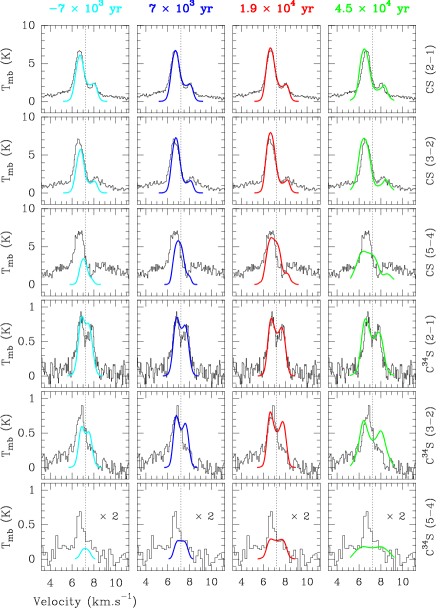
In order to confirm the scenario of induced collapse for IRAS4A and to set accurate constraints, we have calculated synthetic spectra in the available lines, using the radiative transfer code described in Belloche et al. (2002) for the model presented in the previous section. Figure 2 shows the comparison between the data and the synthetic profiles at 4 time steps before and after protostellar formation. The comparison reveals that good agreement can be obtained for almost all lines at time yr whereas at earlier times synthetic lines are generally too narrow and at later times, they are generally too broad. As can be seen various features are not well reproduced even at time yr. For example the large wings seen in CS(2-1) are most probably due to the outflow launched by IRAS4A which is not taken into account in our modelling. It is also seen that C is poorly reproduced. We speculate that the reason for this disagreement is that this line being optically thin, it traces the outer part of the core. The asymmetry of the lines may reveal that the collapse on large scales is indeed not symmetric.
We conclude that IRAS4A can be reasonably well reproduced by our model although further refinements are highly wishable.
4 Comparison with the prestellar G2 globule of Coalsack

Lada et al. (2004) have recently observed in the Coalsack molecular cloud a core which presents an unusual ring-like structure around its centre. The column density appears therefore to decrease indwards when one appoaches the core centre. Qualitatively this feature may have similarity with the compression wave shown in figure 1. In our model the compression wave is a dense shell which in projection could be seen as a ring. To test the validity of this scenario, we have compared the column density observed by Lada et al. (2004) with the column density of our model at various time steps (Hennebelle et al. 2006). Figure 3 displays the density, velocity and column density fields at 3 time steps as well as the column density observed by Lada et al. (2004). The column density of the second case appears to be in good agreement with these observations. However no conclusion should be drawn until kinematical data are available for this core (only one spectrum has been observed). Indeed we have calculated synthetic spectra, under optically thin assumption, towards various positions. Our model predicts that toward the centre, the lines should be strongly splitted. This prediction should be easy to test and we look forward to future observations of this peculiar object.
References
- [] Belloche, A., André P., Despois, D., Blinder S., 2002, A&A, 393, 927
- [] Belloche, A., Hennebelle, P., André P., 2006, A&A, 453, 145
- [] Di Francesco, J., Myers, P.; Wilner, D., Ohashi, N., Mardones, D., 2001, ApJ, 562, 770
- [] Hennebelle, P., Whitworth, A. , Gladwin, P., André, P., 2003, MN, 340, 870
- [] Hennebelle, P., Whitworth, A. , Cha, S.-H., Goodwin, S. P., 2004, MN, 348, 687
- [] Hennebelle, P., Whitworth, A. , Goodwin, S., 2006, A&A, 451, 141
- [] Knee, L., Sandell, G., 2000, A&A, 361, 671
- [] Lada, C., Huard, T., Crews, L., Alves, J., 2004, ApJ, 610, 303
- [] Motte, F., André, P., 2001, A&A, 365, 440