Ecole Normale Supérieure de Lyon, Lyon, France
11email: herve.wozniak@obs.univ-lyon1.fr
The distribution of stellar population age in galactic bars
Abstract
Context. Recent analysis of stellar populations in barred galaxies have focused on the spatial distribution of stellar population ages and metallicities. However, barred galaxies are complex objects where dynamical instabilities play a leading role in shaping any spatial distribution.
Aims. The age distribution of stellar populations should thus be analyzed from the two points of view of stellar population evolution and dynamical secular evolution.
Methods. Chemodynamical simulations of single barred galaxies with simple but realistic star formation and feedback recipes are used to produce face-on mass-weighted maps of stellar population ages. Luminosity-weighted maps in V-band are also displayed after calibrating the simulation with mass-to-light ratios provided by a synthesis population model.
Results. It is shown that inside a stellar bar two persistent diametrically opposed regions display a mean age lower than the surrounding average. These two low-age regions are due to the accumulation of young stellar populations trapped on elliptical-like orbits along the bar, near the ultra-harmonic resonance. Age gradients along the bar major-axis are comparable to recent observations. Another low-age region is the outer ring located near the Outer Lindblad Resonance, but the presence and strength of this structure is very time-dependent.
Key Words.:
Galaxies: stellar content – Galaxies: kinematics and dynamics – Galaxies: nuclei – Galaxies: structure – Galaxies: spiral1 Introduction
Thanks to the improvement in stellar libraries, population synthesis models, and inversion algorithms, dating of stellar populations in galaxies and determination of star formation history has become a very active field. Indeed, the integrated spectra of galaxies provides a huge number of information on the current stellar populations and the history of their formation. Moreover, they simultaneously provide an insight into their current dynamical state that results both from the history of the mass assembling and their secular evolution. However, when the spectral information is combined with the spatial one, as for integral field spectrographs or even long-slit spectroscopy of nearby galaxies, one hits a snag because the spatial variation of the star formation history cannot be understand without any knowledge on the stars and gas dynamics. It is thus difficult or even impossible to unravel the two histories, the gravitational dynamics from the star formation, since the physical mechanisms at play during any galaxy life are so much intricately mixed. A direct approach, using N-body and hydrodynamical simulations coupled with small scale recipes of star formation and feedback, is thus useful to disentangle the two histories even at the cost of very simplified physical assumptions.
In the zoo of galaxies, barred galaxies deserve a special attention since they represent more than 75% of all disc galaxies in the local Universe. Most of them are still forming stars so that in the same object we can find several generations of stellar populations, of various ages and metallicities. The interpretation of age and/or metallicity gradients in barred galaxies are thus not straightforward. Using numerical simulations, Friedli et al. (fbk94 (1994)) found that a bar is able to flatten abundance gradients in the disc, in agreement with most observations of O/H gradients. They did not investigate the effects of the bar on the age distribution.
The main goal of this Letter is thus to provide qualitatively the age distribution of stellar populations in typical barred galaxies. Chemodynamical simulations, calibrated using Michel-Dansac & Wozniak (mw04 (2004)) technique, have been used to produce luminosity- and mass-weighted maps of stellar population ages. I discuss the origin and persistence of some features in the framework of the orbital structure of stellar bars.
2 A simple and generic chemodynamical model
An initial stellar population is set up to reproduce a typical disc galaxy. Positions and velocities for particles are drawn from a superposition of two axisymmetrical Miyamoto & Nagai (mn75 (1975)) discs of mass respectively and M⊙, of scale lengths respectively and kpc and common scale-height of kpc. Initial velocity dispersions are computed solving numerically the Jeans equations. The initial disc radius is 30 kpc. The gaseous component is represented by 50 000 particles for a total mass of M☉ distributed in a 6 kpc scale-length Miyamoto-Nagai disc.
Evolution is computed with a particle–mesh N-body code which includes stars, gas and recipes to simulate star formation. The broad outlines of the code are the following: the gravitational forces are computed with a particle–mesh method using a 3D log–polar grid with active cells. The smallest radial cell in the central region is 36 pc large and the vertical sampling is 50 pc. The extent of the mesh is 100 kpc in radius and kpc in height. The hydrodynamical equations are solved using the SPH technique. Since I used a polar grid, the pre-computation of self-forces have been improved by subdividing each cell in sub-cells. Self-forces are then linearly interpolated before being subtracted from gravitational forces. The spatial and forces resolutions are thus much higher than in our previous studies based on the same code (e.g. Michel-Dansac & Wozniak, mw04 (2004, 2006)).
The star formation process is based on Toomre’s criterion for the radial instability of gaseous discs (cf. Michel-Dansac & Wozniak mw04 (2004) for more details). When star formation is active, the radiative cooling of the gas is computed assuming a solar metallicity.
This simulation has been chosen as being illustrative of a moderately barred galaxy.
At the end of the simulation ( Gyr), the total number of particles is roughly for the stellar component and for the gaseous one. 46% of the gas have been transformed into stellar particles, mainly in the central 10 kpc. However, in this relatively wide region, the new population (called ’young’ hereafter) accounts for roughly 5% of the total mass (gas and stars) while in the central kpc, the young population accounts for roughly 17% of the total mass.
This paper being focused on the expected age distribution, as inferred from numerical simulations, a photometric calibration was performed as in previous studies (e.g. Michel-Dansac & Wozniak mw04 (2004, 2006)) using the information about the age and the metallicity of each particle. I follow closely Michel-Dansac & Wozniak (mw04 (2004)). For each stellar particle, given its age and metallicity, the mass-to-light ratio is obtained from a bi-linear interpolation into the tables of Bruzual & Charlot (bc03 (2003)), for a Salpeter initial mass function (IMF), with mass cut-off at 0.1 and 100 M☉. Then, luminosity of the particle (), in the V-band, is computed according to its mass (), birth metallicity () and the time elapsed since its birth ():
An age of 5 Gyr is assumed for the initial population at the beginning of the simulation and a solar metallicity. Other assumptions have been tried, in particular imposing an initial metallicity gradient similar to our Galaxy or setting a younger or older initial population, but I found that the results are qualitatively independent of the choice.
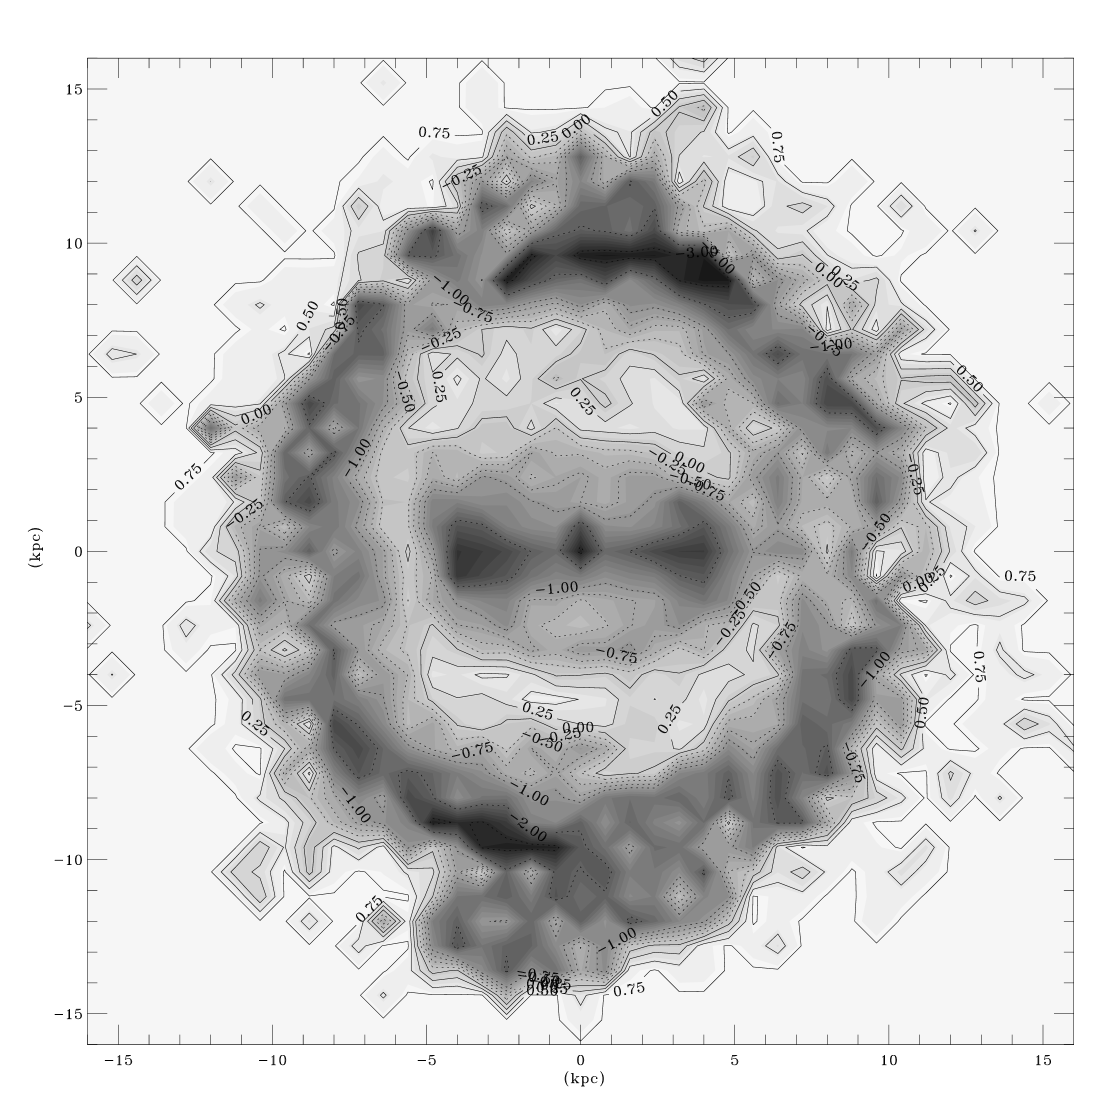
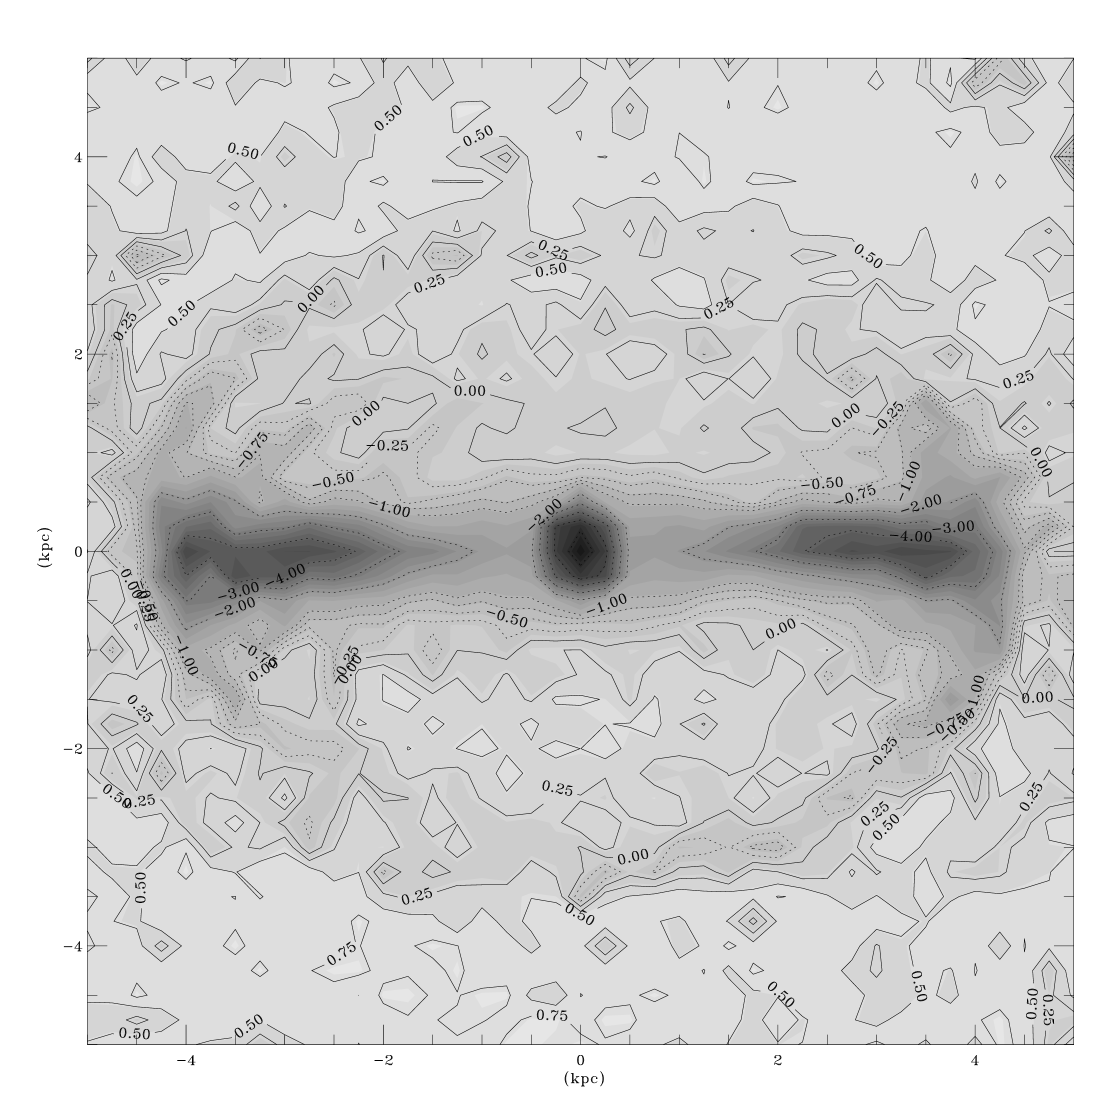
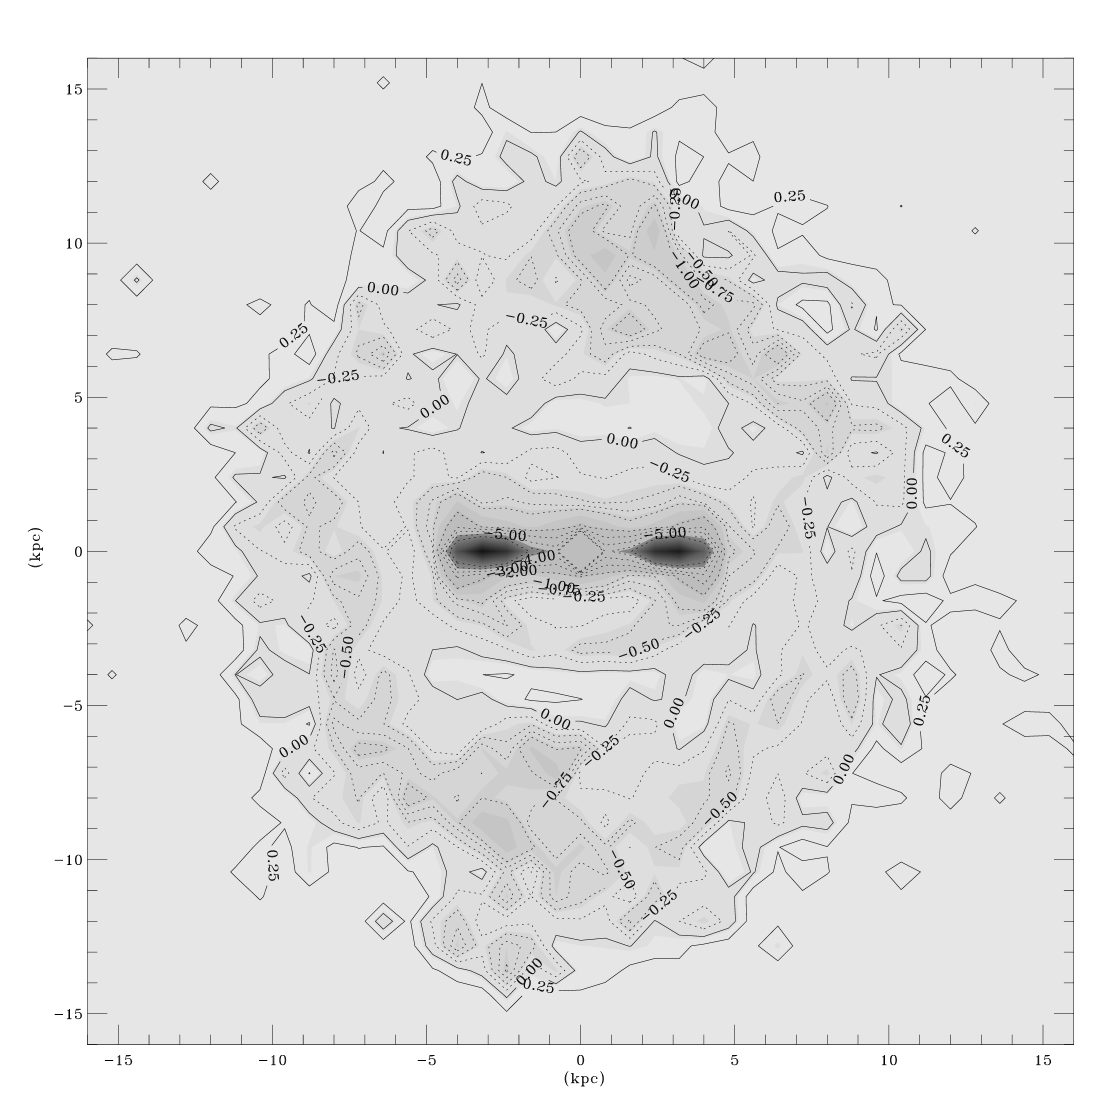
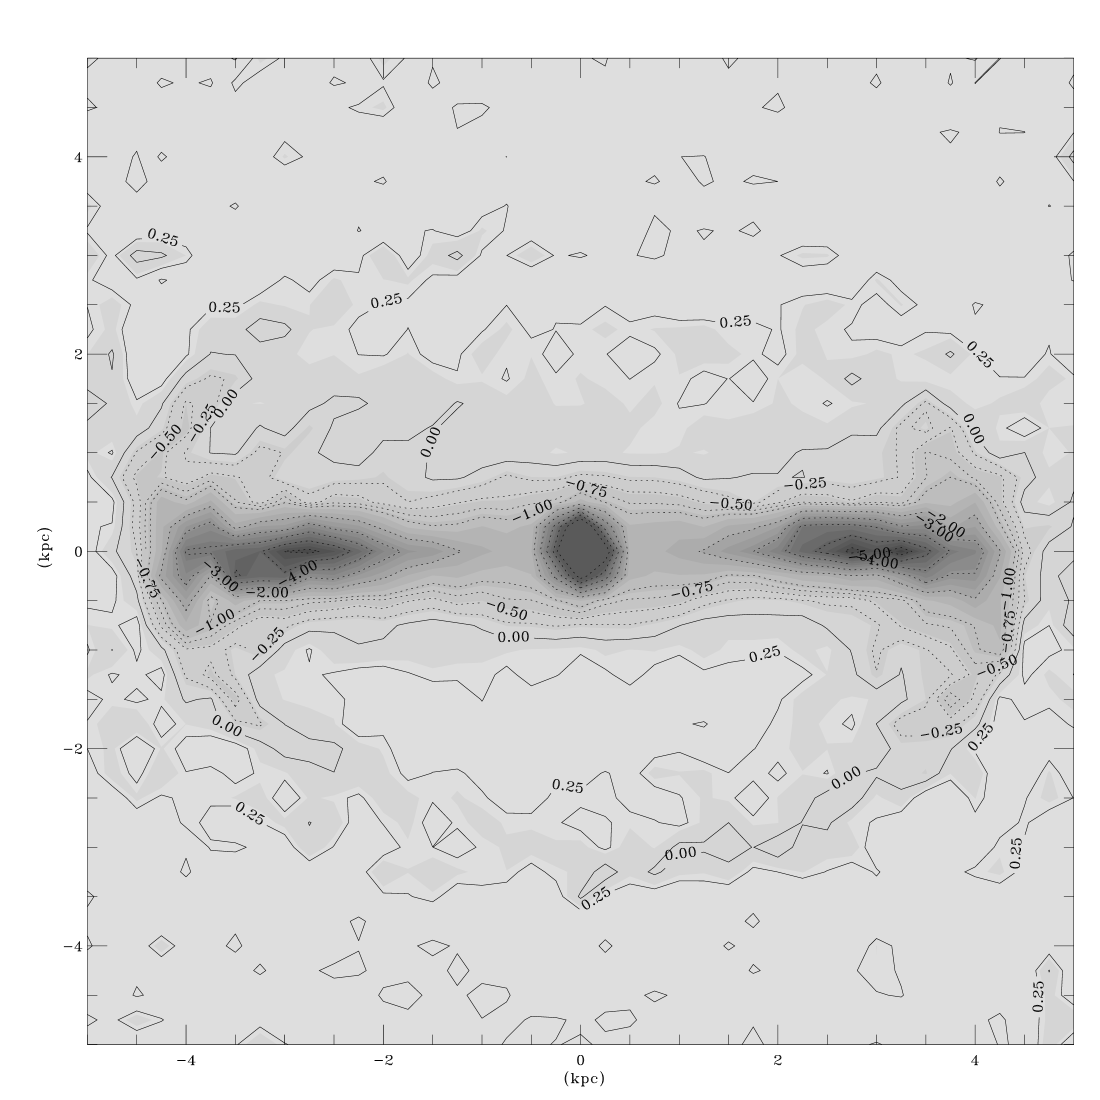
Two-dimensional maps of the age distribution have been computed. A low resolution of 4141 pixels has been chosen to smooth out the many meaningless features due to the fluctuation of the number of particles. For each pixel, the average age is the sum of each particle ages weighted either by its mass or by its luminosity. These maps are displayed in Fig. 1 and 2 for the particular time Gyr chosen to be illustrative of all others snapshots.
3 Mass- and Luminosity-weighted age distribution
The ages should be use with caution. Indeed, most likely the initial population should have a complex star formation history due in part to the assembly of the galactic disk and bulge and in other part to its internal dynamical secular evolution. However, to limit the number of free parameters, all the initial population particles have the same age. The amplitude of age differences from one place to another in the simulation is thus meaningless since it obviously depends on the age of the initial population. On the contrary, when a region is dominated by the luminosity of a young population, it remains identified as a low-age region whatever the age of the initial population because the mass-to-light ratio of the young population is much lower than the old one. For this reason, I plot in Fig. 1 and 2 the deviation from the mean age as a fraction of the standard deviation. This highlights several regions of interest whereas the basic qualitative results are thus independent of the assumption made about the old (initial) population.
At large scale (Fig. 1 top), the two structures with populations younger than the mean, are the stellar bar of kpc length and the outer ring (or pseudoring, see discussion in the next Section) that encircles it. The youngest regions along the ring are shifted by 10 to 20 degrees since star formation is provoked by the compression in the enrolling gaseous spiral arms which are trailing the bar. However, looking at various calibrated snapshots between 0 and 3 Gyr, the distribution and morphology of the low-age regions in the ring appear very time-dependent. Fig. 1 is thus only a particular example of such a distribution.
At the scale of the bar (Fig. 1), the young population is mainly visible along the major-axis of the bar. Apart from the central kpc, that is the site of a regular star formation due to the gas inflow, the youngest regions are mainly located between roughly 2 and 4 kpc from the centre. On the contrary to the outer ring, these low-age regions are persistent, at roughly the same place, that is near the end of the stellar bar. The morphology of these regions slightly changes with time but not their location. At Gyr (Fig. 1), it is noteworthy that their outermost parts looks like trailing spiral arms, the rotation being anti-clockwise.
It is noteworthy that the intermediate region between the bar and the ring is depleted from a young and bright population. In this region the age of the population is thus quite similar to that of the outer disc, beyond the outer ring. The ages deviate by roughly standard deviation from the map average.
The luminosity calibration in the V-band obviously enhances the region of low-age particles since the mass-to-light ratio of these populations is lower than for the initial one (assumed here to be 5 Gyr old at the beginning of the simulation, so 6.2 Gyr for the snapshot displayed). The mass-weighted is much more meaningful for a dynamical analysis (cf. Fig. 2).
4 Discussion
It is noteworthy that the bar low-age regions are just inside or close to the ultra-harmonic resonance (or 4/1, hereafter called UHR). In Fig. 3, I select all the particles of the young population for which kpc and kpc at Gyr. The linear UHR radius is kpc. The formation history of these particles is obviously the staking of several episodes of active star formation occurring at various places in the galaxy as shown by the star formation history of these regions (cf. Fig. 3).
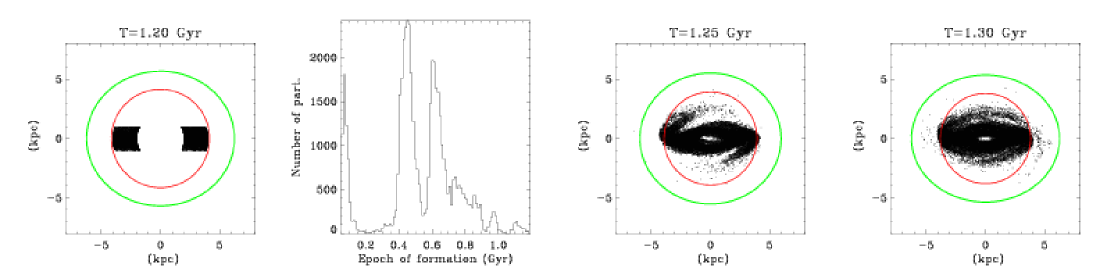
The fact that all these particles lie near the UHR along the major-axis of the bar does not mean that they were born at this place and will remain for a long time. Indeed, the bar dynamics is particularly efficient in dissolving these regions since 50 and 100 Myr later, all these particles are spread out in a wider region. Particles trapped by elliptical-like orbits (e.g. family in the equatorial plane) remain inside a region approximately limited by the UHR radius whereas particles with higher energy can fill a wider region limited only by the corotation. For some snapshots, particles have even enough energy to possibly cross over the corotation and lie in the disc for a while (the so-called ’hot’ population).
The explanation for the persistence of the low-age regions is then straightforward. Indeed, particles trapped by elliptical-like families of orbits spend most of their time at the apocentre of their orbits. The accumulation of young particles on the inner side of the UHR is thus simply due to the vanishing radial velocity in this region. This is thus a pure effect of the bar dynamics.

These low-age regions have been already observed in a few barred galaxies (Pérez et al. psz07 (2006); S. Courteau, L. MacArthur private communication), using various age and metallicity indicators. In particular, Pérez et al. (psz07 (2006)) recently claimed that in their sample of 6 barred galaxies, the outer parts of all stellar bars are younger than the internal parts. To make a crude comparison with their radial plots of H and H indices I display in Fig. 4 a cut made through the age distribution map of Fig. 1. The width of the averaging ‘slit’ has been taken similar to observations, that is 360 pc wide. The age radial profile displays a strong gradient as in some observations mentioned above. However, a definitive comparison of population ages with H or H age indicators certainly deserves an in depth analysis using a spectral calibration of the simulation particles which is beyond the scope of this Letter. Moreover, a more detailed comparison with these observations will certainly allow some tuning of the initial population parameters of my chemodynamical simulations.
In the central kpc, the situation is quite more complex. Following the previous reasoning, the tangential velocity of particles on -like orbits is maximum at the pericentre. The time they spend in the central region is thus very short. However, several generations of particles are created in the central kpc. This population is, by the way, responsible of the so-called -drop phenomenon (Wozniak et al. wcef03 (2003)). But, trapped into the potential well, they mainly remain confined in the circumnuclear region (Wozniak & Champavert wc06 (2006)). As long as the central region is forming stars, the mean age will remain several standard deviation lower than the average.
Age gradients and spatial fluctuations are however not expected to be very high except inside the bar as discussed above. Indeed, for particles not trapped inside the UHR, the gravitational torques exerted by the bar on the whole disc is a very efficient dynamical process to disperse young population. Fig. 3 shows that the particles located in the low-age regions at Gyr are rapidly scattered. The diffusion timescale is rather short, all particles being mixed in less than 100 Myr. This is in agreement with the findings of Friedli et al. (fbk94 (1994)) that the bar is responsible to shallow any metallicity gradient outside corotation.
The low-age ring that encircles the bar must be undoubtedly associated with the so-called outer resonant ring phenomenon, since the linear Outer Lindblad Resonance is located at roughly 8.84 kpc. According to Buta & Combes (bc96 (1996)), this sort of rings appear as blue components, sites of active star formation, on deep images, in about one fifth of all spiral disk galaxies. It is noteworthy that one third hosts pseudorings that are broken or partial rings made up of spiral arms. The feature displayed in Fig. 1 is thus rather a pseudoring than a ring.
5 Conclusion
Two diametrically opposed regions, located near the end of stellar bars are expected to host a composite stellar population with a mean age lower than the average. These two low-age regions have a dynamical origin since they are due to the accumulation of young stellar populations trapped in elliptical-like orbits along the bar, near the ultra-harmonic resonance.
The central region is also a low-age region because of the sustained star formation activity generated by the gas accumulation inside the ILR. Thus, between the nuclear region and the ends of a bar, the population age displays strong gradients or varying slopes, in agreement with recent observations.
Another low-age region is the outer ring located near the Outer Lindblad Resonance, but the presence, strength and morphological details of this structure is time-dependent.
Acknowledgements.
I am very grateful to S. Courteau, L. MacArthur, P. Sánchez-Blázquez and I. Pérez for lively discussions on the age of stellar population in barred galaxies during the IAU Symposium 241 in La Palma. Computations have been performed on a 18 nodes cluster of PC funded by the INSU/CNRS (ATIP No 2JE014 and Programme National Galaxie).References
- (1) Bruzual G., Charlot S., 2003, MNRAS, 344, 1000
- (2) Buta R., Combes F., 1996, Fund. Cosmic Phys. 17, 95
- (3) Friedli D., Benz W., Kennicutt R., 1994, ApJ 430, L105
- (4) Michel-Dansac L., Wozniak H., 2004, A&A, 421, 863
- (5) Michel-Dansac L., Wozniak H., 2006, A&A, 452, 97
- (6) Miyamoto M., Nagai R., 1975, PASJ 27, 533
- (7) Pérez I., Sánchez-Blázquez P., Zurita A., 2006 A&A submitted (astro-ph/0612159)
- (8) Wozniak H., Champavert N., 2006, MNRAS 369, 853
- (9) Wozniak H., Combes F., Emsellem E., Friedli D., 2003, A&A, 409, 469