119–126
Radial distributions of spectral absorption indices in spiral disks
Abstract
We present a grid of 440 spectro-photometric models for simulating spiral and irregular galaxies. They have been consistently calculated with evolutionary synthesis models which use as input the information proceeding from chemical evolution models. The model predictions are spectral energy distributions, brightness and color profiles and radial distributions of spectral absorption stellar indices which are in agreement with observations.
keywords:
Stellar populations, Galaxies: spiral, Galaxies: dwarf, Galaxies: Abundances1 Evolutionary Synthesis Models for Spiral Galaxies
Spectrophotometric data, such as spectral energy distributions (SED), colors and spectral absorption stellar indices, are interpreted by mean of evolutionary synthesis models (ESM) that usually provide their predictions for the so-called Single Stellar Populations (SSP). These data are also available for spiral and irregular galaxies, although absorption spectral indices, mainly their radial distributions along the disks have been only recently obtained due to their arduous detection, for a certain number of spirals in [Beauchamp & Hardy(1997), Mollá, Hardy & Beauchamp(1999), Ryder, Fenner & Gibson(2005)].
Spiral disks show a large complexity since they are composed by a mixing of stellar populations and show spatial variations along the disks and special phenomena as bars and outflows. The use of the SSPs predictions to analyze these data is inappropriate since in that case, the SED, , corresponds to the sum of different SSP SEDs, (t); that is, a convolution with the star formation history (SFH), , must be done:
| (1) |
where . and are the SED of the SSP’s.
The SFH and the age-metallicity relation (AMR), , necessary to assign to each time step, are, however, unknown. But the present time state of a disk galaxy is known since emission lines from Hii regions, from which elemental abundances are estimated, are observed. These data, and other gas information, are usually interpreted by mean of chemical evolution models (CEM). Thus, our idea is to fit the present time data of a given spiral or irregular galaxy with a CEM and then to use the evolutionary histories thus produced as input of a ESM. This technique of combining both types of data, those from the gas, and the spectro-photometric ones from stars, to better search for the possible evolution of a given spiral galaxy, has been successfully used to compute absorption spectral indices in [Mollá, Hardy & Beauchamp(1999)], by demonstrating its validity. We now apply the outlined method to the grid of CEMs from [Mollá & Díaz(2005)]. The SFH and AMR of each radial region are the input of Eq. 1 to calculate and thus colors, surface brightness and spectral absorption indices profiles.
2 Model results and conclusions
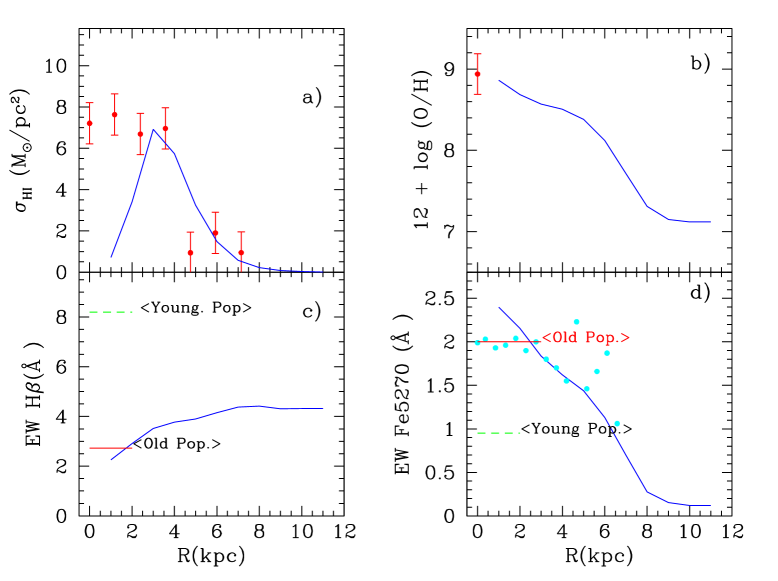
Fig. 1 shows the model results for NGC 4900, a SBb spiral galaxy. Top panel are results of the CEM which fits the present day data. The oxygen abundance shows a radial gradient with a central value similar to that one estimated by [Cantin et al.(2006)]. The Hi predicted density shows a good fit for the disk, except the inner region with a density lower than observed. The disk modeled star formation rate is in agreement with the data ( M⊙ yr-1). The model predicts, however, a value one order of magnitude smaller than observed for the center. An infall of gas from the disk, and a consequent burst of star formation, due to the effect of a bar may explain these differences model-data. They are also apparent in spectral indices such as the bidimensional spectroscopy data from [Cantin et al.(2006)], marked in Fig. 1, show. In the bar, where young stellar populations over a subjacent old stellar population there exist, the spectral indices and higher Hβ are smaller –green dashed lines– than predicted, and actually observed out of the bar. We conclude that our models are useful to interpret adequately complex disk galaxies, in particular the barred ones.
References
- [Beauchamp & Hardy(1997)] Beauchamp, D., & Hardy, E. 1997, AJ, 113, 1666
- [Cantin et al.(2006)] Cantin, S., Robert. C., Pellerin, A. & Mollá, M. 2005, New Astronomy Review, 49, 536
- [Mollá & Díaz(2005)] Mollá , M., & Díaz , A. I. 2005, MNRAS, 358, 521
- [Mollá, Hardy & Beauchamp(1999)] Mollá, M., Hardy, E., & Beauchamp, D. 1999, ApJ, 513, 695
- [Ryder, Fenner & Gibson(2005)] Ryder, S. D., Fenner, Y., & Gibson, B. K. 2005, MNRAS, 358, 1337
- [Warmels(1988)] Warmels, R. H. 1988, A&AS, 72, 427